. 2022 Jul 1;79(7):677-689.
doi: 10.1001/jamapsychiatry.2022.1163.

Clinical, Brain, and Multilevel Clustering in Early Psychosis and Affective Stages

Collaborators, Affiliations

Clinical, Brain, and Multilevel Clustering in Early Psychosis and Affective Stages

Dominic B Dwyer et al. JAMA Psychiatry. .

Abstract

Importance: Approaches are needed to stratify individuals in early psychosis stages beyond positive symptom severity to investigate specificity related to affective and normative variation and to validate solutions with premorbid, longitudinal, and genetic risk measures.

Objective: To use machine learning techniques to cluster, compare, and combine subgroup solutions using clinical and brain structural imaging data from early psychosis and depression stages.

Design, setting, and participants: A multisite, naturalistic, longitudinal cohort study (10 sites in 5 European countries; including major follow-up intervals at 9 and 18 months) with a referred patient sample of those with clinical high risk for psychosis (CHR-P), recent-onset psychosis (ROP), recent-onset depression (ROD), and healthy controls were recruited between February 1, 2014, to July 1, 2019. Data were analyzed between January 2020 and January 2022.

Main outcomes and measures: A nonnegative matrix factorization technique separately decomposed clinical (287 variables) and parcellated brain structural volume (204 gray, white, and cerebrospinal fluid regions) data across CHR-P, ROP, ROD, and healthy controls study groups. Stability criteria determined cluster number using nested cross-validation. Validation targets were compared across subgroup solutions (premorbid, longitudinal, and schizophrenia polygenic risk scores). Multiclass supervised machine learning produced a transferable solution to the validation sample.

Results: There were a total of 749 individuals in the discovery group and 610 individuals in the validation group. Individuals included those with CHR-P (n = 287), ROP (n = 323), ROD (n = 285), and healthy controls (n = 464), The mean (SD) age was 25.1 (5.9) years, and 702 (51.7%) were female. A clinical 4-dimensional solution separated individuals based on positive symptoms, negative symptoms, depression, and functioning, demonstrating associations with all validation targets. Brain clustering revealed a subgroup with distributed brain volume reductions associated with negative symptoms, reduced performance IQ, and increased schizophrenia polygenic risk scores. Multilevel results distinguished between normative and illness-related brain differences. Subgroup results were largely validated in the external sample.

Conclusions and relevance: The results of this longitudinal cohort study provide stratifications beyond the expression of positive symptoms that cut across illness stages and diagnoses. Clinical results suggest the importance of negative symptoms, depression, and functioning. Brain results suggest substantial overlap across illness stages and normative variation, which may highlight a vulnerability signature independent from specific presentations. Premorbid, longitudinal, and genetic risk validation suggested clinical importance of the subgroups to preventive treatments.


Conflict of interest statement

Conflict of Interest Disclosures: Dr Dwyer was supported by a NARSAD Young Investigator Grant (grant 30196). Dr Sanfelici reported personal fees from Lundbeck/Otsuka outside the submitted work. Dr Hauke reported grants from Swiss National Science Foundation (grant 200054) during the conduct of the study. Dr Schmidt-Kraepelin reported grants from the European Union during the conduct of the study and had a patent for DE 102020106962.6 issued. Ms Penzel reported grants from German Academic Exchange Service outside the submitted work. Dr Lichtenstein reported grants from Koeln Fortune Program/Faculty of Medicine, University of Cologne (grant 370/2020) during the conduct of the study. Dr Riecher-Rössler reports grants from the Zurich Program for Sustainable Development of Mental Health Services (ZInEP). Dr Andreou reports nonfinancial support from Sunovion and Lundbeck outside the submitted work. Dr Hietala reports personal fees from Orion, Otsuka, and Lundbeck and other support from Takeda during the conduct of the study. Dr Schirmer reported personal fees from GE Healthcare as an employee during the conduct of the study and outside the submitted work. Dr Michel reports grants from Swiss National Foundation during the conduct of the study. Dr Rössler reported grants from private foundation certified by health authorities during the conduct of the study. Dr Pantelis reported grants from Australian National Health & Medical Research Council during the conduct of the study, grants from Lundbeck Foundation outside the submitted work, and personal fees from Lundbeck Australia Pty Ltd outside the submitted work. Dr Lencer reported personal fees from Janssen and Otsuka outside the submitted work. Dr Borgwardt reported personal fees from Janssen outside the submitted work. Dr Noethen reports fees for memberships in advisory boards from the Lundbeck Foundation, the Robert-Bosch-Stiftung, HMG Systems Engineering GmbH, and the Medical-Scientific Editorial Office of the Deutsches Ärzteblatt; receives reimbursed travel expenses for a conference participation by Shire Deutschland GmbH; receives salary payments from Life & Brain GmbH, and holds shares in Life & Brain GmbH outside the submitted work. Dr Brambilla reported grants from University of Milan PRONIA project supported by a grant from the European Union under the 7th Framework Programme (grant 602152] during the conduct of the study. Dr Davatzikos reported funding from the National Institute of Mental Health project PHENOM (grant R01MH112070). Dr Upthegrove reported grants from European Union FP7 during the conduct of the study and reports personal fees from Sunovion and Vyvalife outside the submitted work. Dr Koutsouleris reported a patent for US10463313B2 issued. Drs Koutsouleris and Meisenzahl hold issued patent US20160192889A1 (adaptive pattern recognition for psychosis risk modelling’). Drs Koutsouleris, Ruhrmann, Riecher-Rössler, Romer, and Wood report grants from European Union during the conduct of the study. No other disclosures were reported.

Figures

Figure 1.
Figure 1.. Clinical Multigroup Radar Plots Demonstrating Distinctive Factor Loading Patterns for 4 Subgroups and Summary of Findings
A, The mean factor loadings from each subgroup within the discovery sample corresponding to B, the factor table indicating predominant loadings on positive psychosis symptoms (factor 1), negative psychosis symptoms (factor 2), depression symptoms (factor 3), and quality of life and role functioning (factor 4). C-F, The factor loadings shown separately for each subgroup containing the discovery sample loading (dark shade) and following application of the discovery sample models without modification to the validation sample (light shade). The validation sample subgroup assignments were calculated independently of the sparse nonnegative matrix factorization in the discovery sample using supervised learning techniques. A summary of findings is provided outlining characteristics of each subgroup described in further analyses (see Results) for: the clinical subgroup 1 (C1; positive symptoms, distress, and basic symptoms); the C2 subgroup (negative symptoms, functional impairment, and premorbid functioning); the C3 subgroup (depressive symptoms, change in mood, and role functioning subgroup); and the C4 subgroup (quality of life, role functioning, and social functioning subgroup). BDI indicates Beck Depression Inventory; B3, brain subgroup 3; CHR-P, clinical high risk for psychosis; HC, healthy controls; N1, social anhedonia; P1, unusual thought content/delusional ideas; P2, suspiciousness/persecutory ideas; P4, perceptual abnormalities/hallucinations; PRS, polygenic risk scores; ROD, recent-onset depression; ROP, recent-onset psychosis; SANS, Scale for the Assessment of Negative Symptoms; SIPS, Structured Interview for Prodromal Symptoms; SPI-A, Schizophrenia Proneness Instrument, Adult version; WHOQoL, the World Health Organization Quality of Life Brief Version.
Figure 2.
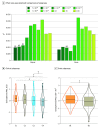
Figure 2.. Brain-Derived Subgroup Results
A, The factors associated with each brain subgroup in the discovery sample: (1) cerebrospinal fluid (CSF) of the frontoparietal cortex and insula (factor 1); (2) frontal-subcortical gray matter (GM) (factor 2). B, The percentage of variance explained from each factor within each brain subgroup (B1, proportionately more factor 1; B2, proportionately more factor 2). C, Specific brain differences analyzed with whole-brain voxel comparisons of the GM map (familywise error–corrected P < .05; proportionately scaled to total intracranial volume and corrected for age, sex, site, and image quality) demonstrating decreased volume in the B1 subgroup in lateral frontal, medial frontal, insula, and subcortical regions including the hippocampus. D, White matter (WM) comparison map (familywise error–corrected P < .05) corrected for the same confounds demonstrating widespread reductions in frontal and parietal lobes. E, Bar plot demonstrating the association between the brain and clinical subgroup memberships. The proportion of individuals from each clinical subgroup (y-axis) is indicated on the x-axis. The B1 subgroup contained proportionately more individuals from the clinical subgroup 1 (C1; positive symptoms, distress, and basic symptoms) and C2 (negative symptoms, functional impairment, and premorbid functioning) and less from the C4 (quality of life, role functioning, and social functioning) subgroups. F, Summary of the differences associated with the B1 (reduced volume brain) subgroup when compared with the B2 subgroup. L indicates left, PRS, polygenic risk scores; R, right; ROP, recent-onset psychosis. aP < .05. bP < .01.
Figure 3.
Figure 3.. Premorbid and Longitudinal Illness Course Analyses
A, Based on the Premorbid Adjustment Scale (PAS; values reversed for interpretation purposes), which retrospectively measures previous developmental periods from birth to age 18 years. Specific impairment was noted in the clinical subgroup 2 (C2) negative symptoms subgroup that became worse in later developmental periods and demonstrated a difference in linear trend (dotted lines; eTable 15 in Supplement 1). Similar findings were not evident in the brain subgroups. Additional analyses of educational attainment and lifetime functioning are depicted in eFigure 6 in Supplement 1. B, Longitudinal analysis (T0, baseline; T1, 9 months; T2, 18 months) of the Scale for the Assessment of Negative Symptoms (SANS) shown as an example of clinical and brain symptom differences. Main effect differences were found between the clinical subgroup C2 (negative symptoms) that maintained a higher level of symptoms at follow-up. Further analysis of positive and depression symptoms depicted in eFigure 6 and eTables 17-19 in Supplement 1. The brain subgroups (lower panel) demonstrated that brain subgroup 1 (B1; reduced brain volume) exhibited a higher main effect of negative symptoms that resolved during the follow-up period (eTable 19 in Supplement 1). C, Functioning, as assessed by the Global Assessment of Functioning-Disability scale (GAF-DI) demonstrated longitudinal improvement across clinical subgroups with a plateau between 9 and 18 months and the lowest functioning in the C2 subgroup (eTable 17 and 18 in Supplement 1). The B1 (reduced brain volume) subgroup demonstrated a similar pattern of functioning to the B2 (normal brain volume) subgroup. Additional measures of longitudinal functioning (GAF symptoms and self-reported quality of life) are depicted in eFigure 6 in Supplement 1 and tests are outlined in eTables 17-19 in Supplement 1. The dotted line represents trend difference in longitudinal course; the solid line represents main effect difference. Mean (SE) is displayed. aP < .001. bP < .01 for all pairs. cP < .001 for all pairs. dP < .01.
Figure 4.
Figure 4.. Schizophrenia Polygenic Risk Score (PRS) Differences Between the Identified Subgroups
A, Bar plots demonstrating the effect size (η2) associated with the comparisons of the subgroups across schizophrenia PRS thresholds used to calculate genetic risk. Significant associations (false discovery rate–corrected P < .05) were demonstrated for 7 of 10 thresholds for clinical data and 9 of 10 thresholds for brain data (only nonsignificant cutoffs indicated with NS). The highest effect sizes were at thresholds above PRS P = 5 × 10−8, highlighting the inclusion of multiple risk genes. B, Specific comparison at the PRS effect size optima for the clinical subgroups (ie, C1-C4) highlighted increased schizophrenia PRS across all subgroups. C, Comparisons of the schizophrenia PRS for brain subgroups at the PRS effect size optima indicated increases in the brain subgroup 1 (B1; reduced brain volume). aP < .05. bP < .01. cP < .001.

References

    1. McGorry PD, Killackey E, Yung A. Early intervention in psychosis: concepts, evidence and future directions. World Psychiatry. 2008;7(3):148-156. doi:10.1002/j.2051-5545.2008.tb00182.x - DOI - PMC - PubMed
    1. Addington J, Farris M, Devoe D, Metzak P. Progression from being at-risk to psychosis: next steps. NPJ Schizophr. 2020;6(1):27. doi:10.1038/s41537-020-00117-0 - DOI - PMC - PubMed
    1. Fusar-Poli P, Correll CU, Arango C, Berk M, Patel V, Ioannidis JPA. Preventive psychiatry: a blueprint for improving the mental health of young people. World Psychiatry. 2021;20(2):200-221. doi:10.1002/wps.20869 - DOI - PMC - PubMed
    1. Upthegrove R, Birchwood M, Ross K, Brunett K, McCollum R, Jones L. The evolution of depression and suicidality in first episode psychosis. Acta Psychiatr Scand. 2010;122(3):211-218. doi:10.1111/j.1600-0447.2009.01506.x - DOI - PubMed
    1. Chang WC, Strauss GP, Ahmed AO, et al. . The latent structure of negative symptoms in individuals with attenuated psychosis syndrome and early psychosis: support for the 5 consensus domains. Schizophr Bull. 2021;47(2):386-394. doi:10.1093/schbul/sbaa129 - DOI - PMC - PubMed

Publication types