. 2022 Sep 1;151(5):770-782.
doi: 10.1002/ijc.34122. Epub 2022 Jun 3.

An induced pluripotent stem cell t(7;12)(q36;p13) acute myeloid leukemia model shows high expression of MNX1 and a block in differentiation of the erythroid and megakaryocytic lineages

Affiliations

An induced pluripotent stem cell t(7;12)(q36;p13) acute myeloid leukemia model shows high expression of MNX1 and a block in differentiation of the erythroid and megakaryocytic lineages

Tina Nilsson et al. Int J Cancer. .

Abstract

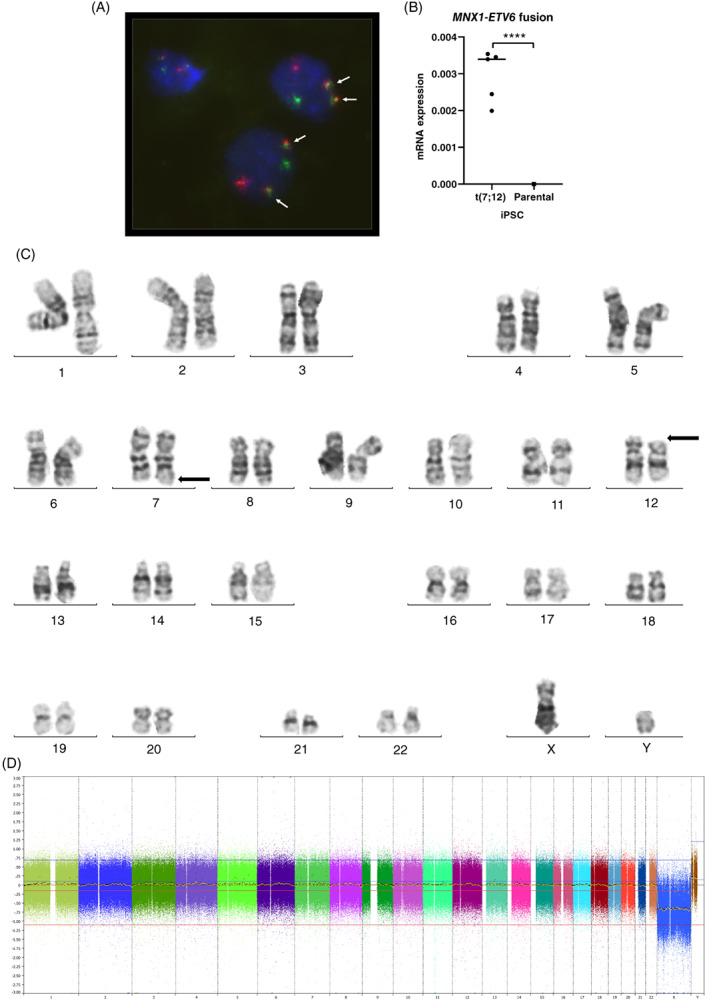
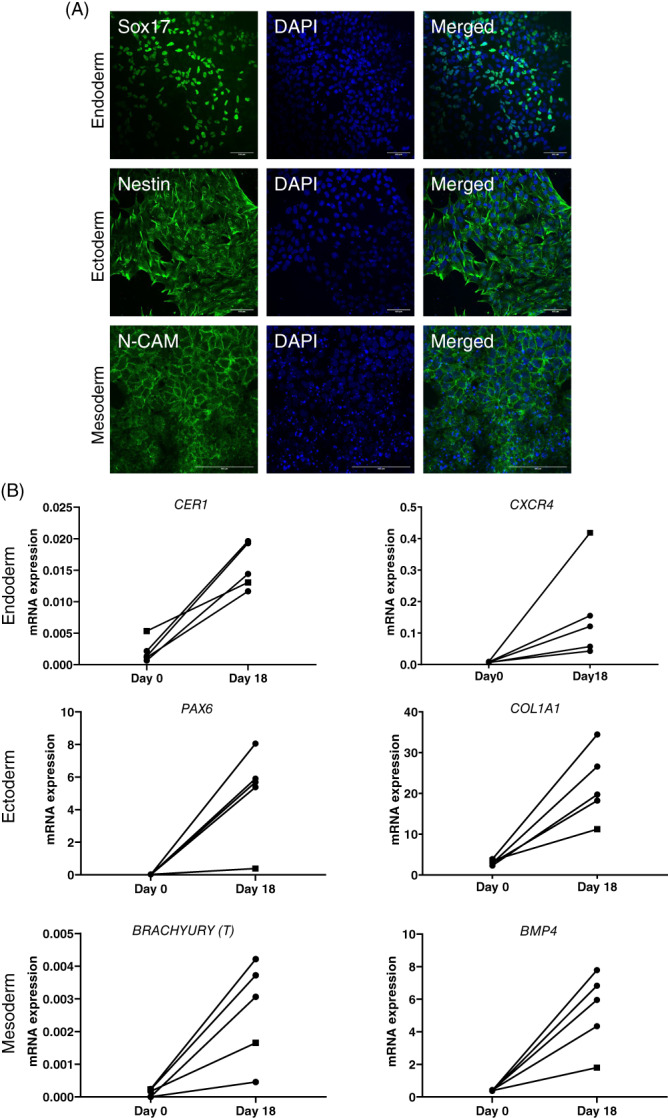
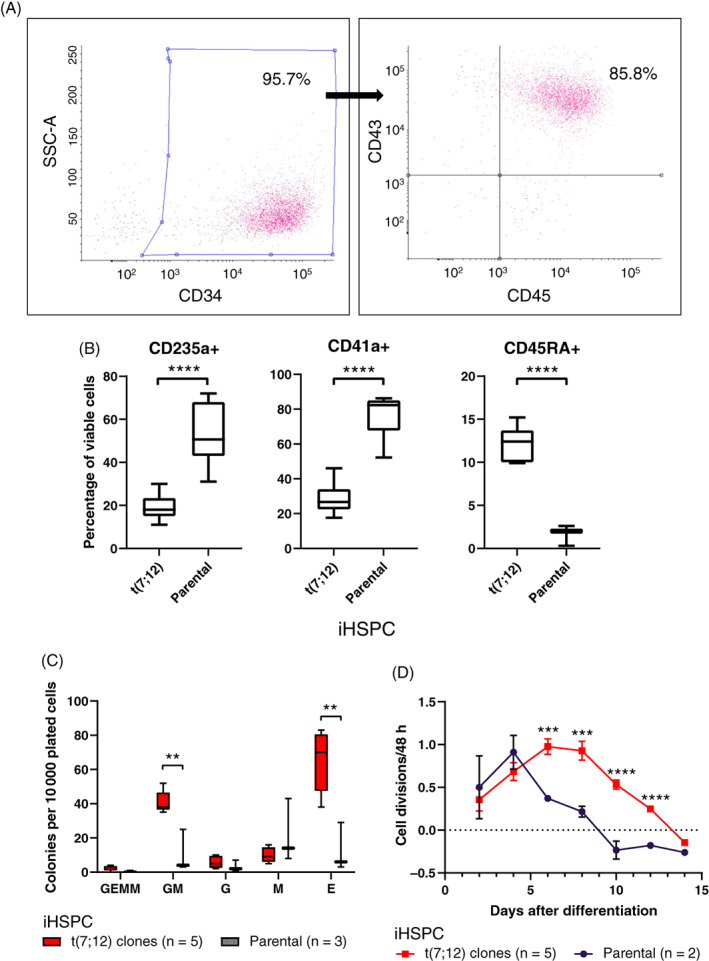
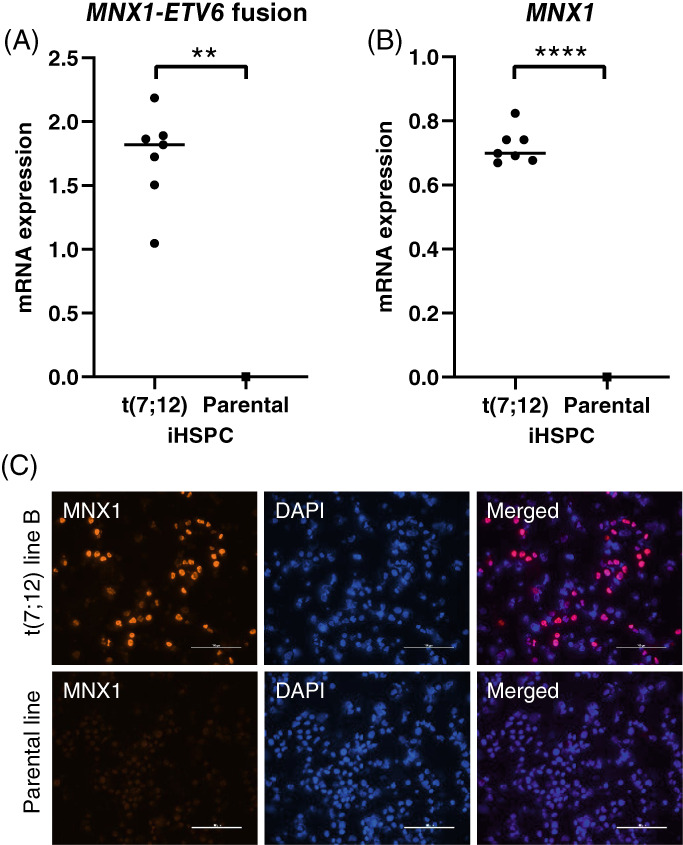
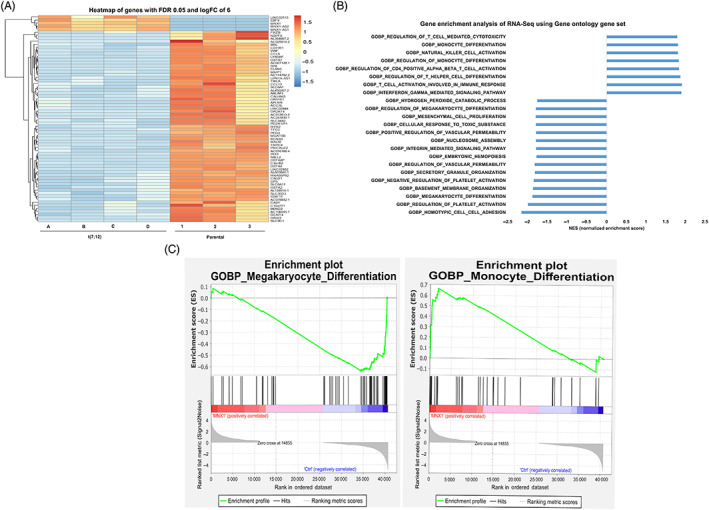
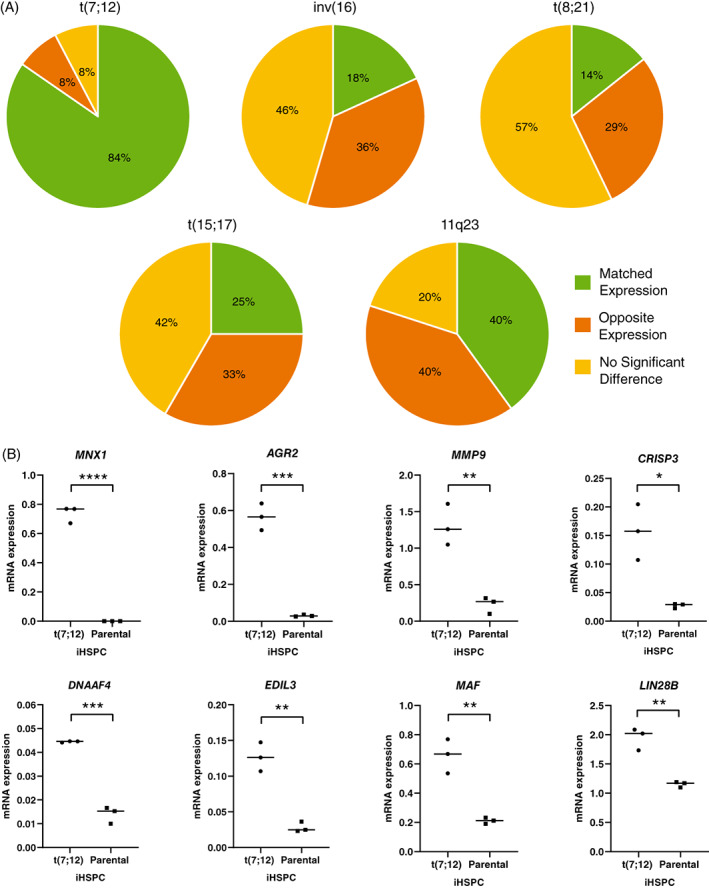
Acute myeloid leukemia (AML) results from aberrant hematopoietic processes and these changes are frequently initiated by chromosomal translocations. One particular subtype, AML with translocation t(7;12)(q36;p13), is found in children diagnosed before 2 years of age. The mechanisms for leukemogenesis induced by t(7;12) is not understood, in part because of the lack of efficient methods to reconstruct the leukemia-associated genetic aberration with correct genomic architecture and regulatory elements. We therefore created induced pluripotent stem cell (iPSC) lines that carry the translocation t(7;12) using CRISPR/Cas9. These t(7;12) iPSC showed propensity to differentiate into all three germ layers, confirming retained stem cell properties. The potential for differentiation into hematopoietic stem and progenitor cells (HSPC) was shown by expression of CD34, CD43 and CD45. Compared with the parental iPSC line, a significant decrease in cells expressing CD235a and CD41a was seen in the t(7;12) iPSC-derived HSPC (iHSPC), suggesting a block in differentiation. Moreover, colony formation assay showed an accumulation of cells at the erythroid and myeloid progenitor stages. Gene expression analysis revealed significant down-regulation of genes associated with megakaryocyte differentiation and up-regulation of genes associated with myeloid pathways but also genes typically seen in AML cases with t(7;12). Thus, this iPSC t(7;12) leukemia model of the t(7;12) AML subtype constitutes a valuable tool for further studies of the mechanisms for leukemia development and to find new treatment options.

Keywords: AML; chromosome translocation; leukemia; pluripotency; stem cells.


Conflict of interest statement

The authors declare no conflict of interest associated with this paper.

Figures

FIGURE 1
FIGURE 1
Human iPS cells with translocation t(7;12). (A) Human iPSC with t(7;12)(q36;p13) was created and the translocation was confirmed in all five clones with a FISH probe (Metasystems, Dual Fusion Break Apart probe) specific for t(7;12)(q36;p13) and indicated by arrows. Representative picture from clone A. (B) The presence of a functional fusion was confirmed by RT‐qPCR for the MNX1‐ETV6 transcript. Results are presented as 2−ΔCt vs endogenous reference gene GUSB (n = 5, all t(7;12) clones). (C) Conventional karyotype was performed on a subset of the clones as a complement to the FISH analysis. A representative metaphase from clone B is shown, with the translocation t(7;12) indicated (arrows). (D) SNP‐array was performed on all t(7;12) clones. No additional gains or losses of genetic material were detected. Representative SNP array from clone B is shown
FIGURE 2
FIGURE 2
The CRISPR/Cas9‐generated iPSCs with the t(7;12) translocation showed propensity to differentiate into all three germ layers. (A) STEMdiff Trilineage Differentiation kit was utilized for directed differentiation towards the three germ layers and resulting cells were analyzed by immunocytochemistry. Four t(7;12), clone A, B, C, E and the parental lines were analyzed, here exemplified by clone C (scale bar = 100 μm). (B) Spontaneous differentiation via embryoid bodies (EBs) were analyzed after 18 days for gene expression with RT‐qPCR. Results are presented as 2−ΔCt vs endogenous reference gene GUSB. Four t(7;12) lines (A, B, C and E, circles) and the parental line, ChiPSC22, (square) analyzed
FIGURE 3
FIGURE 3
Analysis of iHSPC. (A) Flow cytometry showed efficient differentiation to hematopoietic cells by high CD34, CD43 and CD45 expression. Analysis was done on viable single cells and gatings were set on isotype control plots. The gated areas were used for sorting of triple positive population. Numbers shown are percentage of viable single cells and in the second graph the triple positive proportion (example from clone E). (B) Immunophenotyping by flow cytometry revealed that t(7;12) iHSPC lines have a significant decrease in number of CD235a+ and CD41a+ cells as well as an increase in CD45RA+ compared with the parental iHSPC. All cell lines were analyzed after repeated differentiation rounds, one to five times per line, CD235a; n = 19 + 7, CD41a; n = 10 + 6, CD45RA; n = 7 + 3, where n denotes total number of analyses for t(7;12) and the parental lines, respectively. ****P < .0001; see also Figure S1. (C) CFU analysis showed significantly more GM and E colonies as well as an increased total number of colonies in the t(7;12) iHSPC lines compared with the parental iHSPC. All five clones, A‐E, were analyzed once each and the parental line three times (E; erythroid, M; macrophage, G; granulocyte, GM; granulocyte, macrophage, GEMM; granulocyte, erythrocyte, macrophage, megakaryocyte). **P < .01. (D) An increased proliferative capacity for t(7;12) iHSPC lines compared with the parental iHSPC was seen by continuous culture after the 12 day differentiation protocol was over. All five clones, A‐E, were analyzed once each and the parental line twice. ****P < .0001, ***P < .001
FIGURE 4
FIGURE 4
MNX1‐ETV6 and MNX1 expression in iHSPC. (A) The MNX1‐ETV6 fusion transcript was expressed only in the t(7;12) iHSPC analyzed by RT‐qPCR. Four clones analyzed, total n = 7 (A; n = 2, C; n = 2, D; n = 2, E; n = 1). Results are presented as 2−ΔCt vs endogenous reference gene GUSB. (B) A high expression of MNX1 was detected in t(7;12) iHSPC but was not detectable in the parental iHSPC with RT‐qPCR. Same clones analyzed as in 4A. (C) Immunocytochemistry on cytospins showed protein expression of MNX1 in the t(7;12) iHSPC but not in the parental iHSPC (scale bar = 100 μm). All clones analyzed, results shown for t(7;12) line B and parental line
FIGURE 5
FIGURE 5
Heatmap and pathway analysis of differentially expressed genes in t(7;12) iHSPC. (A) Expression heatmap of the top 50 genes differentially expressed. Log2‐transformed expression fold change of expression, t(7;12) vs parental ChiPSC22 differentiated into iHSPC. (B) Gene set enrichment analysis. Bar chart showing the degree of enrichment as indicated by a normalized enrichment score or NES for control iPSC cells vs t(7;12) iPSC cells using the gene ontology biological pathway data set. (C) GSEA enrichment plot showing that positive enrichment of the monocyte differentiation and the negative enrichment of the megakaryocyte differentiation. Nominal P value = 0, FDR < 0.05
FIGURE 6
FIGURE 6
Comparison of gene expression signatures. (A) Pie chart illustrating the overlap of differentially expressed genes from RNA sequencing of t(7;12) iHSPC compared with pediatric leukemia gene expression signatures from patients with different AML subtypes. (B) RT‐qPCR of representative genes to validate the RNA sequencing results. RNA prepared from FACS sorted triple positive populations of cells, three different t(7;12) lines; A,C,D and the parental line differentiated at three different occasions. Results are presented as 2−ΔCt vs endogenous reference gene GUSB. ****P < .0001, ***P < .001, **P < .01, *P < .05

Similar articles

Cited by

References

    1. Tosi S, Mostafa Kamel Y, Owoka T, Federico C, Truong TH, Saccone S. Pediatric acute myeloid leukemia with the t(7;12)(q36;p13) rearrangement: a review of the biological and clinical management aspects. Biomark Res. 2015;3:21. - PMC - PubMed
    1. Espersen ADL, Noren‐Nystrom U, Abrahamsson J, et al. Acute myeloid leukemia (AML) with t(7;12)(q36;p13) is associated with infancy and trisomy 19: data from Nordic Society for Pediatric Hematology and Oncology (NOPHO‐AML) and review of the literature. Genes Chromosomes Cancer. 2018;57:359‐365. - PubMed
    1. Tosi S, Hughes J, Scherer SW, et al. Heterogeneity of the 7q36 breakpoints in the t(7;12) involving ETV6 in infant leukemia. Genes Chromosomes Cancer. 2003;38:191‐200. - PubMed
    1. Ballabio E, Cantarella CD, Federico C, et al. Ectopic expression of the HLXB9 gene is associated with an altered nuclear position in t(7;12) leukemias. Leukemia. 2009;23:1179‐1182. - PubMed
    1. Hock H, Shimamura A. ETV6 in hematopoiesis and leukemia predisposition. Semin Hematol. 2017;54:98‐104. - PMC - PubMed

Publication types

MeSH terms