

doi: 10.1158/0008-5472.CAN-21-2352.
Pyruvate Kinase M1 Suppresses Development and Progression of Prostate Adenocarcinoma
Affiliations
- PMID: 35584006
- PMCID: PMC9256808
- DOI: 10.1158/0008-5472.CAN-21-2352
Item in Clipboard
Pyruvate Kinase M1 Suppresses Development and Progression of Prostate Adenocarcinoma
Cancer Res.
.
Abstract
Differential expression of PKM1 and PKM2 impacts prostate tumorigenesis and suggests a potential therapeutic vulnerability in prostate cancer.
©2022 The Authors; Published by the American Association for Cancer Research.
Figures
![Figure 1. Increased glucose uptake and a change in PKM isoform expression accompanies Pten loss in mouse prostate tissue. A, Relative [18F]fluoro-2-deoxyglucose (FDG) uptake into the anterior prostate and gastrocnemius muscle of 7- to 11-week-old wild-type (WT) mice and mice with prostate-specific Pten deletion (Ptenpc–/–). Mean ± SD is shown (n = 6). The difference in FDG uptake between genotypes is significant in prostate (*, P < 0.05 by Student t test), but not in muscle. B, Representative H&E and IHC assessment of PKM1 and PKM2 expression in anterior prostate tissue harvested from WT mice of the indicated age. Adjacent seminal vesicle tissue is marked with *. Scale bar = 200 μm. C, Representative H&E and IHC assessment of PKM1 and PKM2 expression in prostate tissue harvested from Ptenpc–/– mice of the indicated age. Scale bar = 200 μm. D, Quantitation of PKM1 and PKM2 expression in prostate tissue harvested from Ptenpc–/– mice of the indicated age as determined by IHC. Tissue from 3 to 6 mice per age group was quantified. E, Representative IHC staining of PKM1 or PKM2 (brown), and PCNA (pink), in tumors from Ptenpc–/– mice of the indicated age. Scale bar = 200 μm.](https://cdn.ncbi.nlm.nih.gov/pmc/blobs/b874/9381135/9a643d55b4d9/2403fig1.jpg)
Increased glucose uptake and a change in PKM isoform expression accompanies Pten loss in mouse prostate tissue. A, Relative FDG uptake into the anterior prostate and gastrocnemius muscle of 7- to 11-week-old WT mice and mice with prostate-specific Pten deletion (Ptenpc–/–). Mean ± SD is shown (n = 6). The difference in FDG uptake between genotypes is significant in prostate (*, P < 0.05 by Student t test), but not in muscle. B, Representative hematoxylin and eosin and IHC assessment of PKM1 and PKM2 expression in anterior prostate tissue harvested from WT mice of the indicated age. *, adjacent seminal vesicle tissue. Scale bar, 200 μm. C, Representative hematoxylin and eosin and IHC assessment of PKM1 and PKM2 expression in prostate tissue harvested from Ptenpc–/– mice of the indicated age. Scale bar, 200 μm. D, Quantitation of PKM1 and PKM2 expression in prostate tissue harvested from Ptenpc–/– mice of the indicated age as determined by IHC. Tissue from 3 to 6 mice per age group was quantified. E, Representative IHC staining of PKM1 or PKM2 (brown) and PCNA (pink) in tumors from Ptenpc–/– mice of the indicated age. Scale bar, 200 μm.
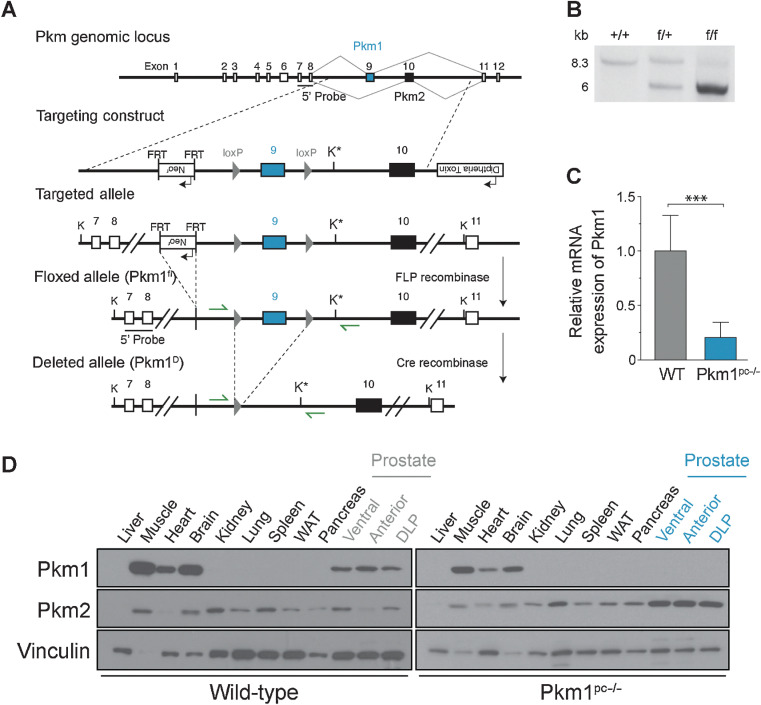
Generation and validation of Pkm1 conditional mice. A, A schematic showing the mouse Pkm locus, construct targeting Pkm1-specific exon 9, and the resulting targeted, floxed, and deleted Pkm1 alleles. The KpnI restriction enzyme sites used for Southern blot analysis are marked with “K,” and the new KpnI site introduced by the targeting vector is marked with “K*.” The location of the 5′ probe used for Southern blot analysis is also indicated, as are the locations of the genotyping primers (green arrows). B, Southern blot analysis of KpnI-digested genomic DNA from Pkm1+/+ (+/+), Pkm1+/fl (f/+), and Pkm1fl/fl (f/f) mice using the 5′ probe shown in A. Digestion of genomic DNA harboring the wild-type allele (+) yields an 8.3 kb fragment, whereas DNA harboring the floxed allele (f) yields a ∼5.0 kb fragment. C,Pkm1 mRNA levels in anterior prostate tissue from wild-type (WT) and Pkm1fl/fl PbCre4 (Pkm1pc–/–) mice as determined by qRT-PCR. Mean ± SD is shown (n = 5). The difference in expression between genotypes is significant (***, P < 0.001 by Student t test). D, Western blot analysis of PKM1 and PKM2 expression in the indicated tissues from WT and Pkm1pc–/– mice. DLP, dorsolateral prostate; WAT, white adipose tissue.
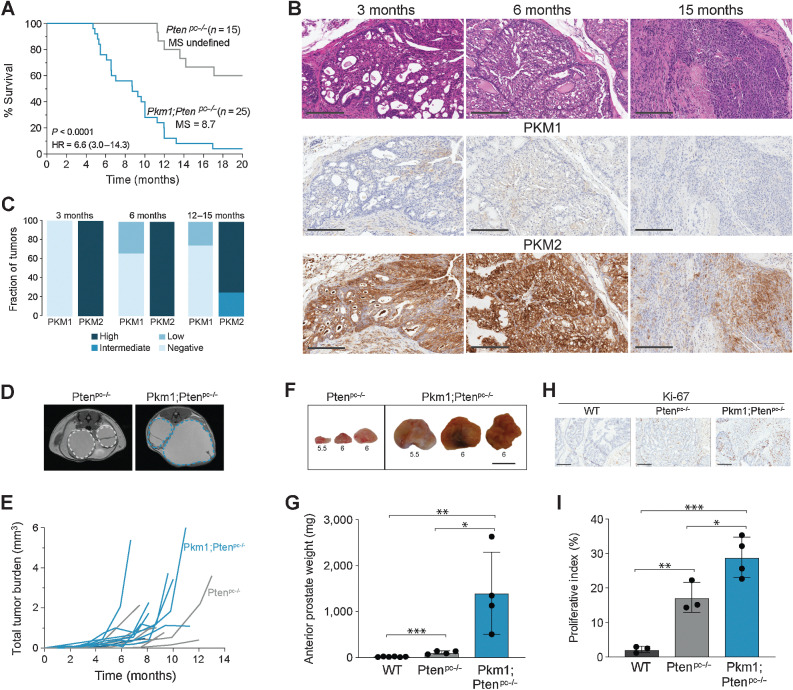
Pkm1 deletion promotes progression of Pten-null prostate cancer. A, Kaplan–Meier curve assessing survival of a cohort of Ptenpc–/– and Pkm1;Ptenpc–/– mice as indicated. P value shown is for comparison of survival curves by log-rank test. Median survival (MS) and HR for death with 95% CI were determined by Mantel–Haenszel test with Ptenpc–/– as comparator group. B, Representative hematoxylin and eosin and IHC assessment of PKM1 and PKM2 expression in prostate tissue harvested from Pkm1;Ptenpc–/– mice of the indicated age. Scale bar, 200 μm. C, Quantitation of PKM1 and PKM2 expression in prostate tissue harvested from Pkm1;Ptenpc–/– mice of the indicated age as determined by IHC. Tissue from 3 to 4 mice per age group was quantified. D, Representative MRI image of 6-month-old Ptenpc–/– and Pkm1;Ptenpc–/– mice. The left and right anterior prostates are outlined in each image. E, Prostate tumor volume estimated from serial MRI scans over time for a cohort of Ptenpc–/– and Pkm1;Ptenpc–/– mice as shown. Each line represents data from a single mouse, with the age of each mouse corresponding to time on the x-axis. F, Representative macroscopic images of anterior prostate tissue dissected from Ptenpc–/– or Pkm1;Ptenpc–/– mice as indicated. The age of the mouse in months at the time tissue was harvested is shown below each specimen. Scale bar, 1 cm. G, Weight of anterior prostate tissue dissected from 6-month-old WT, Ptenpc–/– and Pkm1;Ptenpc–/– mice. Mean ± SD is shown (WT, n = 6; Ptenpc–/–, n = 4; and Pkm1;Ptenpc–/–, n = 4). Differences in tissue weight are significant. H, Representative Ki-67 IHC of anterior prostate tissue harvested from 6-month-old WT, Ptenpc–/– and Pkm1;Ptenpc–/– mice. Scale bar, 200 μm. I, Proliferative index of anterior prostate tissue from 6-month-old WT, Ptenpc–/–, and Pkm1;Ptenpc–/– mice as determined by Ki-67 IHC. Mean ±SD is shown (WT, n = 4; Ptenpc–/–, n = 3; and Pkm1;Ptenpc–/–, n = 4). Differences in proliferative index are significant. *, P < 0.05, **, P < 0.01; ***, P < 0.001 by Student t test.
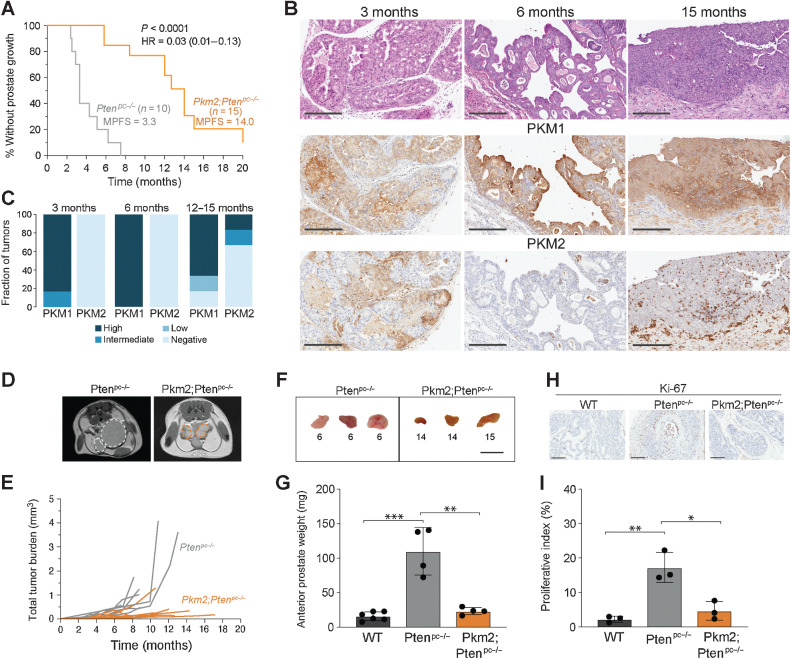
Pkm2 deletion slows progression of Pten-null prostate cancer. A, Kaplan–Meier curve assessing the onset of abnormal prostate growth as determined by serial MRI in Ptenpc–/– and Pkm2;Ptenpc–/– mice. The difference in time to abnormal prostate growth is significant. Median progression-free survival (MPFS) and HR for radiographic progression with 95% CI were determined by Mantel–Haenszel test with Ptenpc–/– as comparator group. B, Representative hematoxylin and eosin and IHC assessment of PKM1 and PKM2 expression in prostate tissue harvested from Pkm2;Ptenpc–/– mice of the indicated age. Scale bar, 200 μm. C, Quantitation of PKM1 and PKM2 expression in prostate tissue harvested from Pkm2;Ptenpc–/– mice of the indicated age as determined by IHC. Tissue from 3 to 6 mice per age group was quantified. D, Representative MRI image of 6-month-old Ptenpc–/– and Pkm2;Ptenpc–/– mice. The left and right anterior prostates are outlined in each image. E, Prostate tumor volume estimated from serial MRI scans over time for a cohort of Ptenpc–/– and Pkm2;Ptenpc–/– mice as shown. Each line represents data from a single mouse, with the age of each mouse corresponding to time on the x-axis. F, Representative macroscopic images of anterior prostate tissue dissected from Ptenpc–/– or Pkm2;Ptenpc–/– mice as indicated. The age of the mouse in months at the time tissue was harvested is shown below each specimen. Scale bar, 1 cm. G, Weight of anterior prostate tissue dissected from 6-month-old WT and Ptenpc–/– mice, and 14- to 15-month-old Pkm2;Ptenpc–/– mice. Mean ± SD is shown (WT, n = 6; Ptenpc–/–, n = 4; and Pkm2;Ptenpc–/–, n = 4). The indicated differences in tissue weight are significant. H, Representative Ki-67 IHC of anterior prostate tissue harvested from 6-month-old WT, Ptenpc–/– and Pkm2;Ptenpc–/– mice. Scale bar, 200 μm. I, Proliferative index of anterior prostate tissue harvested from 6-month-old WT, Ptenpc–/–, and Pkm2;Ptenpc–/– mice as determined by Ki-67 IHC. Mean ± the SD is shown (WT, n = 4; Ptenpc–/–, n = 3; and Pkm2;Ptenpc–/–, n = 3). The indicated differences in proliferative index are significant. *, P < 0.05; **, P < 0.01; ***, P < 0.001 by Student t test.
![Figure 5. Pkm2 deletion suppresses increased glucose uptake, affects metabolite levels, and prolongs DNA replication stress and cellular senescence in Pten-null prostate tissue. A, Maximum relative [18F]fluoro-2-deoxyglucose signal (SUV Max) in prostate tissue as assessed by PET of 6-month-old wild-type (WT), Ptenpc–/–, Pkm1;Ptenpc–/–, and Pkm2;Ptenpc–/– mice. Prostate signal normalized to the intensity of the emission spectra in the heart of the same mouse is shown (WT, n = 3; Ptenpc–/–, n = 3; Pkm1;Ptenpc–/–, n = 3; Pkm2;Ptenpc–/–, n = 4). The indicated differences in FDG uptake are significant (*, P < 0.05 by Student t test). B, Principle component analysis of 111 polar metabolites measured by LC/MS in prostate tissue harvested from 6-month-old WT, Ptenpc–/–, Pkm1;Ptenpc–/–, and Pkm2;Ptenpc–/– mice (WT, n = 8; Ptenpc–/–, n = 10; Pkm1;Ptenpc–/–, n = 6; Pkm2;Ptenpc–/–, n = 6). C, Relative levels of all metabolites measured by LC/MS that were significantly different (P < 0.05 by Student t test) in a comparison of prostate tissue harvested from 6-month-old Pten–/– or Pkm2;Pten–/– mice (Ptenpc–/–, n = 10; Pkm2;Ptenpc–/–, n = 6). D, Representative IHC staining for phospho-Chk1 in prostate tissue harvested from Ptenpc–/–, Pkm1;Ptenpc–/–, and Pkm2;Ptenpc–/– mice of the indicated age. Scale bar = 200 μm. E, Quantitation of phospho-Chk1 staining in prostate tissue harvested from Ptenpc–/–, Pkm1;Ptenpc–/–, and Pkm2;Ptenpc–/– mice of the indicated age as determined by IHC. Tissue from 3 to 6 mice per age group was quantified. F, Representative SA-β-gal staining of anterior prostate tissue harvested from 6-month-old WT, Ptenpc–/–, Pkm1;Ptenpc–/–, and Pkm2;Ptenpc–/– mice. The area indicated by the dashed box is shown larger in the lower left inset for the right two panels. Scale bar = 500 μm.](https://cdn.ncbi.nlm.nih.gov/pmc/blobs/b874/9381135/f963e4fa8b30/2403fig5.jpg)
Pkm2 deletion suppresses increased glucose uptake, affects metabolite levels, and prolongs DNA replication stress and cellular senescence in Pten-null prostate tissue. A, Maximum relative [18F]fluoro-2-deoxyglucose signal (SUV Max) in prostate tissue as assessed by PET of 6-month-old WT, Ptenpc–/–, Pkm1;Ptenpc–/–, and Pkm2;Ptenpc–/– mice. Prostate signal normalized to the intensity of the emission spectra in the heart of the same mouse is shown (WT, n = 3; Ptenpc–/–, n = 3; Pkm1;Ptenpc–/–, n = 3; Pkm2;Ptenpc–/–, n = 4). The indicated differences in FDG uptake are significant. *, P < 0.05 by Student t test. B, Principle component analysis of 111 polar metabolites measured by LC/MS in prostate tissue harvested from 6-month-old WT, Ptenpc–/–, Pkm1;Ptenpc–/–, and Pkm2;Ptenpc–/– mice (WT, n = 8; Ptenpc–/–, n = 10; Pkm1;Ptenpc–/–, n = 6; Pkm2;Ptenpc–/–, n = 6). C, Relative levels of all metabolites measured by LC/MS that were significantly different (P < 0.05 by Student t test) in a comparison of prostate tissue harvested from 6-month-old Pten–/– or Pkm2;Pten–/– mice (Ptenpc–/–, n = 10; Pkm2;Ptenpc–/–, n = 6). D, Representative IHC staining for phospho-CHK1 in prostate tissue harvested from Ptenpc–/–, Pkm1;Ptenpc–/–, and Pkm2;Ptenpc–/– mice of the indicated age. Scale bar, 200 μm. E, Quantitation of phospho-CHK1 staining in prostate tissue harvested from Ptenpc–/–, Pkm1;Ptenpc–/–, and Pkm2;Ptenpc–/– mice of the indicated age as determined by IHC. Tissue from 3 to 6 mice per age group was quantified. F, Representative SA-β-gal staining of anterior prostate tissue harvested from 6-month-old WT, Ptenpc–/–, Pkm1;Ptenpc–/–, and Pkm2;Ptenpc–/– mice. The area indicated by the dashed box is shown larger in the lower left inset for the right two panels. Scale bar, 500 μm.
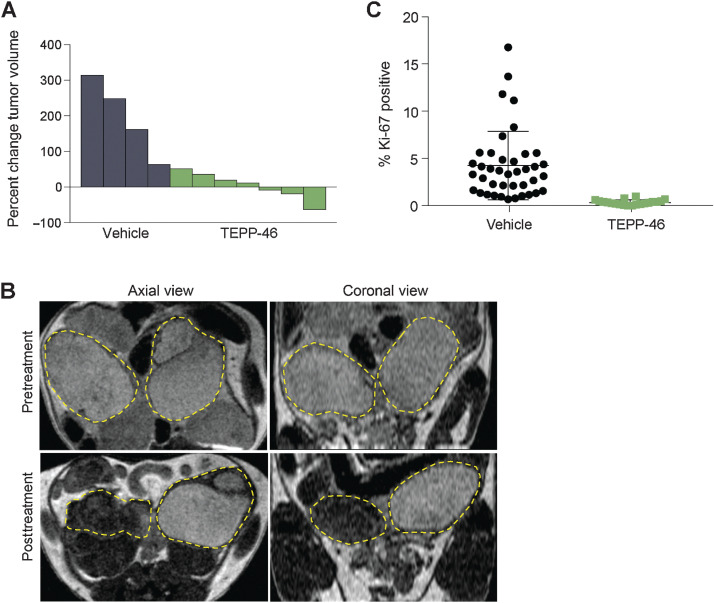
PKM2 activator treatment reduces Ptenpc–/– mouse prostate tumor growth. A, Waterfall plot showing the maximal change in total mouse prostate tumor volume as assessed by MRI in tumor-bearing Ptenpc–/– mice after 1 month of twice a day treatment with vehicle or 50 mg/kg of TEPP-46 as indicated (vehicle, n = 4; TEPP-46, n = 7). B, Representative MRI images from a tumor-bearing Ptenpc–/– mouse dosed with TEPP-46 twice a day for 1 month. Axial and coronal view images from the same approximate anatomical plane are shown pre- and post-treatment as indicated. The left and right anterior prostates are outlined in each image. C, Proliferative index as determined by Ki-67 IHC of prostate tumors from Ptenpc–/– mice treated with vehicle or TEPP-46 as indicated.
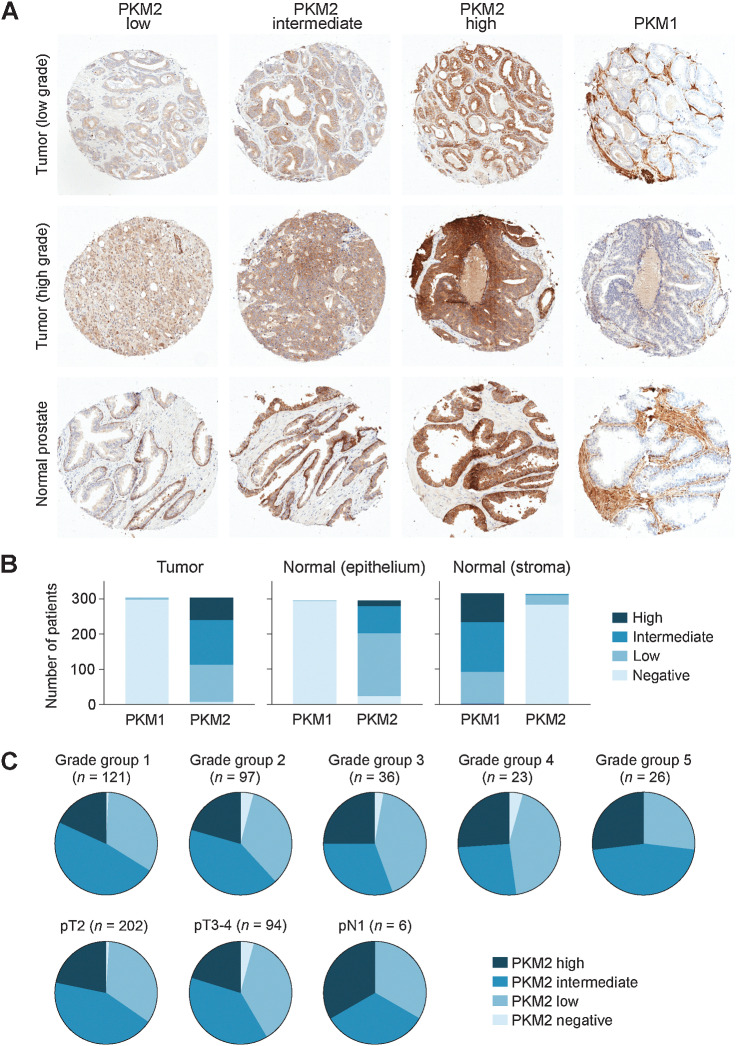
PKM1 and PKM2 expression in normal and cancerous human prostate tissue. A, Representative IHC staining of PKM2 and PKM1 expression in low- and high-grade human prostate tumors and normal human prostate tissue is shown. Staining scored as low, intermediate, and high expression for PKM2 is indicated. The diameter of each tissue core is approximately 0.6 mm. B, Quantification of PKM1 and PKM2 expression by IHC in human prostate tissue (tumor and normal) present on a tissue array containing 304 samples. Expression level is based on the scoring rubric shown in A. C, Quantification of PKM2 expression by IHC in a human prostate cancer tissue array stratified by Gleason grade and TNM stage at the time of radical prostatectomy. The number of cases analyzed for each subset is indicated.
References
Publication types
MeSH terms
Substances
Grants and funding
LinkOut - more resources
Full Text Sources
Medical
Molecular Biology Databases
Research Materials
Miscellaneous
