

COVID-19 heterogeneity in islands chain environment
- PMID: 35584085
- PMCID: PMC9116625
- DOI: 10.1371/journal.pone.0263866
COVID-19 heterogeneity in islands chain environment
Abstract
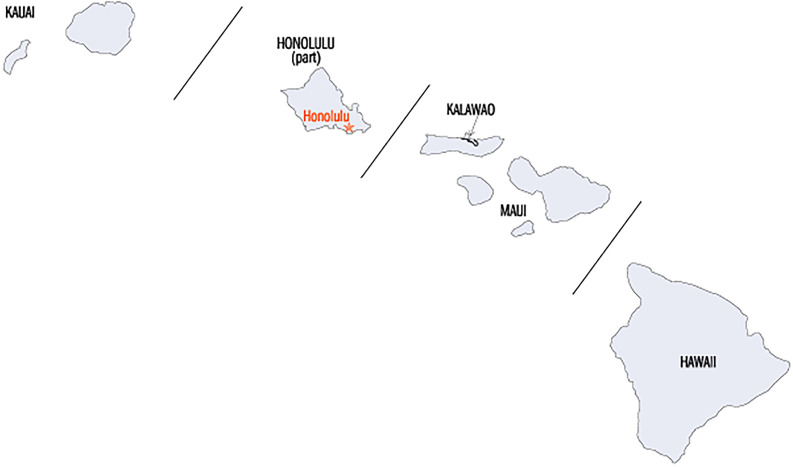
Background: It is critical to capture data and modeling from the COVID-19 pandemic to understand as much as possible and prepare for future epidemics and possible pandemics. The Hawaiian Islands provide a unique opportunity to study heterogeneity and demographics in a controlled environment due to the geographically closed borders and mostly uniform pandemic-induced governmental controls and restrictions.
Objective: The goal of the paper is to quantify the differences and similarities in the spread of COVID-19 among different Hawaiian islands as well as several other archipelago and islands, which could potentially help us better understand the effect of differences in social behavior and various mitigation measures. The approach should be robust with respect to the unavoidable differences in time, as the arrival of the virus and promptness of mitigation measures may vary significantly among the chosen locations. At the same time, the comparison should be able to capture differences in the overall pandemic experience.
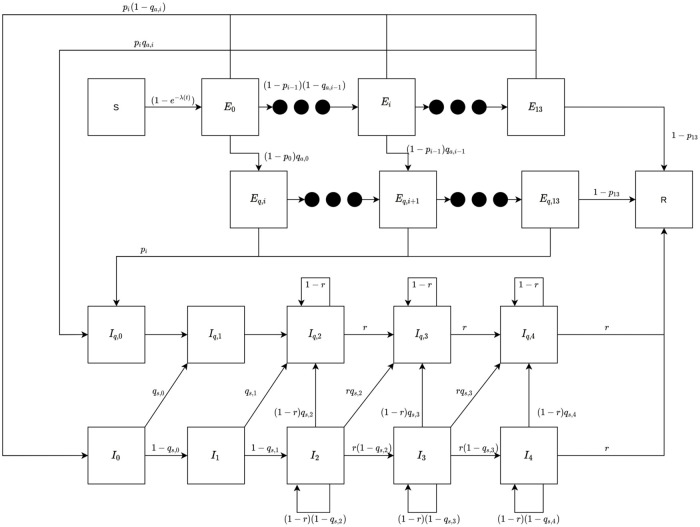
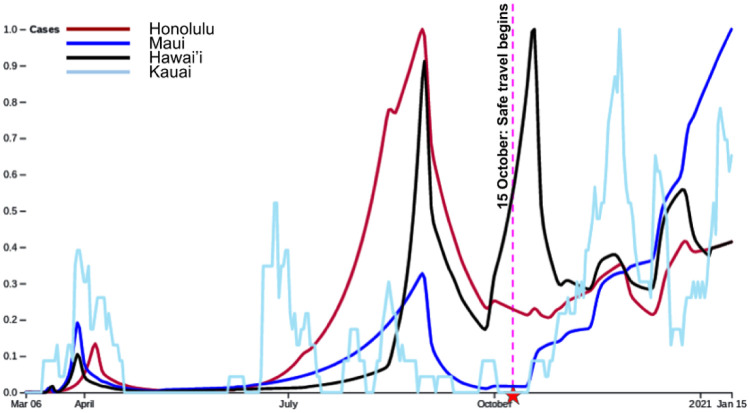
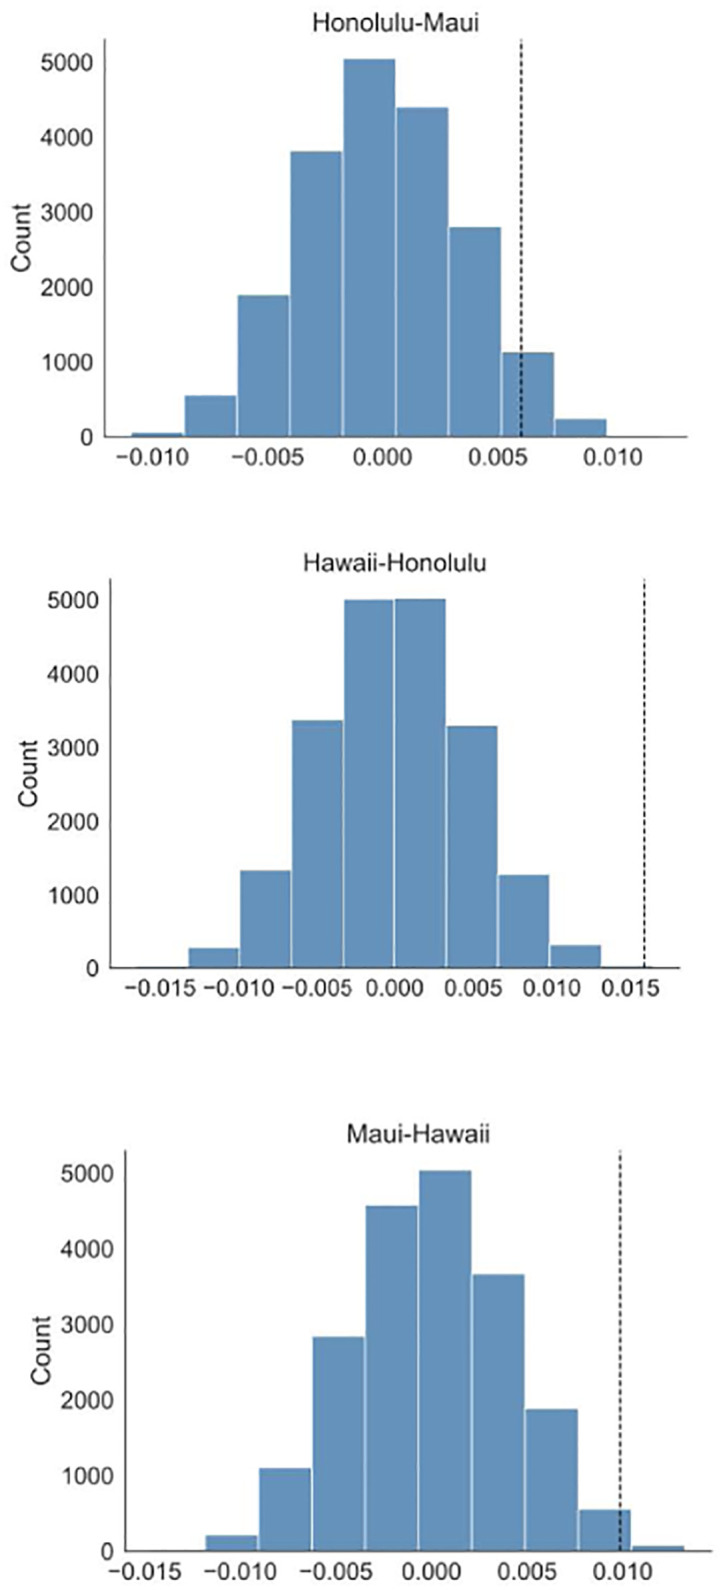
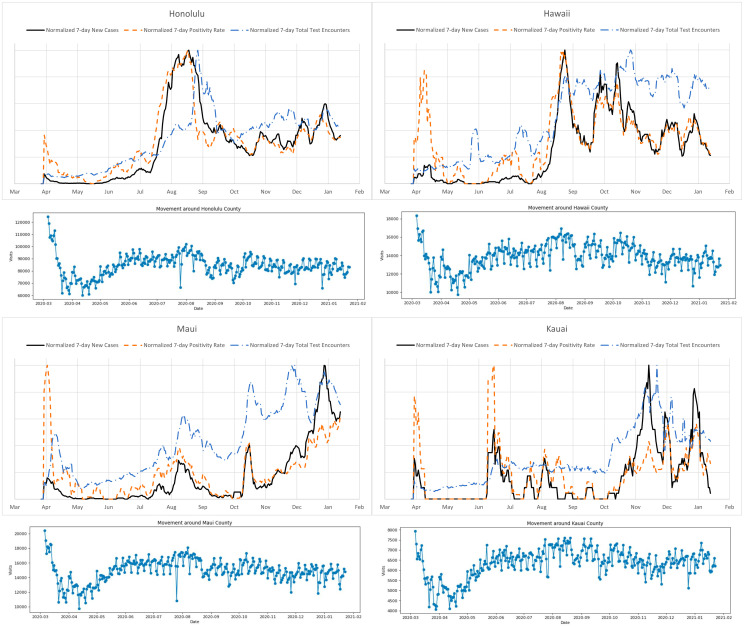
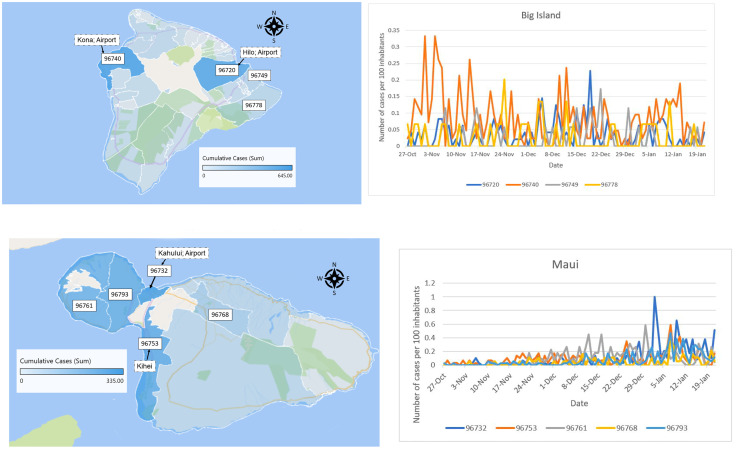
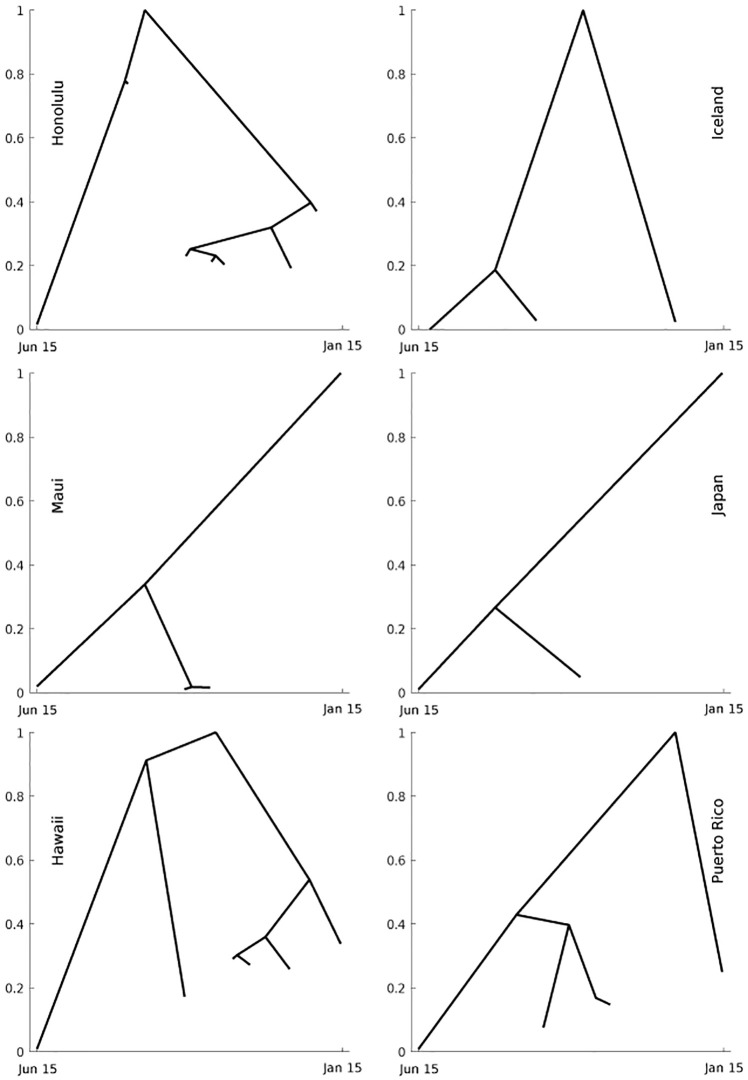
Methods: We examine available data on the daily cases, positivity rates, mobility, and employ a compartmentalized model fitted to the daily cases to develop appropriate comparison approaches. In particular, we focus on merge trees for the daily cases, normalized positivity rates, and baseline transmission rates of the models.
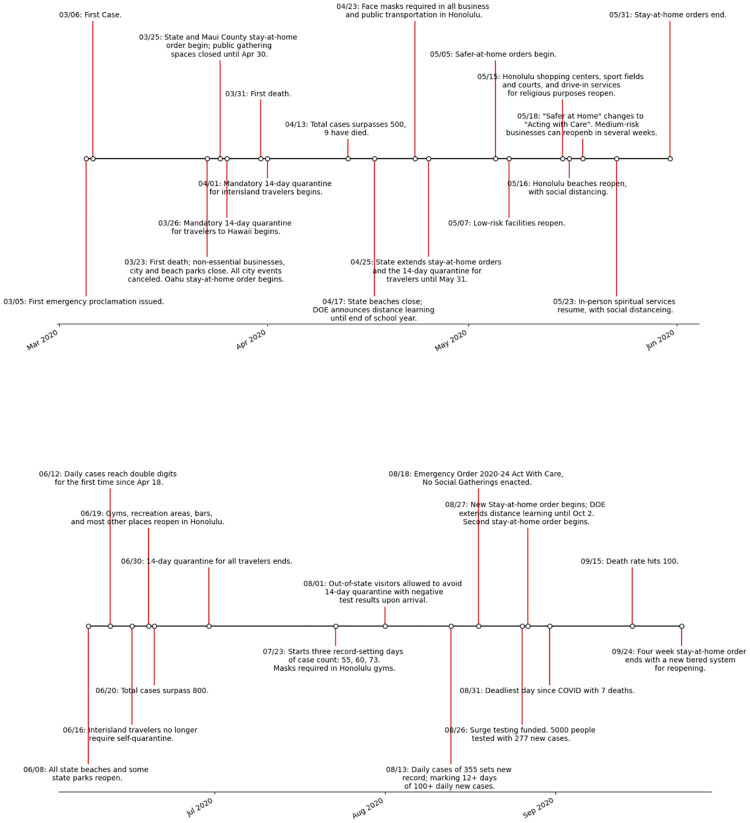
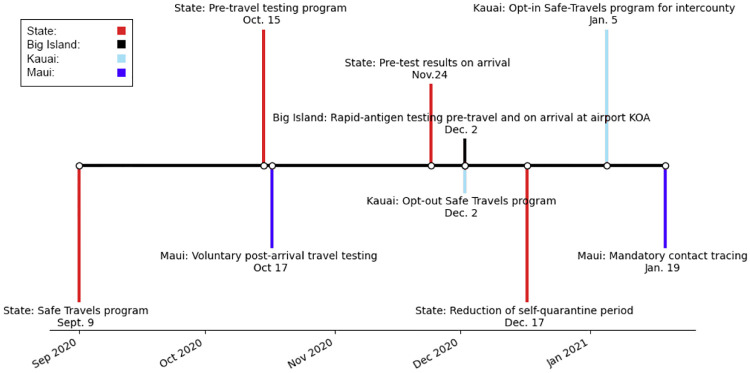
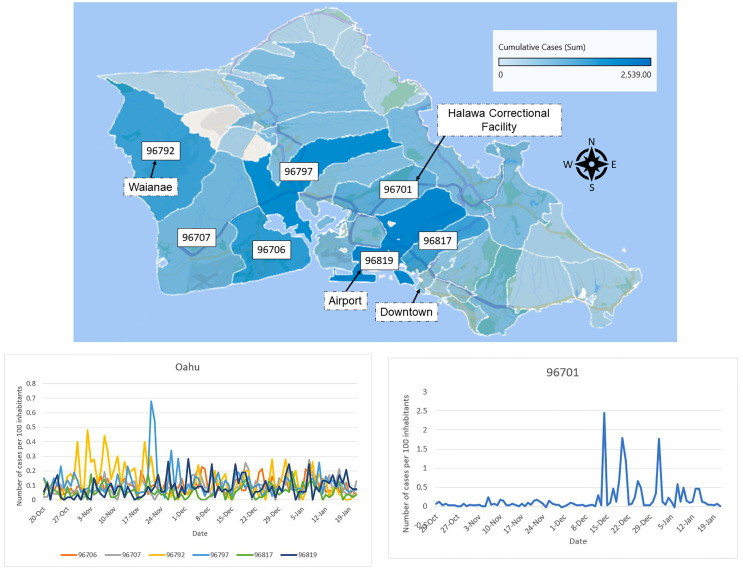
Results: We observe noticeable differences among different Hawaiian counties and interesting similarities between some Hawaiian counties and other geographic locations. The results suggest that mitigation measures should be more localized, that is, targeting the county level rather than the state level if the counties are reasonably insulated from one another. We also notice that the spread of the disease is very sensitive to unexpected events and certain changes in mitigation measures.
Conclusions: Despite being a part of the same archipelago and having similar protocols for mitigation measures, different Hawaiian counties exhibit quantifiably different dynamics of the spread of the disease. One potential explanation is that not sufficiently targeted mitigation measures are incapable of handling unexpected, localized outbreak events. At a larger-scale view of the general spread of the disease on the Hawaiian island counties, we find very interesting similarities between individual Hawaiian islands and other archipelago and islands.
Conflict of interest statement
The authors have declared that no competing interests exist.
Figures

Similar articles
-
International, national and local trends in the spread of COVID-19: a geographic view of COVID-19 spread and the role to be played by coproduction.Int J Qual Health Care. 2021 Nov 29;33(Supplement_2):ii71-ii77. doi: 10.1093/intqhc/mzab074. Int J Qual Health Care. 2021. PMID: 34849958 Free PMC article.
-
Iterative data-driven forecasting of the transmission and management of SARS-CoV-2/COVID-19 using social interventions at the county-level.Sci Rep. 2022 Jan 18;12(1):890. doi: 10.1038/s41598-022-04899-4. Sci Rep. 2022. PMID: 35042958 Free PMC article.
-
Interstates of Infection: Preliminary Investigations of Human Mobility Patterns in the COVID-19 Pandemic.J Rural Health. 2021 Mar;37(2):266-271. doi: 10.1111/jrh.12558. Epub 2021 Mar 15. J Rural Health. 2021. PMID: 33720459 Free PMC article.
-
Surveillance Metrics of SARS-CoV-2 Transmission in Central Asia: Longitudinal Trend Analysis.J Med Internet Res. 2021 Feb 3;23(2):e25799. doi: 10.2196/25799. J Med Internet Res. 2021. PMID: 33475513 Free PMC article.
-
Pandemic lockdown, healthcare policies and human rights: integrating opposed views on COVID-19 public health mitigation measures.Rev Cardiovasc Med. 2020 Dec 30;21(4):509-516. doi: 10.31083/j.rcm.2020.04.274. Rev Cardiovasc Med. 2020. PMID: 33387996 Review.
References
-
- SafeGraph COVID-19 Data Consortium. SafeGraph COVID-19 Data Consortium. SafeGraph (2021). https://www.safegraph.com/covid-19-data-consortium.
-
- Covid-19, State of Hawai‘i Portal. Travel Data. https://hawaiicovid19.com/travel/data/.
Publication types
MeSH terms
LinkOut - more resources
Full Text Sources
Medical
