. 2022 May 18;14(645):eabn0402.
doi: 10.1126/scitranslmed.abn0402. Epub 2022 May 18.

Ex silico engineering of cystine-dense peptides yielding a potent bispecific T cell engager

Affiliations

Ex silico engineering of cystine-dense peptides yielding a potent bispecific T cell engager

Zachary R Crook et al. Sci Transl Med. .

Abstract

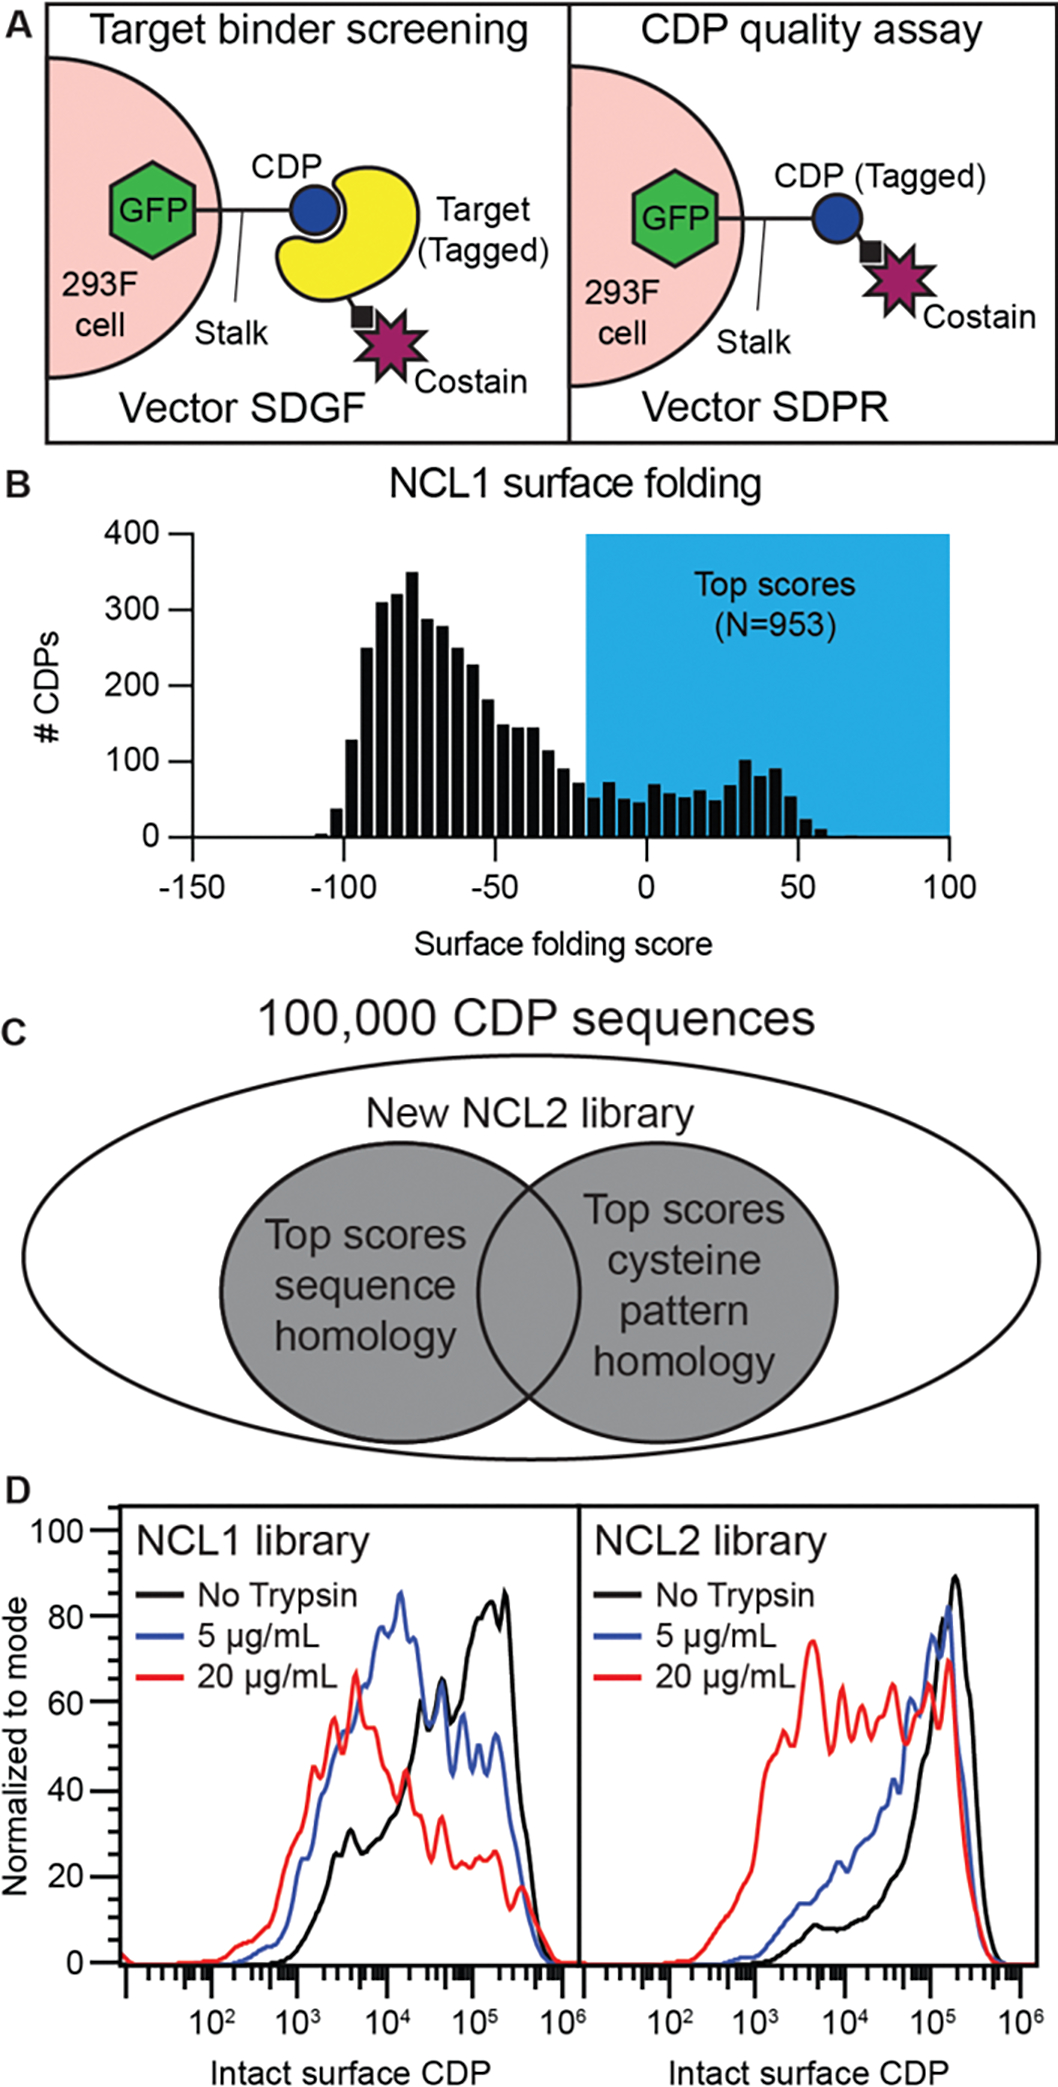
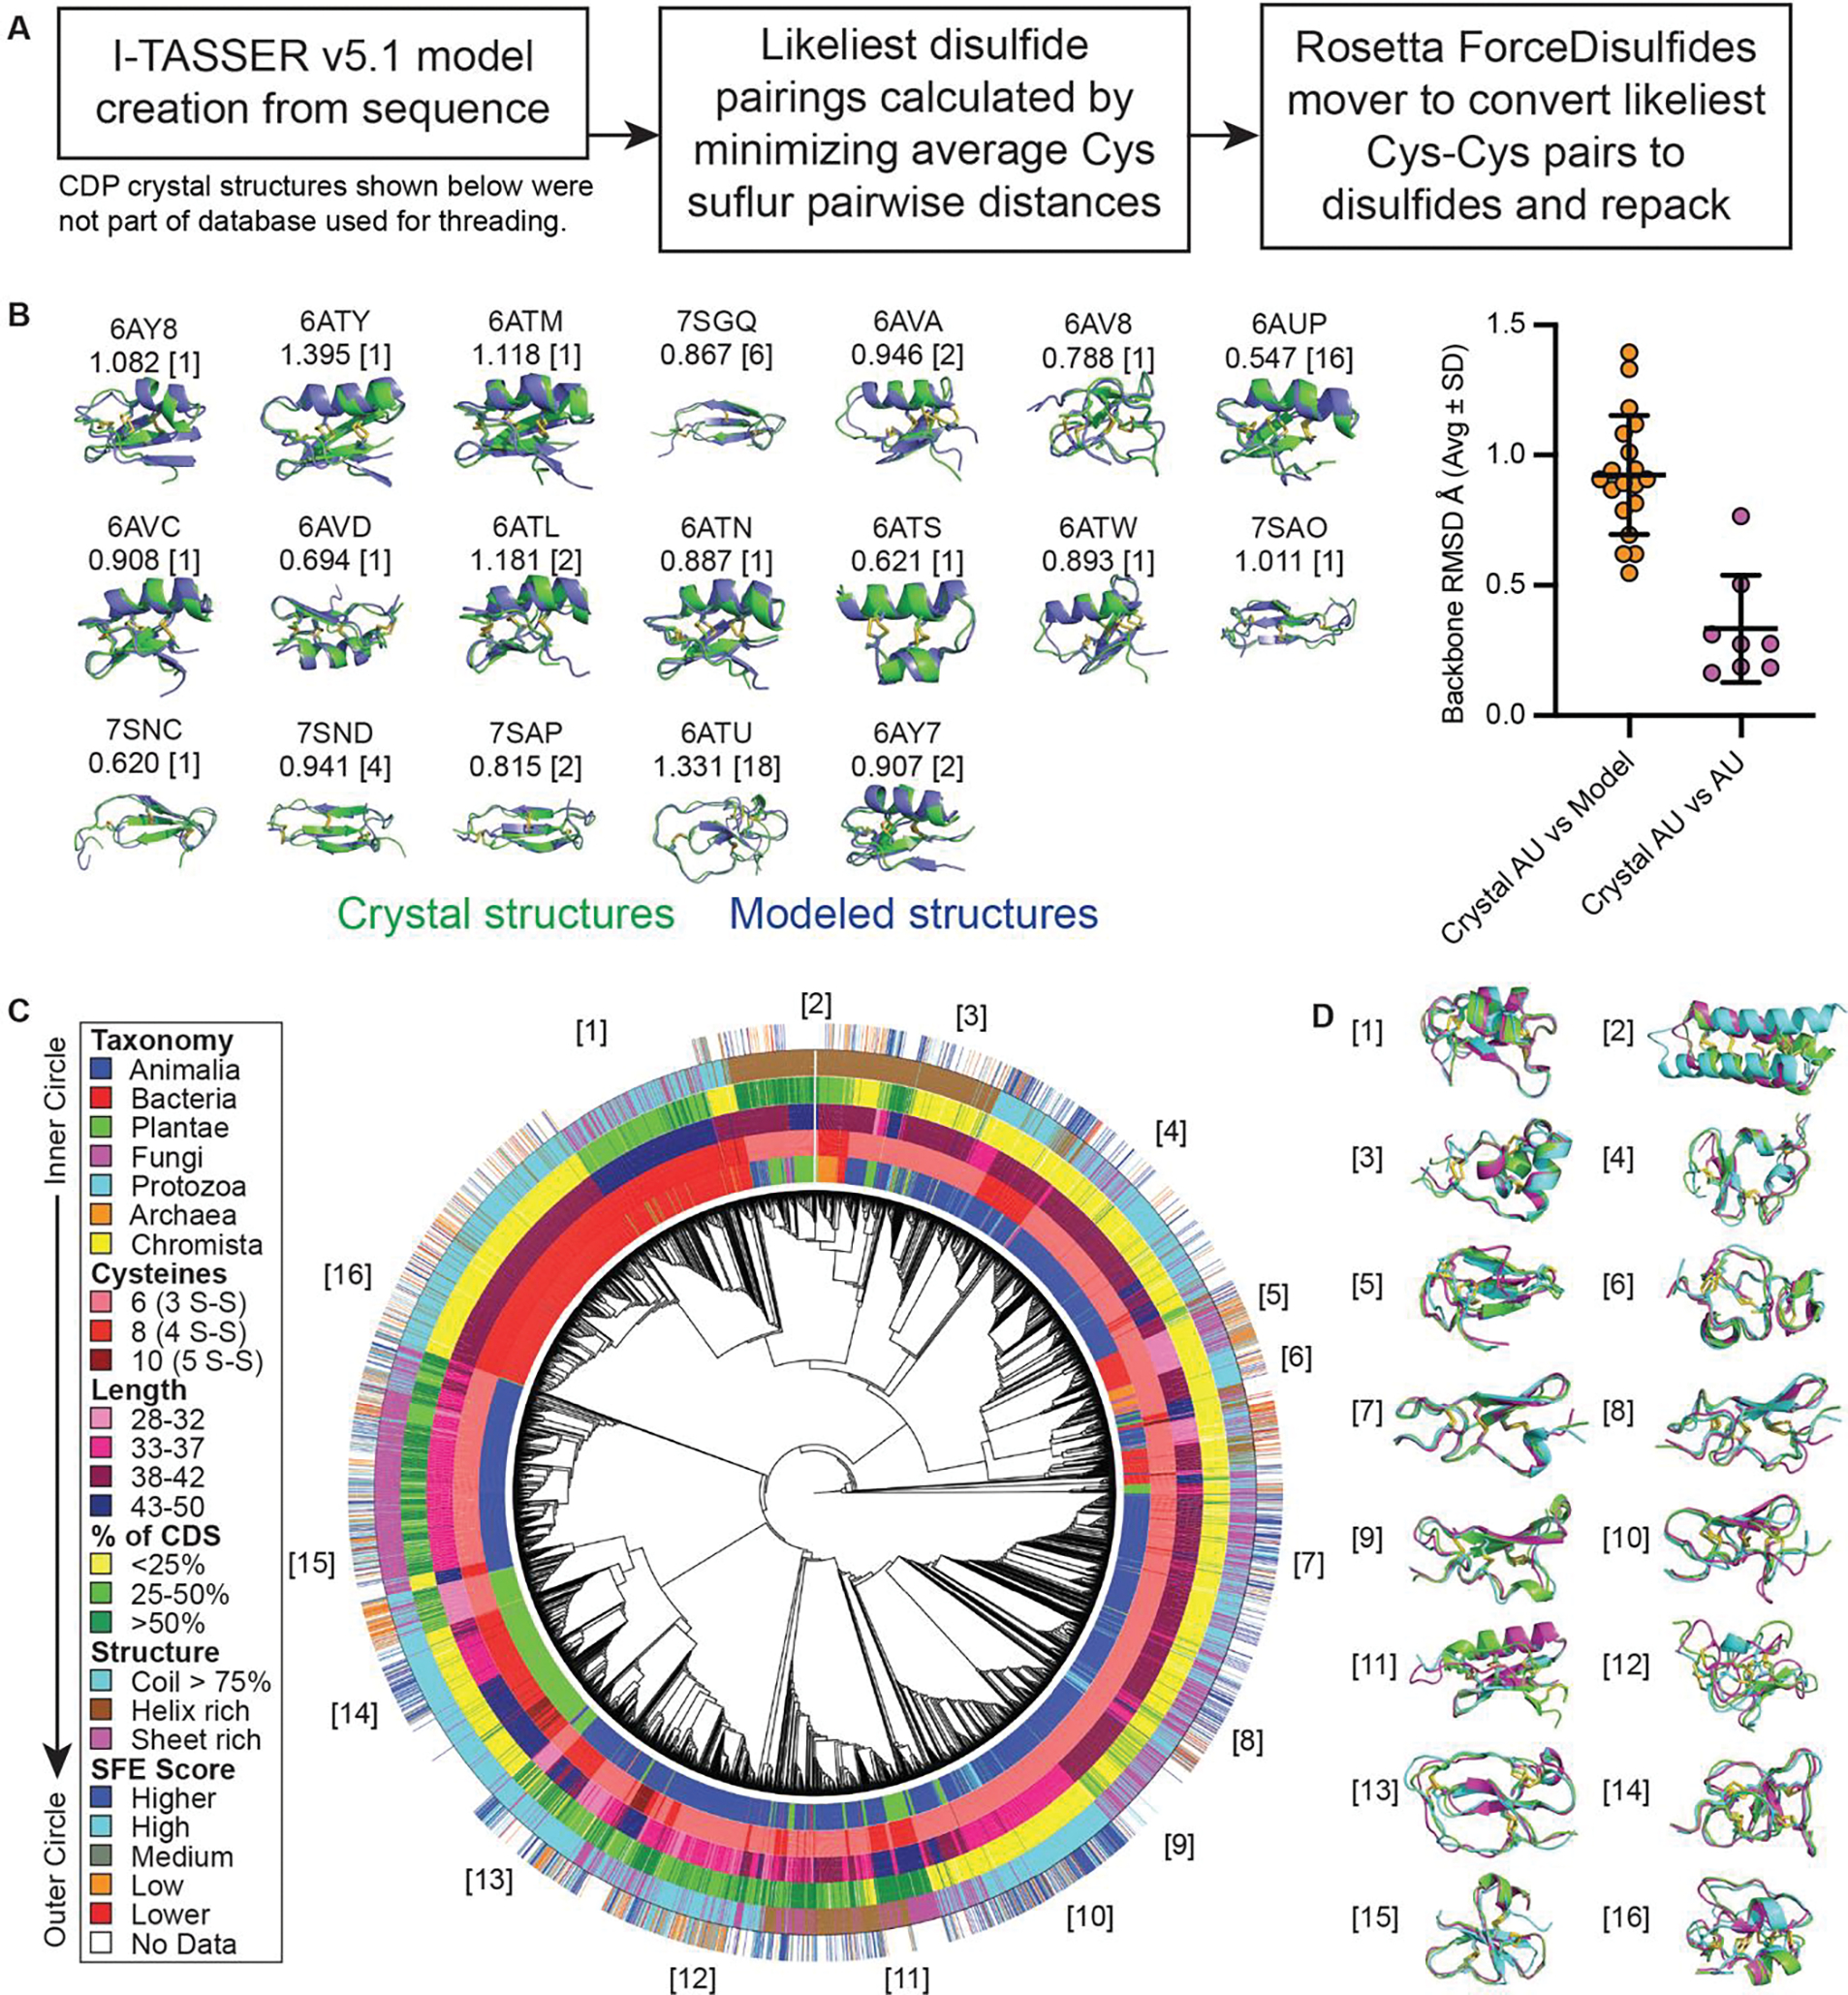
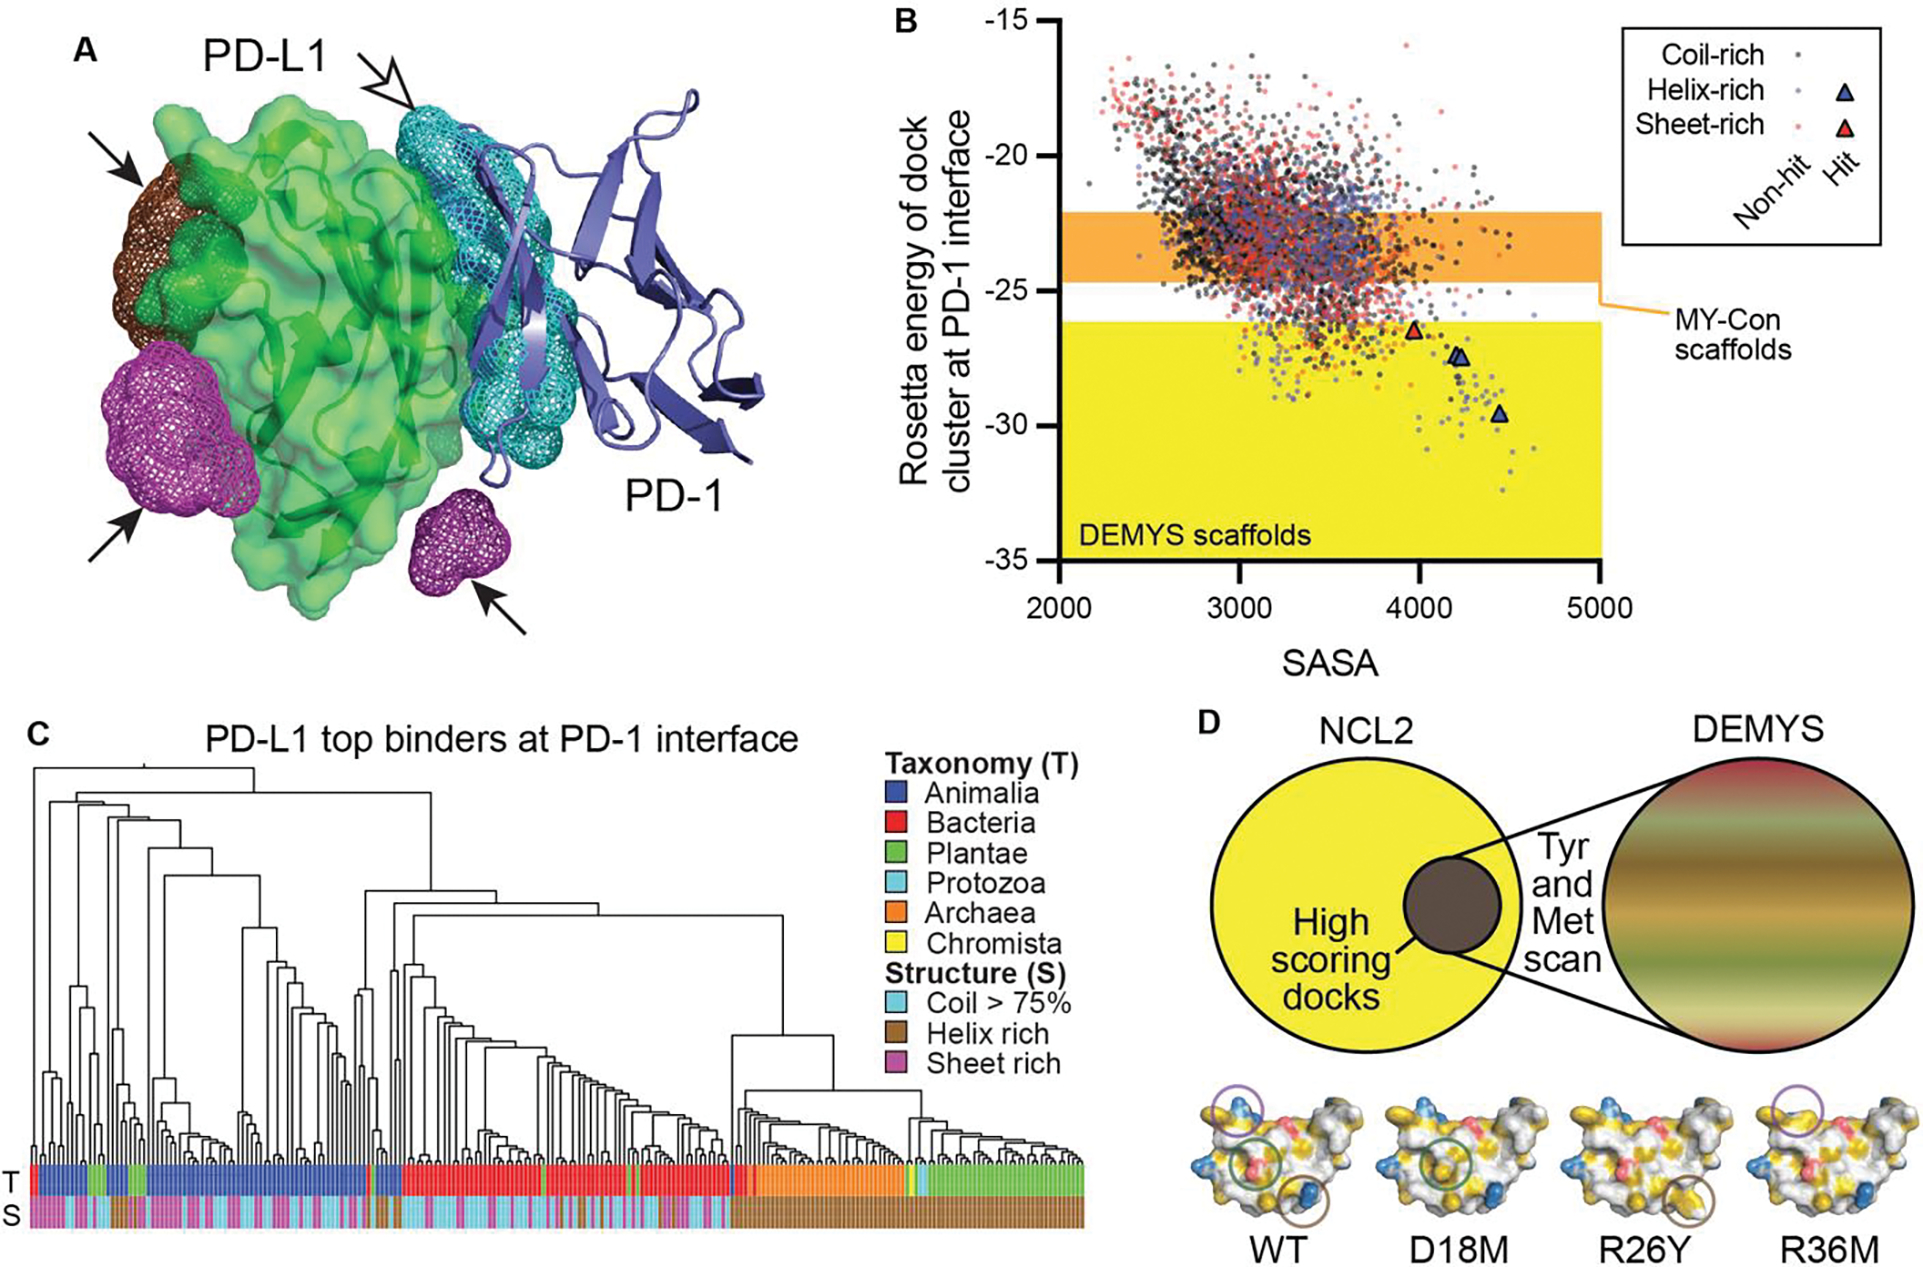
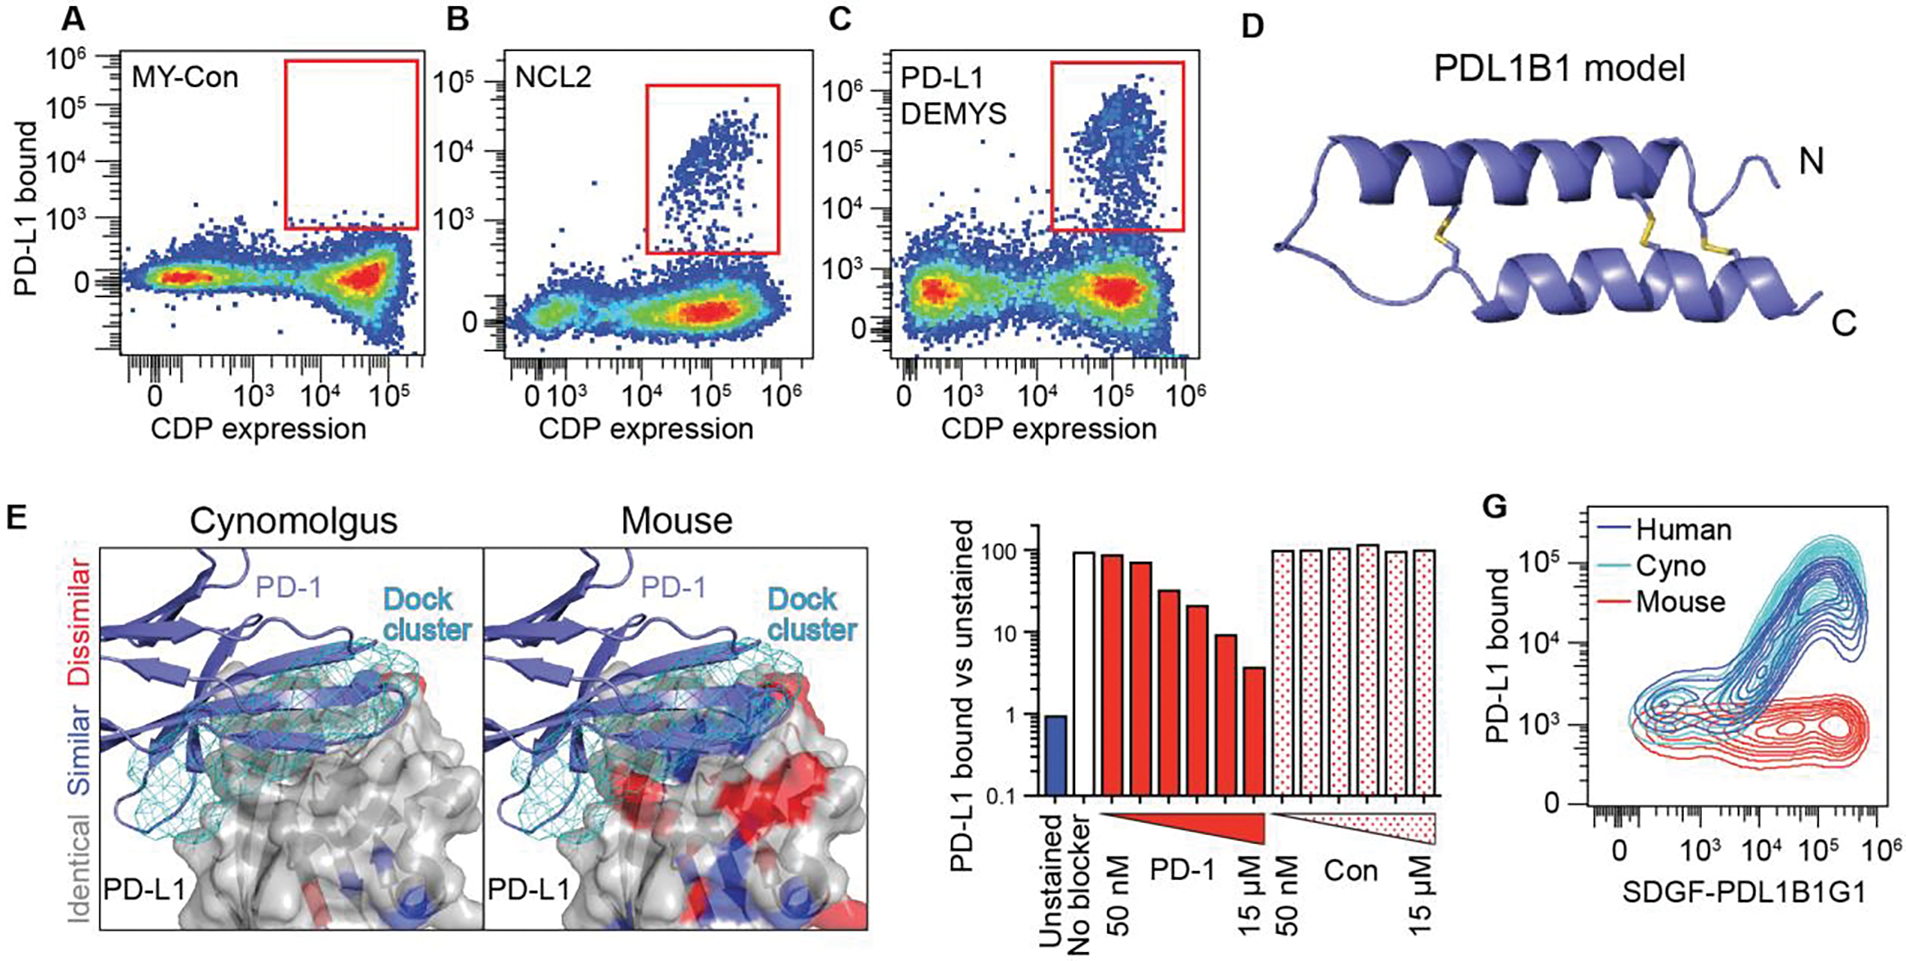
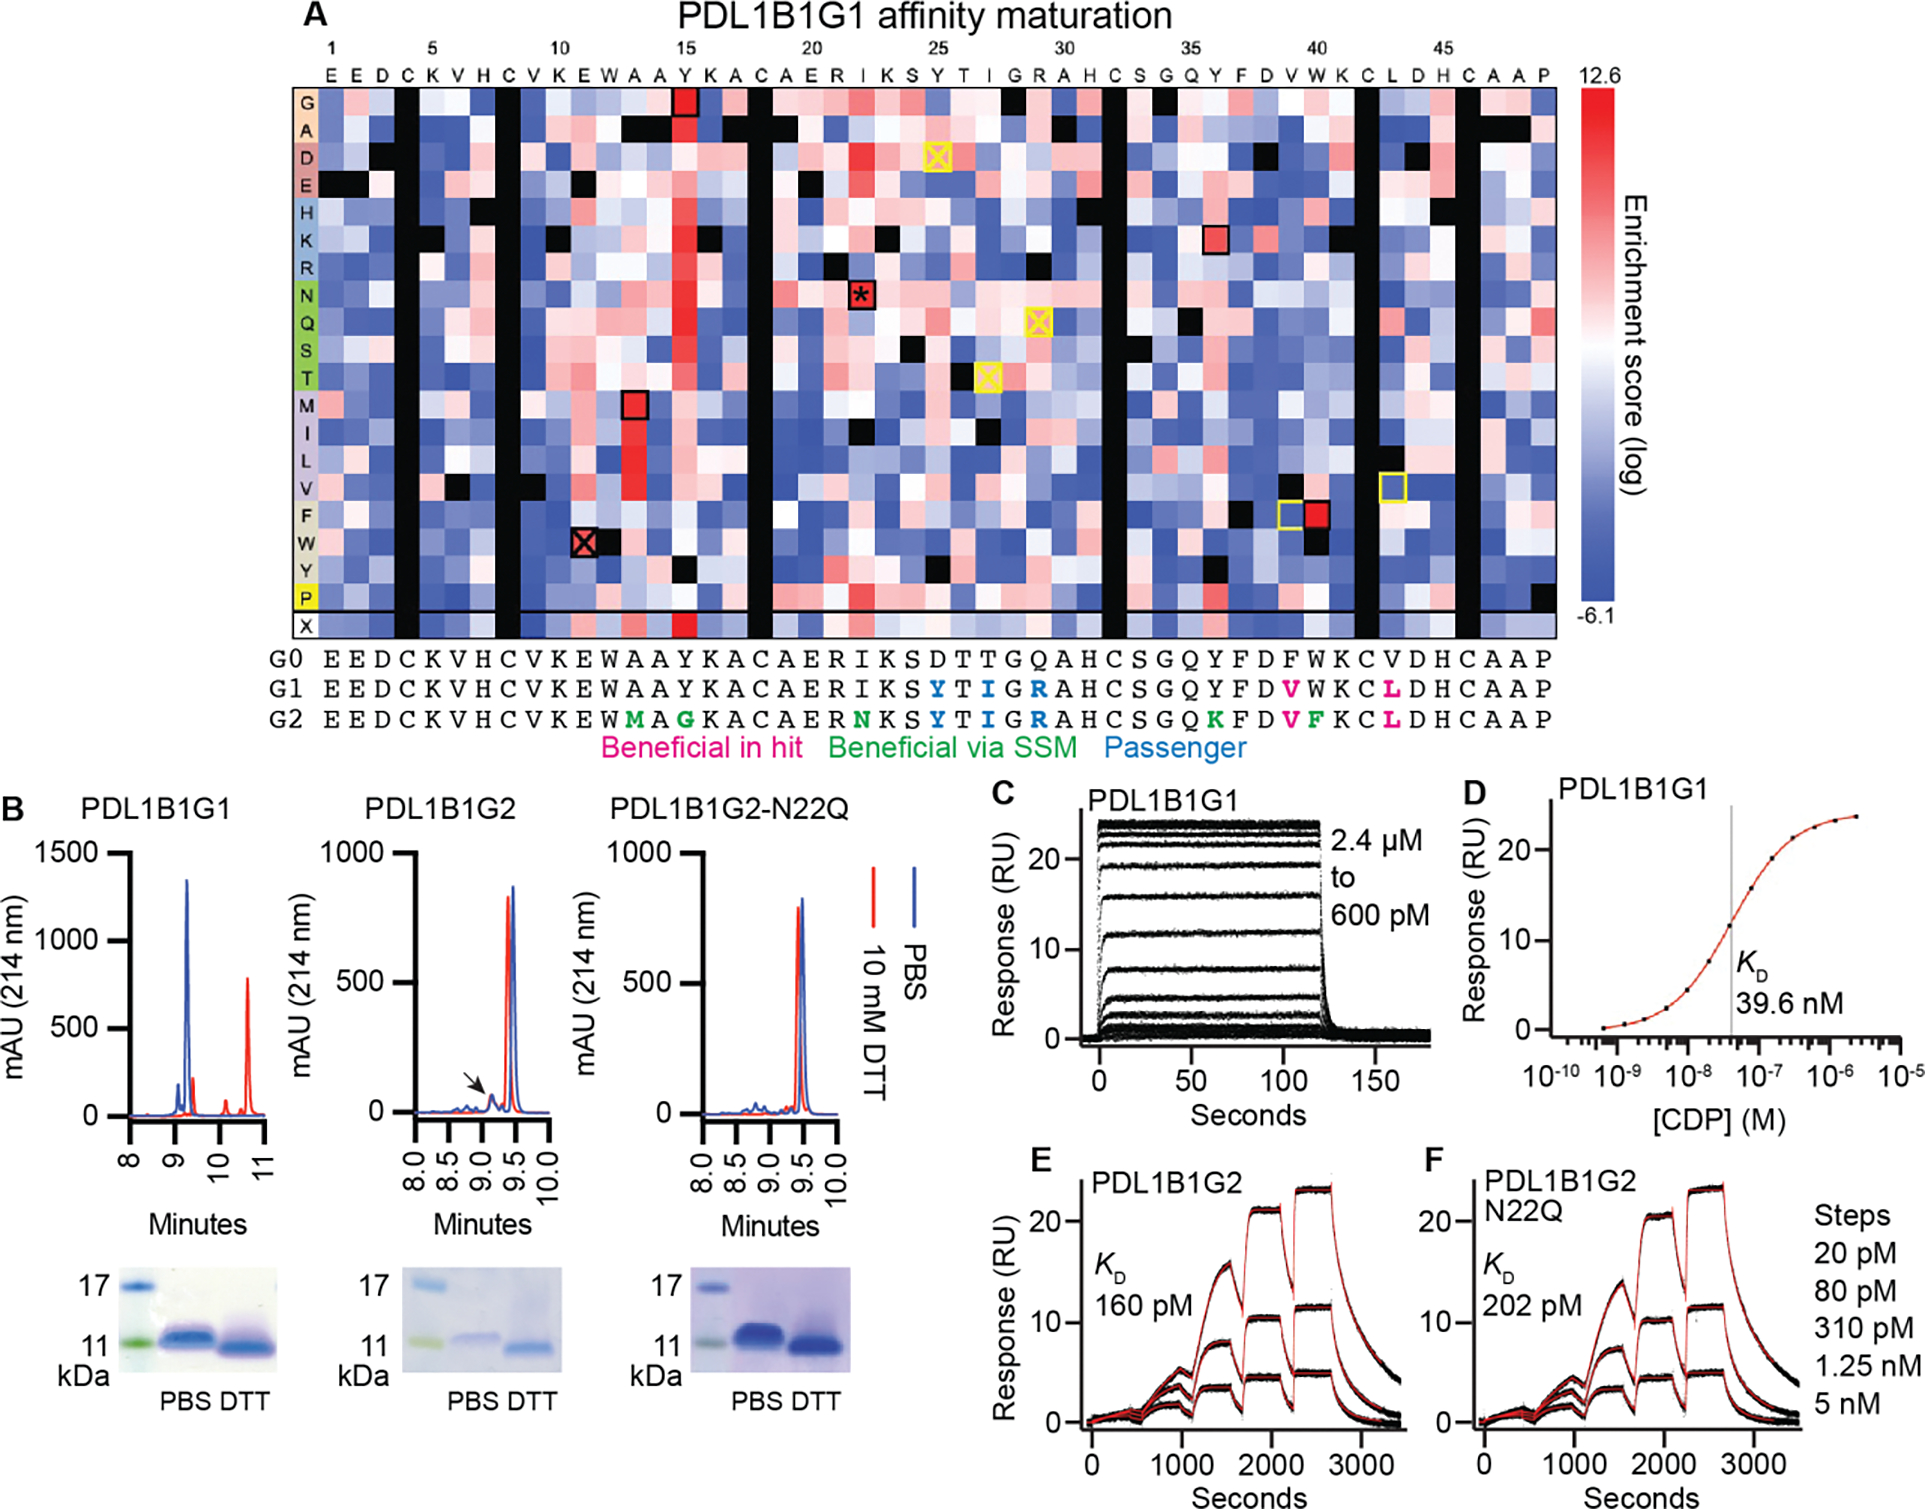
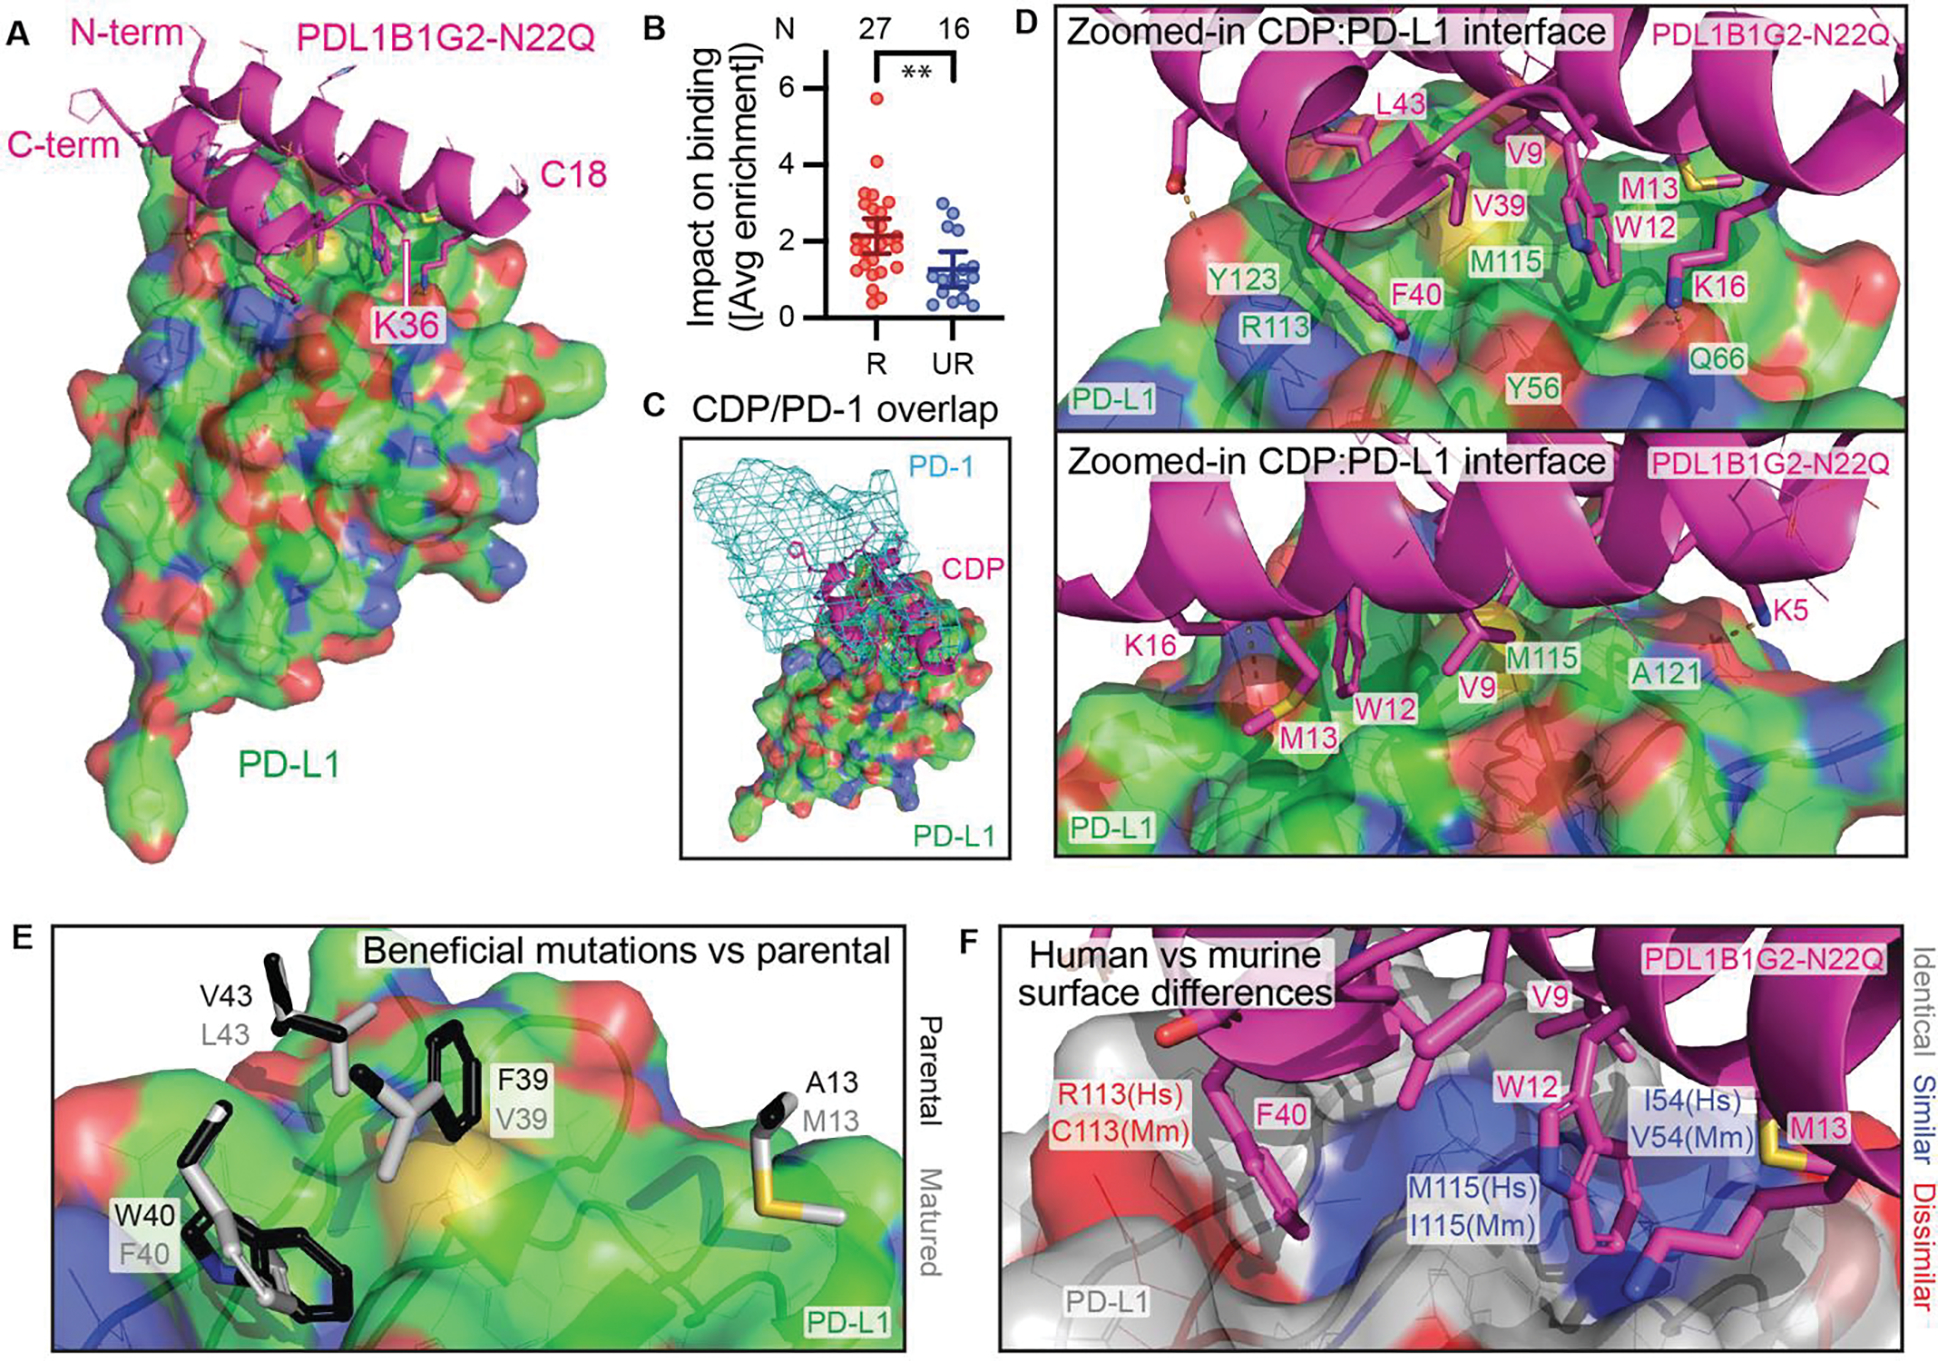
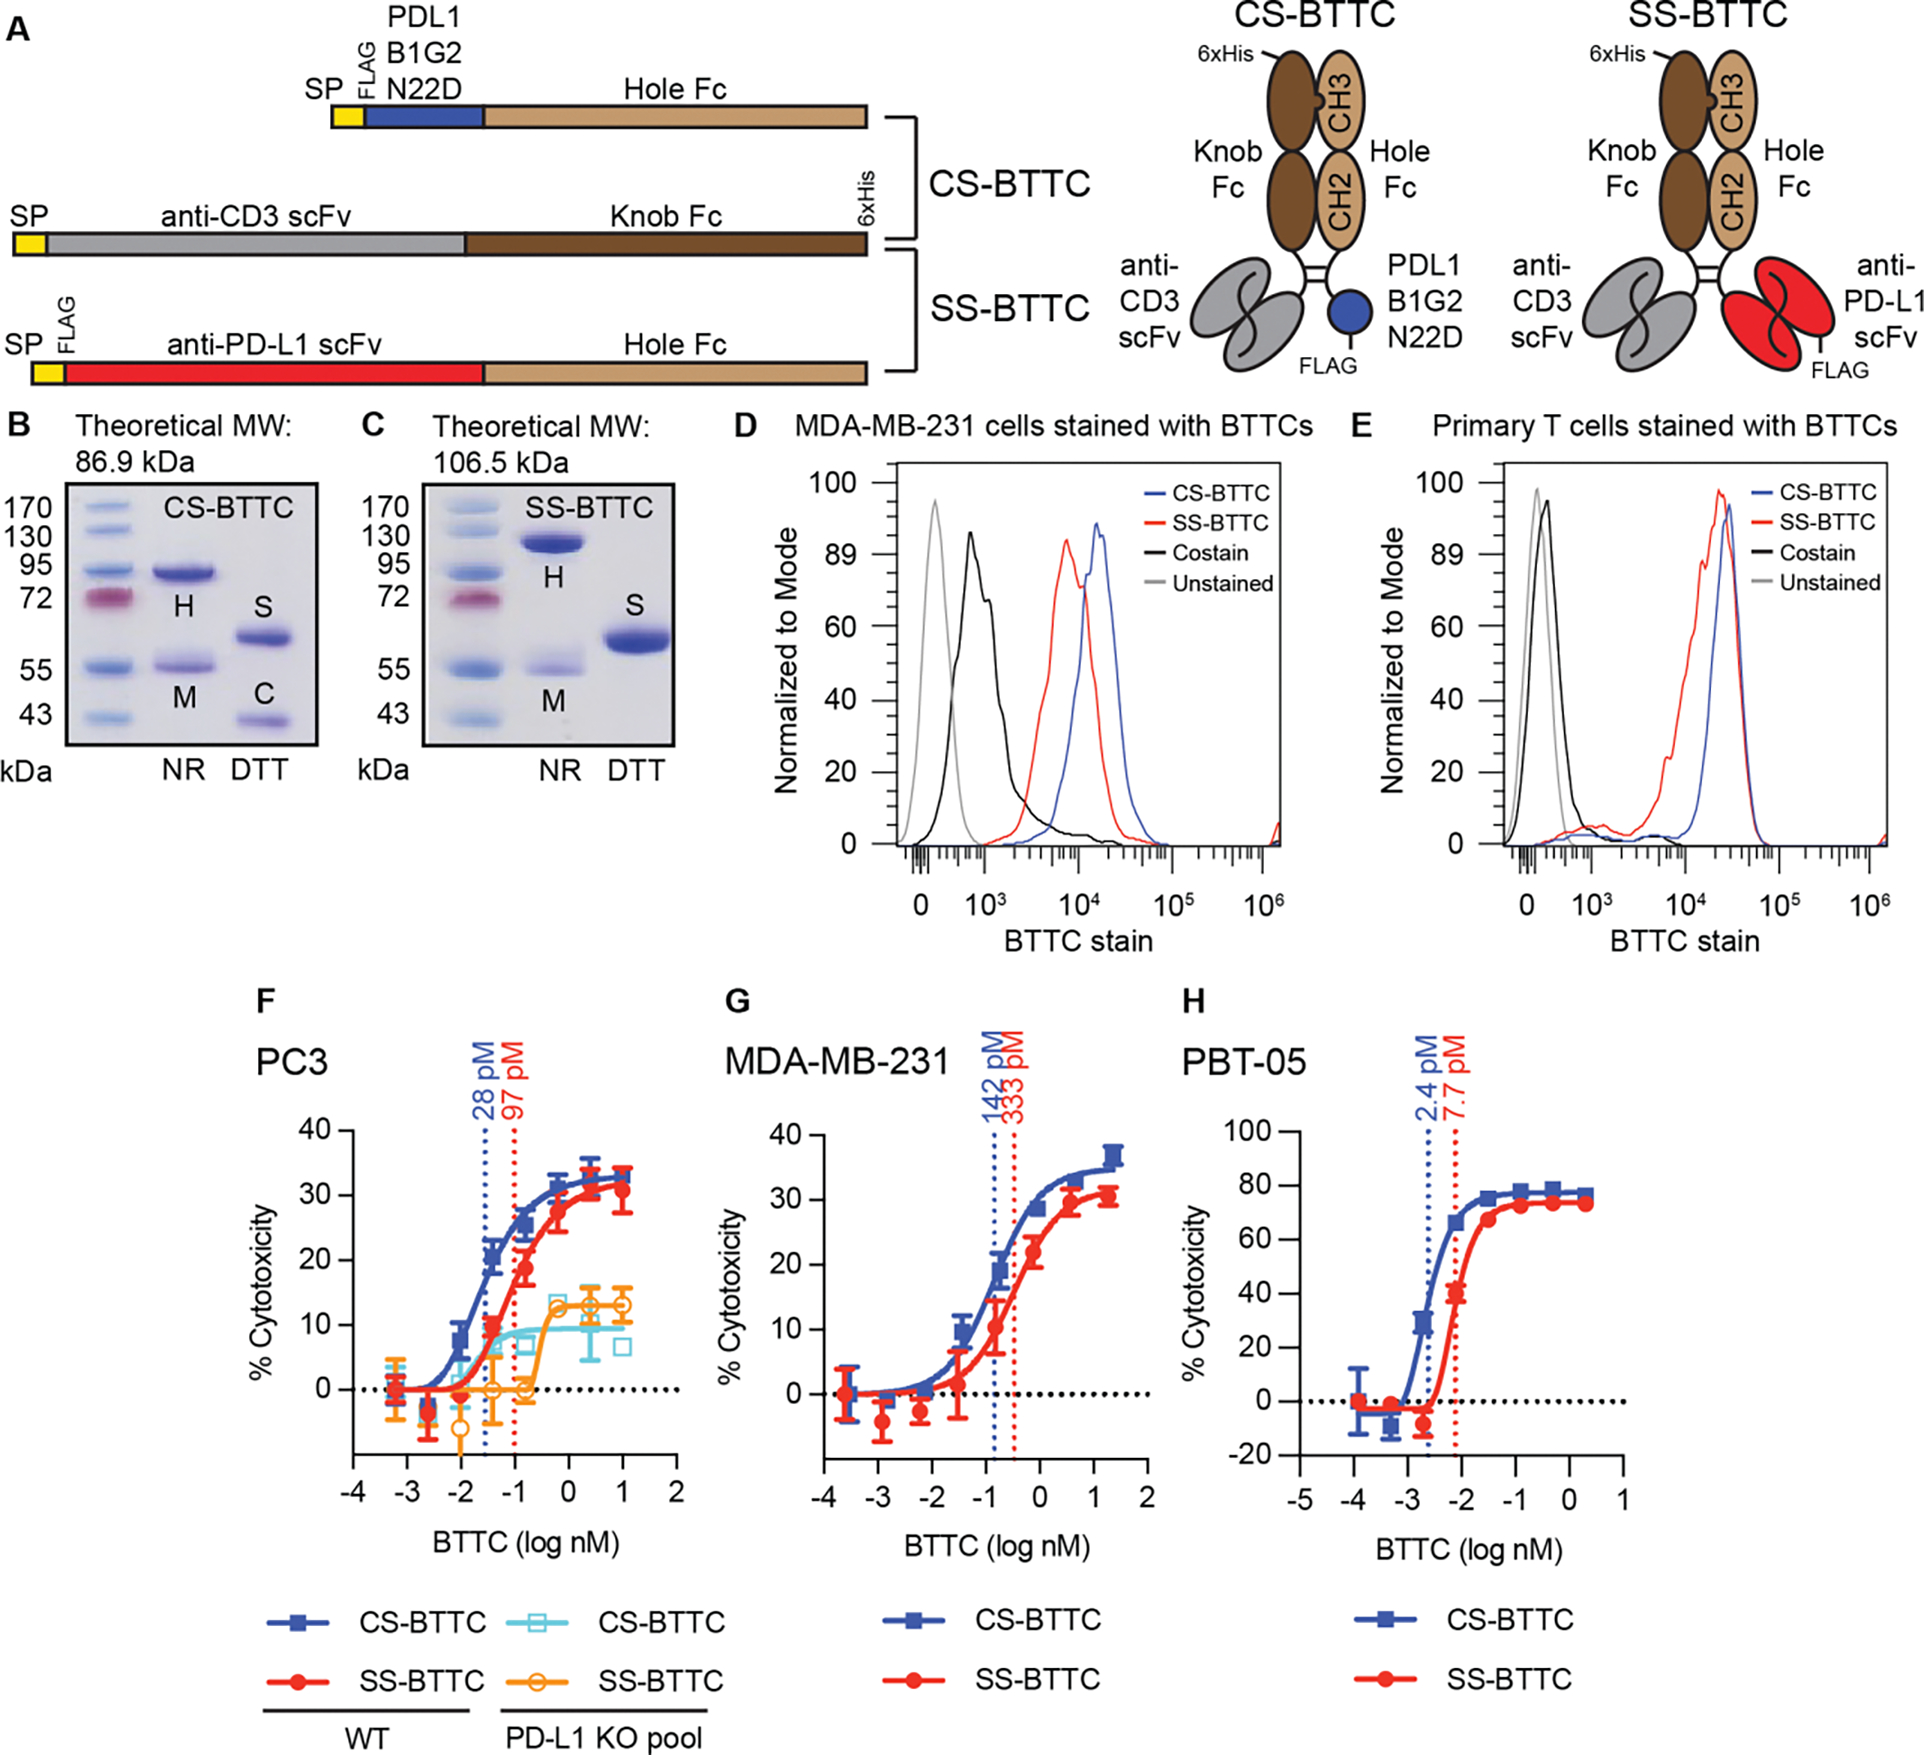
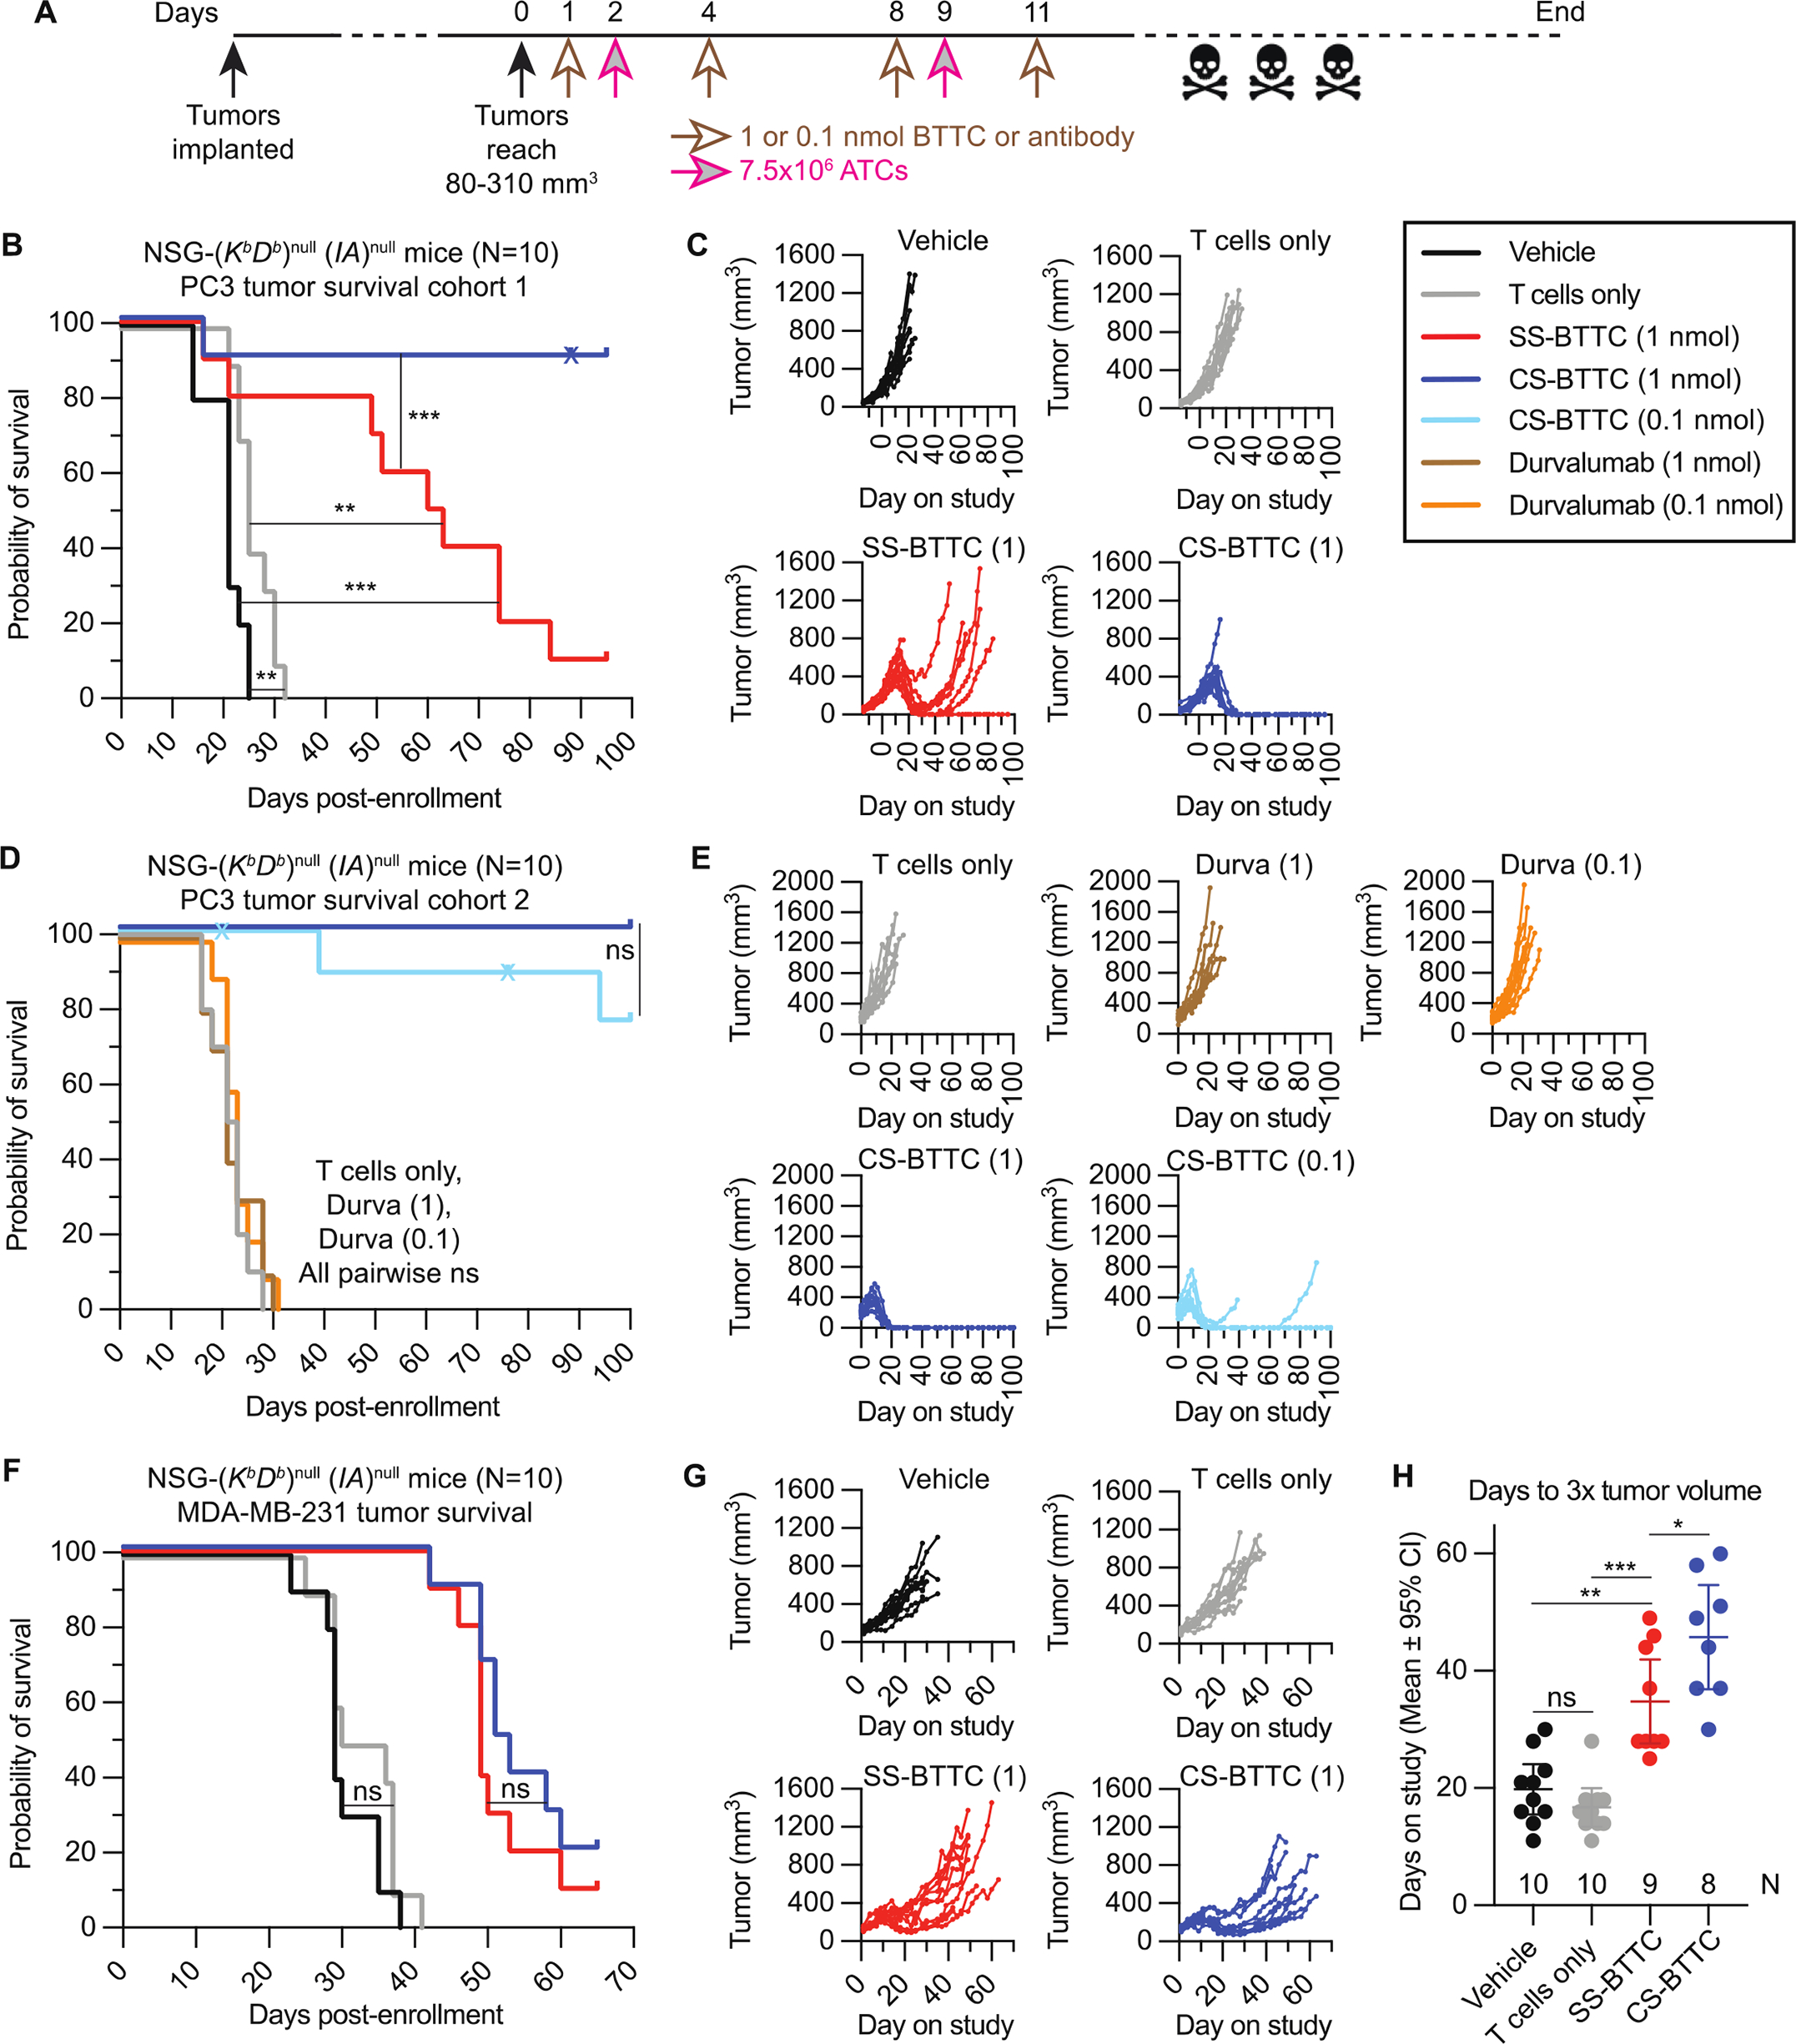
Cystine-dense peptides (CDPs) are a miniprotein class that can drug difficult targets with high affinity and low immunogenicity. Tools for their design, however, are not as developed as those for small-molecule and antibody drugs. CDPs have diverse taxonomic origins, but structural characterization is lacking. Here, we adapted Iterative Threading ASSEmbly Refinement (I-TASSER) and Rosetta protein modeling software for structural prediction of 4298 CDP scaffolds and performed in silico prescreening for CDP binders to targets of interest. Mammalian display screening of a library of docking-enriched, methionine and tyrosine scanned (DEMYS) CDPs against PD-L1 yielded binders from four distinct CDP scaffolds. One was affinity-matured, and cocrystallography yielded a high-affinity (KD = 202 pM) PD-L1-binding CDP that competes with PD-1 for PD-L1 binding. Its subsequent incorporation into a CD3-binding bispecific T cell engager produced a molecule with pM-range in vitro T cell killing potency and which substantially extends survival in two different xenograft tumor-bearing mouse models. Both in vitro and in vivo, the CDP-incorporating bispecific molecule outperformed a comparator antibody-based molecule. This CDP modeling and DEMYS technique can accelerate CDP therapeutic development.


Conflict of interest statement

Competing interests: Blaze Bioscience, Inc. retains intellectual property rights to the CDPs used in this manuscript. J.M.O. is a founder and shareholder of Blaze Bioscience Inc. and serves as a compensated Scientific Advisory Board Member. Z.R.C., G.P.S., T.-D.P., and N.W.N. are currently employees of Blaze Bioscience Inc. with stock options, and Z.R.C. and G.P.S. were paid consultants for Blaze Bioscience, Inc. prior to employment. Z.R.C., N.W.N., C.E.C., and J.M.O. are inventors on patent application PCT/US21/61039 (“PD-L1 Binding Peptides and Peptide Complexes and Methods of Use Thereof”) of which these molecules are a subject. E.J.G., M.-Y.B., P.B.R., D.J.F., M.M.G., M.C., I.L., R.R., F.P., A.B., C.E.C., A.J.M., and R.K.S. have no competing interests.

Figures

Fig. 1.
Fig. 1.. Deriving a second-generation CDP library with improved surface folding characteristics.
(A) Illustration of mammalian surface display principle. If the CDP is not tagged (vector SDGF), tagged (e.g., biotin) target along with a fluorescent co-stain (e.g., streptavidin) stains cells to enrich for target-binding CDPs of interest. When the CDP itself is tagged (e.g., 6xHis, vector SDPR), the fluorescent co-stain (e.g., anti-6xHis) will detect intact CDPs on the surface of the cell. (B and C) High surface folding scores (B) from pooled analysis of library NCL1 permitted homology-based selection from a large CDP library (C) to create a second-generation CDP library, NCL2. (D) Flow-based comparison of SDPR-cloned 6xHis-tagged NCL1 and NCL2 with or without trypsin (5 or 20 μg/mL, 5 mins) followed by DTT treatment (5 mins) and subsequent anti-6xHis antibody staining.
Fig. 2.
Fig. 2.. NCL2 structural modeling using I-TASSER and Rosetta produces accurate, diverse models.
(A) Flow chart of modeling pipeline. (B) 19 CDP crystal structures were compared to their I-TASSER/Rosetta model for structural alignment. Above each model is the RCSB PDB identifier and RMSD (in Å) of the backbone alignment. The asymmetric unit (AU) count in the crystal is in brackets; where AU > 1, RMSD represents the average of the model aligned to each AU. Plotted on the right are the alignment values of crystal vs model (left) compared to the intra-crystal AU alignments of each CDP for which AU > 1. (C) The 8893 members of NCL2 yielded 4298 models of sufficient quality for reliable structural comparisons. The high quality NCL2 models were aligned with one another, shown as a circular cladogram phylogenetic tree. The CDPs’ taxonomy, cysteine count, length, coding sequence (CDS) proportion, dominant structural elements, and surface folding/expression (SFE) score are shown. (D) Example CDP models within a given subclade, identified by number in the cladogram.
Fig. 3.
Fig. 3.. NCL2 model library docking and DEMYS concept.
(A) CDP binder identification for PD-L1 as co-crystalized with PD-1 [PDB 4ZQK]. It was screened in silico against the NCL2 model library with low-resolution RosettaDock to identify possible docking sites. Mesh clouds with arrowheads: DBSCAN docking clusters (up to 200 NCL2 model docking sites); hollow arrowhead indicates cluster of interest for sublibrary production. (B) NCL2 low-resolution docking scores for the PD-L1:PD-1 interface vs solvent accessible surface area (SASA). Color-coded by dominant structural element in the scaffold. Orange and yellow shaded regions illustrate source range for MY-Con and DEMYS libraries, respectively. (C) All-vs-all structural alignment cladogram of PD-L1:PD-1 site DEMYS CDP library. (D) The DEMYS concept. A sample scaffold, color coded by hydrophobicity (yellow are carbon atoms not contacting a polar atom, red are acidic atoms, blue are basic atoms, and white are all others), is shown as WT and three example Met or Tyr mutations that seed or expand hydrophobic patches.
Fig. 4.
Fig. 4.. PD-L1-binding CDP screening and binding behavior.
(A to C) Flow profiles after one magnetic sort and two flow sorts (100 nM PD-L1; flow included 100 nM streptavidin-AlexaFluor 647) to enrich for SDGF-displayed PD-L1 binding CDPs in MY-Con (A), NCL2 (B) and PD-L1 DEMYS (C). NCL2 yielded a single hit and DEMYS screening yielded four. (D) Ribbon model of the parental scaffold of PDL1B1 (PD-L1 binder 1). (E) PD-L1 DEMYS scaffold docking sites (top 200, cyan mesh) on human PD-L1, color-coded for cynomolgus monkey (left) and mouse (right) homology (white, identical residues; blue, similar; red, dissimilar). Ribbon structure is PD-1 bound to PD-L1 (PDB 4ZQK). (F) SDGF-PDL1B1G1:PD-L1 staining with or without PD-1-Fc competitor (“PD-1”) or control Fc fusion (“Con”) at 50 nM, 150 nM, 500 nM, 1.5 μM, 5 μM, or 15 μM. (G) SDGF-PDL1B1G1-expressing cells stained with human, cynomolgus, or mouse PD-L1.
Fig. 5.
Fig. 5.. Affinity maturation of PD-L1-binding CDP and soluble CDP characterization.
(A) Affinity maturation of PDL1B1G1. Heat map represents log2-transformed, normalized enrichment of each variant after two rounds of sorting (top ~7%) and regrowth. Positive enrichment scores represent increased relative abundance and therefore improved binding. Yellow box: detrimental reversion. Crossed out yellow box: Inconsequential reversion. Black box: beneficial and synergistic. Crossed out black box: beneficial but not synergistic. *: novel N-linked glycosite. Below the heatmap are sequences of the parental scaffold (here called G0 for PDL1B1G0), the primary hit (G1, PDL1B1G1), and the affinity-matured final variant (G2, PDL1B1G2), with beneficial (in original hit or via SSM) and passenger mutations indicated. (B) RP-HPLC and SDS-PAGE of recombinant PDL1B1G1, PDL1B1G2, and PDL1B1G2-N22Q. Arrowhead: possible minor species representing glycosylated PDL1B1G2. Note: mobility of CDPs in SDS-PAGE does not always correlate with size markers. For full SDS-PAGE gels, see fig. S12. (C-F) SPR traces of the three CDPs demonstrating a ~200-fold improvement in KD after affinity maturation. C: PDL1B1G1 steady-state traces. D: Steady-state curve fit. E: Single-cycle PDL1B1G2 traces. F: Single-cycle PDL1B1G2-N22Q traces. Black lines are data, red lines are the model fits.
Fig. 6.
Fig. 6.. Co-crystallization of PDL1B1G2-N22Q with PD-L1.
(A) Co-crystal structure of PDL1B1G2-N22Q (magenta cartoon) with PD-L1 (green surface). (B) Impact on binding (shown as absolute values of residues’ average SSM enrichment scores) of mutations to resolved (R; N = 27) residues compared to unresolved (UR; N = 16) residues, mean ± 95% CI. **P = 0.0055 by Mann-Whitney test. (C) PD-1 (cyan mesh surface, from PDB 4ZQK) binding site overlaps with CDP site. (D) From two different angles, a zoomed-in view of the CDP:PD-L1 interface. (E) Select side chains from PDL1B1G2-N22Q (white) at the PD-L1 interface are shown with parental residues (black, minimally clashing rotamers) superimposed. (F) CDP:PD-L1 interface where the PD-L1 surface is color-coded for human (Hs) vs murine (Mm) homology (white, identical residues; blue, similar; red, dissimilar). For surfaces in panels A, C, D, and E, and for side chain lines/sticks in all panels, non-C atoms are color-coded as follows: red, O; blue, N; yellow, S.
Fig. 7.
Fig. 7.. Incorporation of PDL1B1G2-N22D and comparator anti-PD-L1 scFv into CD3-engaging BTTCs.
(A) Construct design. Both CS-BTTC and SS-BTTC share the anti-CD3-scFv-Fc arm; CS-BTTC was co-expressed with a PDL1B1G2-N22D-Fc, while SS-BTTC was co-expressed with anti-PD-L1-scFV-Fc. Knob-and-hole design enriches products for heterodimers via His-tag purification (nickel IMAC). SP = signal peptide. Primary sequence designs on the left, cartoons of purified heterodimers on the right. (B and C) SDS-PAGE of CS-BTTC (B) and SS-BTTC (C); heterodimer theoretical molecular weight (MW) above. Heterodimer [H] is present in non-reduced (NR) lanes, while in reduced (DTT) lanes, separate CDP-Fc [C] and scFv-Fc [S] species are visible. In both preps, anti-CD3-scFv-Fc monomer [M] is present as an impurity that did not affect TCK performance. (D and E) Flow staining of MDA-MB-231 cells (D) and primary T cells from PBMCs (E) using CS-BTTC and SS-BTTC along with fluorescent anti-6xHis antibody (costain). (F to H) In vitro TCK assays in three cancer cell lines (N = 3 per concentration): PC3 (F), MDA-MB-231 (G), and PBT-05 (H). Each BTTC’s EC50 concentration is shown. For PC3 (F), pooled PD-L1 knockout cells were tested in parallel. For full SDS-PAGE gels, see fig. S12. EC50 values determined using Graphpad Prism version 9.
Fig. 8.
Fig. 8.. Immunocompromised mice with subcutaneous tumors treated with ATCs and BTTCs.
(A) Experimental design; n = 10 per arm. (B) PC3 tumor cohort 1 survival curve of four treatment arms: Vehicle (no T cells or BTTC), T cells only (no BTTC), SS-BTTC 1 nmol (T cells plus 1 nmol SS-BTTC), and CS-BTTC 1 nmol (T cells plus 1 nmol CS-BTTC). (C) PC3 tumor cohort 1 tumor growth curves. (D) PC3 tumor cohort 2 survival curve of five treatment arms: Vehicle, durvalumab 1 nmol (T cells plus 1 nmol durvalumab), durvalumab 0.1 nmol (T cells plus 0.1 nmol durvalumab), CS-BTTC 1 nmol, and CS-BTTC 0.1 nmol. (E) PC3 tumor cohort 2 tumor growth curves. (F) MDA-MB-231 tumor survival curves of four treatment arms; same design as (B). (G) MDA-MB-231 tumor growth curves. (H) Days on study for MDA-MB-231 tumors to triple in volume, mean ± 95% CI. Mice euthanized prior to tumor reaching 3x starting volume were censored (one from SS-BTTC group, two from CS-BTTC group). ns: not statistically significant. *: P < 0.05. **: P < 0.01. ***: P < 0.001. Unlabeled: P ≤ 0.0001. Kaplan-Meier curve P values are by Mantel-Cox test. x: Censored. Days to 3x tumor volume comparisons are by Mann-Whitney test.

References

    1. Coleman N, Rodon J, Taking Aim at the Undruggable, Am. Soc. Clin. Oncol. Educ. B., e145–e152 (2021). - PubMed
    1. Yoo HJ, Harapan BN, Chimeric antigen receptor (CAR) immunotherapy: basic principles, current advances, and future prospects in neuro-oncology, Immunol. Res. (2021), doi:10.1007/s12026-021-09236-x. - DOI - PMC - PubMed
    1. Antonarelli G, Giugliano F, Corti C, Repetto M, Tarantino P, Curigliano G, Research and Clinical Landscape of Bispecific Antibodies for the Treatment of Solid Malignancies, Pharmaceuticals 14, 884 (2021). - PMC - PubMed
    1. Crook ZR, Nairn NW, Olson JM, Miniproteins as a Powerful Modality in Drug Development, Trends Biochem. Sci. 45, 332–346 (2020). - PMC - PubMed
    1. Busby RW, Kessler MM, Bartolini WP, Bryant AP, Hannig G, Higgins CS, Solinga RM, Tobin JV, Wakefield JD, Kurtz CB, Currie MG, Pharmacologic Properties, Metabolism, and Disposition of Linaclotide, a Novel Therapeutic Peptide Approved for the Treatment of Irritable Bowel Syndrome with Constipation and Chronic Idiopathic Constipation, J. Pharmacol. Exp. Ther. 344, 196–206 (2013). - PubMed

Publication types