

Wastewater based epidemiology as a silent sentinel of the trend of SARS-CoV-2 circulation in the community in central Argentina
- PMID: 35584586
- PMCID: PMC9066365
- DOI: 10.1016/j.watres.2022.118541
Wastewater based epidemiology as a silent sentinel of the trend of SARS-CoV-2 circulation in the community in central Argentina
Abstract
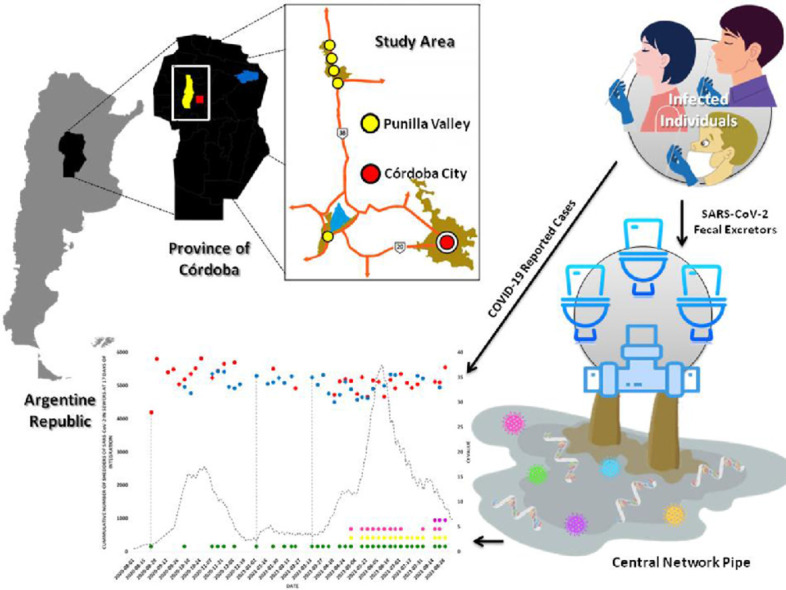
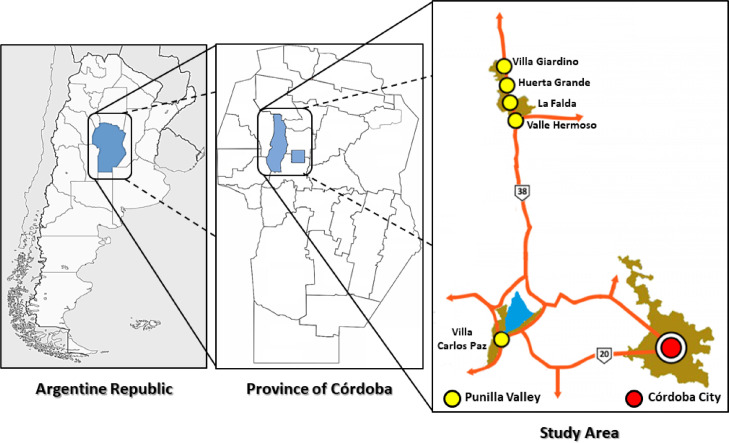
Monitoring wastewater for the traces of viruses allows effective surveillance of entire communities, including symptomatic and asymptomatic infected individuals, providing information on whether a specific pathogen is circulating in a population. In the context of the COVID-19 pandemic, 261 wastewater samples from six communities of the province of Córdoba, Argentina were analyzed. From mid-May 2020 to the end of August 2021, raw sewage samples were collected from the central network pipe that enters into the Wastewater Treatment Plants (WWTP) in Córdoba city and five communities in the Punilla Valley. SARS-CoV-2 was concentrated by using the polyethylene glycol-6000 precipitation method. Viral genomes were extracted from concentrated samples, and N- and E-SARS-CoV-2 genes were detected by using real time RT-PCR. Wastewater samples that resulted positive for SARS-CoV-2 genome detection were subjected to viral variants of concern (VOCs) identification by real time RT-PCR. Overall, just by using the identification of the N gene or E gene, the rates of viral genome detection were 43.4% (86/198) and 51.5% (102/198) respectively, and by using both methodologies (positivity criterion: detection of N and / or E gene), the detection rate was 71.2% (141/198). Thereby, the optimal strategy to study the SARS-CoV-2 genome in wastewater would be the use of the combined detection of both genes. Detection of SARS-CoV-2 variants in wastewater reflected their circulation in the community, showing no VOCs detection in the first COVID-19 wave and their co-circulation with Gamma, Alpha and Delta VOCs during 2021. Therefore, SARS-CoV-2 Wastewater Based Epidemiology (WBE) described the introduction, permanence and/or the co-circulation of viral variants in the community. In geographical areas with a stable population, SARS-CoV-2 WBE could be used as an early warning sign of new COVID-19 cases, whereas in localities with a low number of inhabitants and high tourist influx, WBE may only be useful to reflect the circulation of the virus in the community. Overall, the monitoring of SARS-CoV-2 in wastewater can become a silent sentinel of the trend of viral circulation in the community, providing supplementary information for clinical surveillance to support public health measures.
Keywords: COVID-19; Pandemic; SARS-COV-2 variants in wastewater; SARS-CoV-2; Wastewater-based epidemiology.
Copyright © 2022 Elsevier Ltd. All rights reserved.
Conflict of interest statement
The authors declare that they do not have competing financial interests or personal relationships that could have influenced the work reported in this paper.
Figures
 and
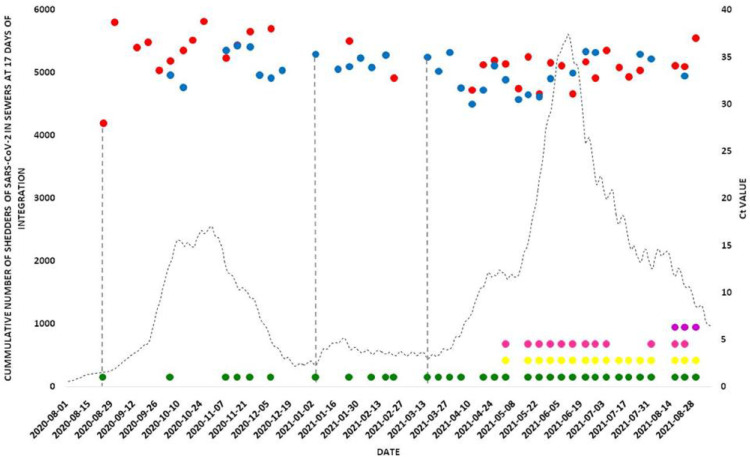
and  : detection of the SARS-CoV-2 genome by identifying the N and E genes respectively. Pointed Wheels: Identification of SARS-CoV-2 and VOCs by Typing:
  No VOCs;
  Alpha,
  Gamma and
  Delta.Vertical line: represents the first SARS-CoV-2 genome detection in wastewater on each period.
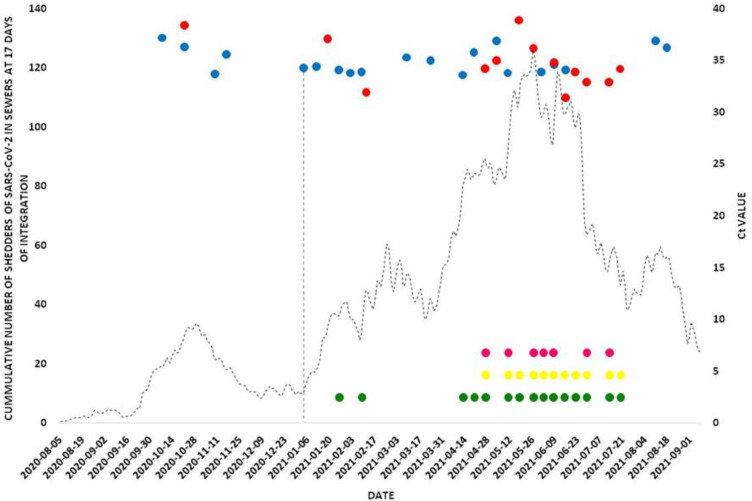
 and
and  : detection of the SARS-CoV-2 genome by identifying the N and E genes respectively. Pointed Wheels: Identification of SARS-CoV-2 and VOCs by Typing: No VOCs;
  Alpha and
  Gamma.
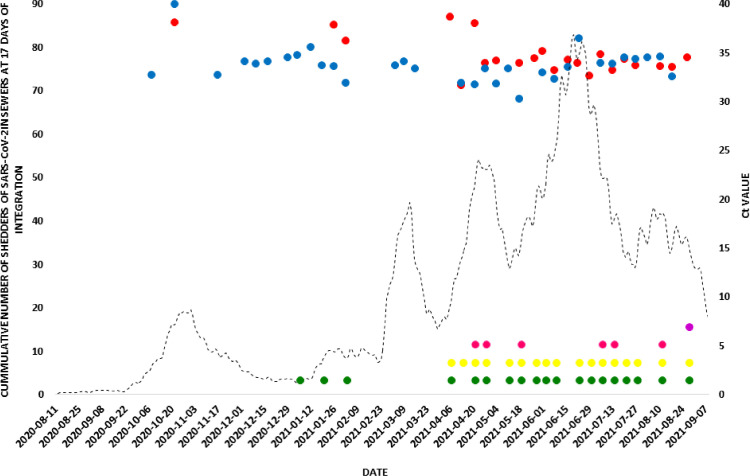 and
and  : detection of the SARS-CoV-2 genome by identifying the N and E gene respectively. Pointed Wheels: Identification of SARS-CoV-2 and VOCs by Typing:
  No VOCs;
  Alpha,
  Gamma and
  Delta.
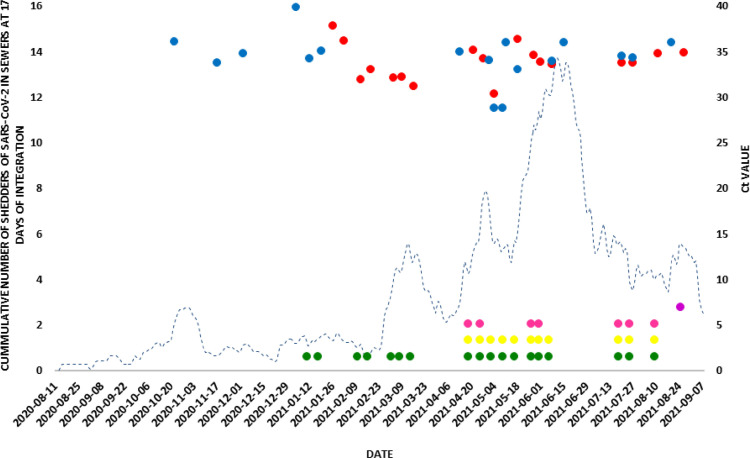 and : detection of the SARS-CoV-2 genome by identifying the N and E gene respectively. Pointed Wheels: Identification of SARS-CoV-2 and VOCs by Typing:
  No VOCs;
  Alpha,
  Gamma and Delta.
References
MeSH terms
Substances
Supplementary concepts
LinkOut - more resources
Full Text Sources
Medical
Miscellaneous
