Randomized Controlled Trial
. 2022 May 17;3(5):100633.
doi: 10.1016/j.xcrm.2022.100633.

Urolithin A improves muscle strength, exercise performance, and biomarkers of mitochondrial health in a randomized trial in middle-aged adults

Affiliations
Randomized Controlled Trial

Urolithin A improves muscle strength, exercise performance, and biomarkers of mitochondrial health in a randomized trial in middle-aged adults

Anurag Singh et al. Cell Rep Med. .

Abstract

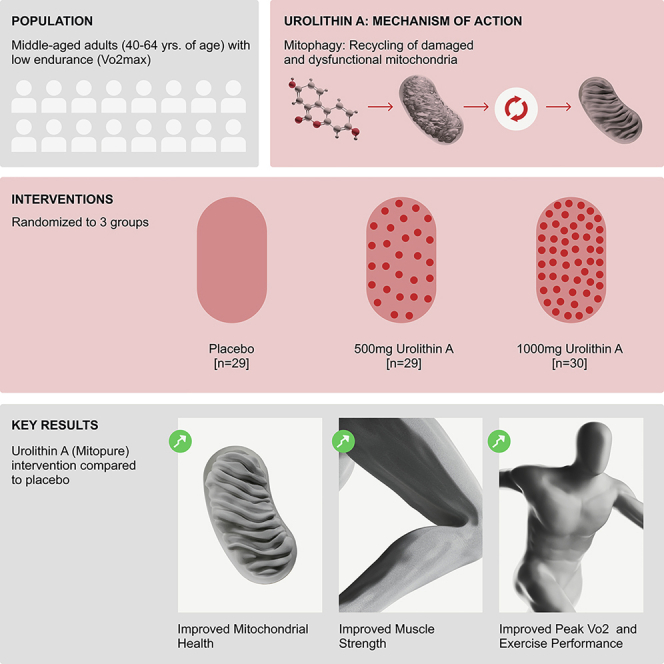
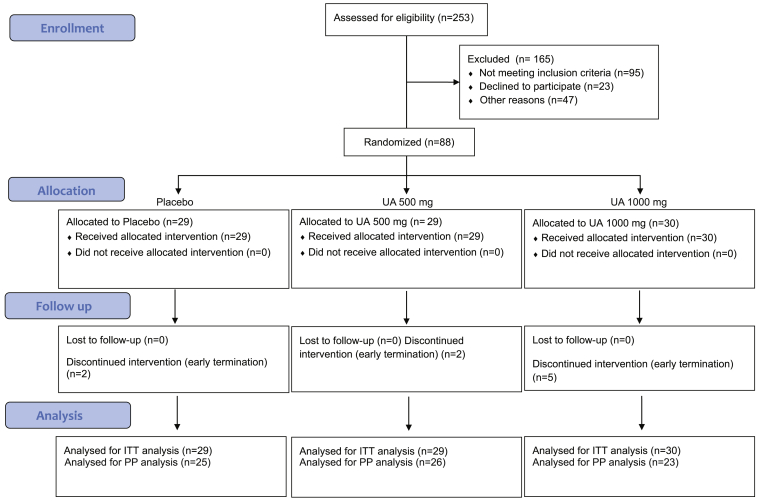
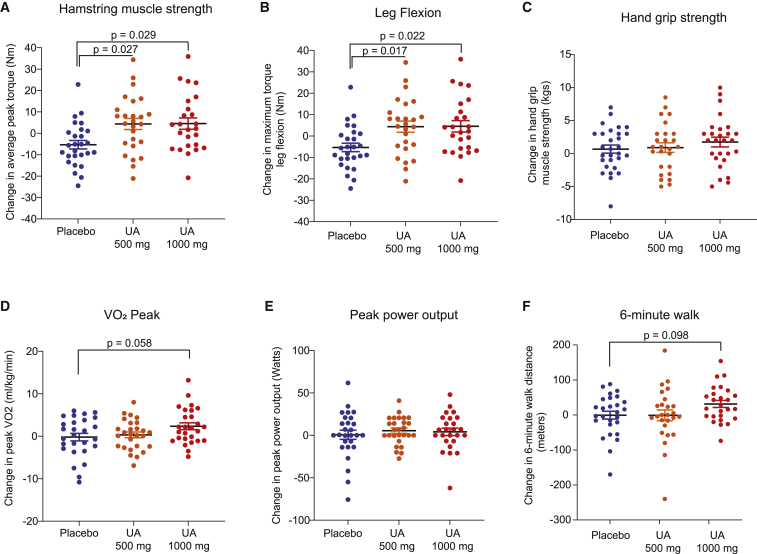
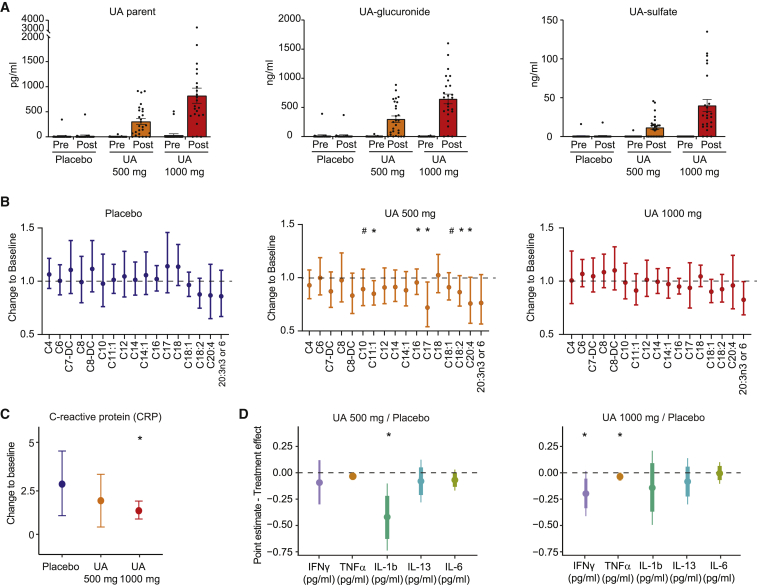
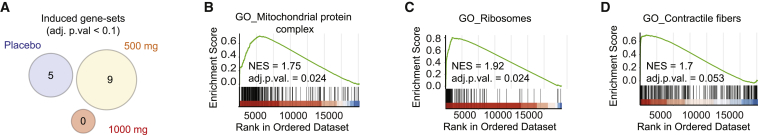
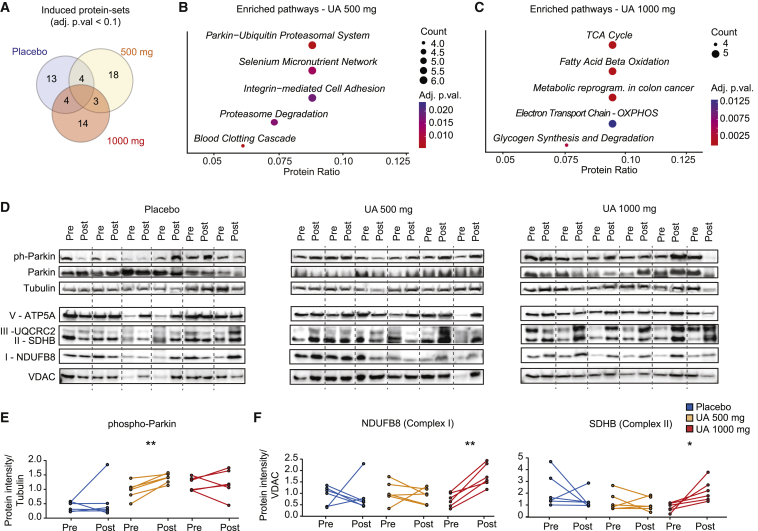
Targeting mitophagy to activate the recycling of faulty mitochondria during aging is a strategy to mitigate muscle decline. We present results from a randomized, placebo-controlled trial in middle-aged adults where we administer a postbiotic compound Urolithin A (Mitopure), a known mitophagy activator, at two doses for 4 months (NCT03464500). The data show significant improvements in muscle strength (∼12%) with intake of Urolithin A. We observe clinically meaningful improvements with Urolithin A on aerobic endurance (peak oxygen oxygen consumption [VO2]) and physical performance (6 min walk test) but do not notice a significant improvement on peak power output (primary endpoint). Levels of plasma acylcarnitines and C-reactive proteins are significantly lower with Urolithin A, indicating higher mitochondrial efficiency and reduced inflammation. We also examine expression of proteins linked to mitophagy and mitochondrial metabolism in skeletal muscle and find a significant increase with Urolithin A administration. This study highlights the benefit of Urolithin A to improve muscle performance.

Keywords: Mitopure; Urolithin A; aging; clinical trial; exercise performance; mitochondria; mitophagy; muscle strength.


Conflict of interest statement

Declaration of interests A.S., D.D., P.A.A., A.M.F., W.B.-B., and C.R. are employees, P.A. and C.R. are board members, and J.A. and P.A. are members of the Scientific Advisory Board of Amazentis SA, who is the sponsor of this clinical study.

Figures

None
Graphical abstract
Figure 1
Figure 1
CONSORT diagram of participant inclusion through the clinical study The ATLAS study was a single-center, randomized, double-blind, placebo-controlled interventional clinical trial (ClinicalTrials.gov: NCT03464500) performed in untrained, overweight, middle-aged subjects (n = 88). Subjects (253) were screened during the course of the study from a single study site. From these, eighty-eight participants that met the study inclusion and exclusion criteria were randomized in the trial. Subjects were randomized to either placebo (n = 29) or 500 (n = 29) or 1,000 mg (n = 30) doses of UA intervention. The total study duration was 4 months. Nine subjects did not complete the study (n = 9 dropouts), whereas seventy-nine (n = 79) subjects successfully completed the trial duration. All randomized subjects were included in the intent-to-treat (ITT) study population (i.e., study population consisting of all randomized participants). Dietary recall questionnaires revealed no major changes in diet during the course of the study, and the subjects did not receive any additional exercise regimen. Five subjects with low compliance were excluded from the per-protocol (PP) population (n = 74; i.e., including participants with >80% compliance and completing all study visits).
Figure 2
Figure 2
Urolithin A oral administration significantly improves leg muscle strength and impacts aerobic endurance in middle-aged adults (A) At baseline and end-of-study visits, maximum strength values were calculated as the mean of the five peak torque scores (five reciprocal concentric isokinetic contractions with maximum effort) in nm for hamstring and as the one maximum score in nm for knee flexion. (B) UA significantly improved hamstring leg muscle strength at both doses (p = 0.027 compared with placebo for 500 mg UA dose; p = 0.029 compared with placebo for 1,000 mg dose). (C) Hand-grip strength was evaluated via hand-held dynamometry (5.1% improvement from baseline in 1,000 mg UA dose, p = 0.08). (D) UA 1,000 mg supplementation led to significant within-group (p < 0.01; p = 0.058 compared with placebo) increases in peak VO2. (E) UA-supplemented groups showed non-significant increases of ∼4% increase in peak power output from baseline. (F) UA 1,000 mg dose group showed a significant within-group increase from baseline in walking distance during the 6MWT at the end-of-study visit (p ≤ 0.008).
Figure 3
Figure 3
Effect of Urolithin A on systemic biomarkers of mitochondrial health and inflammation (A) Dose-dependent increase in plasma UA (left), UA-glucuronide (middle), and UA-sulfate (right) plasma levels comparing baseline with the last day of the 4-month treatment period for placebo, UA 500 mg, and UA 1,000 mg doses (n = 27, placebo and UA 500 mg; n = 25, UA 1,000 mg). Data represent mean ± SEM. ∗p < 0.0001, after one-way ANOVA. (B) Change in plasma levels of acylcarnitines comparing end of treatment with baseline (n = 27, placebo and UA 500 mg; n = 25, UA 1,000 mg; biologically independent samples). Data represent geometric mean ± 95% confidence interval. #0.05 < p < 0.15; ∗p < 0.05; after a two-way, repeated-measures ANOVA. (C) Ratio of plasma levels of C-reactive protein (CRP) comparing end of treatment with baseline (n = 27, placebo; n = 26, UA 500 mg; n = 25, UA 1,000 mg; biologically independent samples). Data represent mean ± 95% confidence interval. ∗p < 0.05, after an ANCOVA model. (D) Effect of UA 500 or UA 1,000 mg versus placebo on change to baseline plasma levels of the indicated cytokines (log10-transformed data). ∗p < 0.05, after an ANCOVA model.
Figure 4
Figure 4
Impact of Urolithin A intake on human skeletal muscle transcriptome (A) Venn diagram summarizing gene set enrichment analysis (GSEA) results from RNA-seq data in vastus lateralis skeletal muscle. Data represent gene sets upregulated with an adjusted p value <0.1 in subjects treated with placebo or with UA at 500 and 1,000 mg for 4 months compared with baseline. (B–D) GSEA plots of the three most significant Gene Ontology (GO) pathways significantly enriched specifically in UA 500 mg group: GO_Mitochondrial protein complex (B), GO_Cytosolic Ribosome (C), and GO_Contractile fiber (D). Significant gene sets for the placebo group were filtered out to identify treatment-specific pathways. NES, normalized enriched score.
Figure 5
Figure 5
Urolithin A confers a proteomic signature of improved mitochondrial metabolism and mitophagy in human skeletal muscle (A) Venn diagram summarizing pathway enrichment analysis results from proteomics data in vastus lateralis skeletal muscle. Data represent upregulated pathways with an adjusted p value <0.1 in subjects treated with placebo or with UA at 500 and 1,000 mg for 4 months compared with baseline. (B and C) Dot plots showing top enriched pathways (WikiPathways 2019 Human), ranked by protein ratio, in the UA 500- (B) and UA 1,000 mg (C) groups from (A). Dot color and size indicate adjusted p value and protein count, respectively. Significant pathways for the placebo group were filtered out to identify treatment-specific pathways. (D) Western blot analysis of protein lysates from vastus lateralis skeletal-muscle biopsies in subjects treated as above. For each subject, both baseline (Pre) and end-of-the-treatment (Post) samples were run, and membranes were probed for phospho-Parkin, total Parkin, and the mitochondrial proteins ATP5A (belonging to the OXPHOS complex V), UQCRC2 (complex IV), SDHB (complex II), and NDUFB8 (complex I). Tubulin and VDAC were included as markers of total and mitochondrial protein abundance, respectively. Dashed line separates samples from individual subjects. (n = 6 Pre and Post, biologically independent samples). (E) Quantification of phospho-Parkin over Tubulin protein intensity from western blots (WBs) in (D) (n = 6). Two-sided, paired t-test. (F) Quantification of NDUFB8 (left) and SDHB (right) protein intensity, normalized over VDAC from WBs in (D) (n = 6). ∗p < 0.05; ∗∗p < 0.01; two-sided, paired t test.

Similar articles

Cited by

References

    1. Denison H.J., Cooper C., Sayer A.A., Aihie Sayer A., Robinson S.M. Prevention and optimal management of sarcopenia: a review of combined exercise and nutrition interventions to improve muscle outcomes in older people. Clin. Interventions Aging. 2015;10:859–869. doi: 10.2147/cia.s55842. https://www.dovepress.com/prevention-and-optimal-management-of-sarcopeni... - DOI - PMC - PubMed
    1. Kwak J.Y., Kwon K.-S. Pharmacological interventions for treatment of sarcopenia: current status of drug development for sarcopenia. Ann. Geriatr. Med. Res. 2019;23:98–104. doi: 10.4235/agmr.19.0028. - DOI - PMC - PubMed
    1. Siparsky P.N., Kirkendall D.T., Garrett W.E. Muscle changes in aging. Sports Health. 2014;6:36–40. doi: 10.1177/1941738113502296. - DOI - PMC - PubMed
    1. Goodpaster B.H., Park S.W., Harris T.B., Kritchevsky S.B., Nevitt M., Schwartz A.V., Simonsick E.M., Tylavsky F.A., Visser M., Newman A.B., for the Health ABC Study The loss of skeletal muscle strength, mass, and quality in older adults: the health, aging and body composition study. J. Gerontol. Ser. A. 2006;61:1059–1064. doi: 10.1093/gerona/61.10.1059. - DOI - PubMed
    1. Di Lorito C., Long A., Byrne A., Harwood R.H., Gladman J.R., Schneider S., Logan P., Bosco A., van der Wardt V. Exercise interventions for older adults: a systematic review of meta-analyses. J. Sport Health Sci. 2021;10:29–47. doi: 10.1016/j.jshs.2020.06.003. - DOI - PMC - PubMed

Publication types

Associated data