. 2022 May 17;3(5):100620.
doi: 10.1016/j.xcrm.2022.100620. Epub 2022 Apr 27.

Distinct phenotypic states and spatial distribution of CD8+ T cell clonotypes in human brain metastases

Affiliations

Distinct phenotypic states and spatial distribution of CD8+ T cell clonotypes in human brain metastases

Lisa J Sudmeier et al. Cell Rep Med. .

Abstract

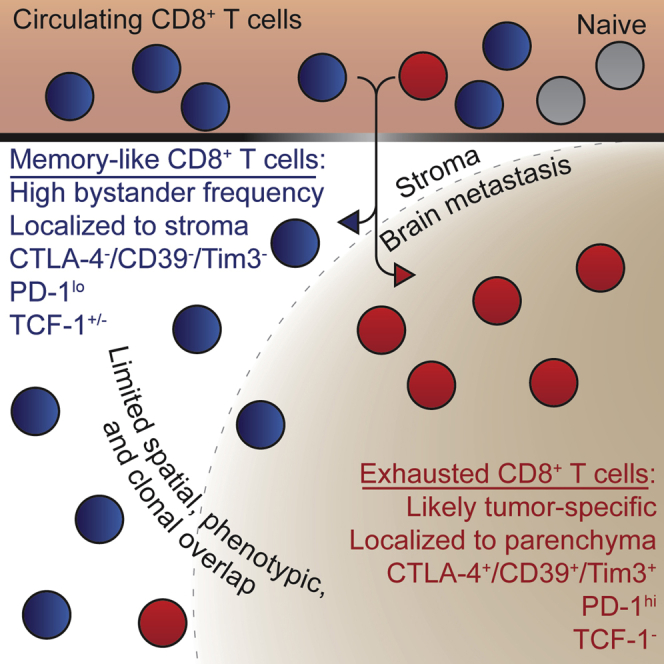
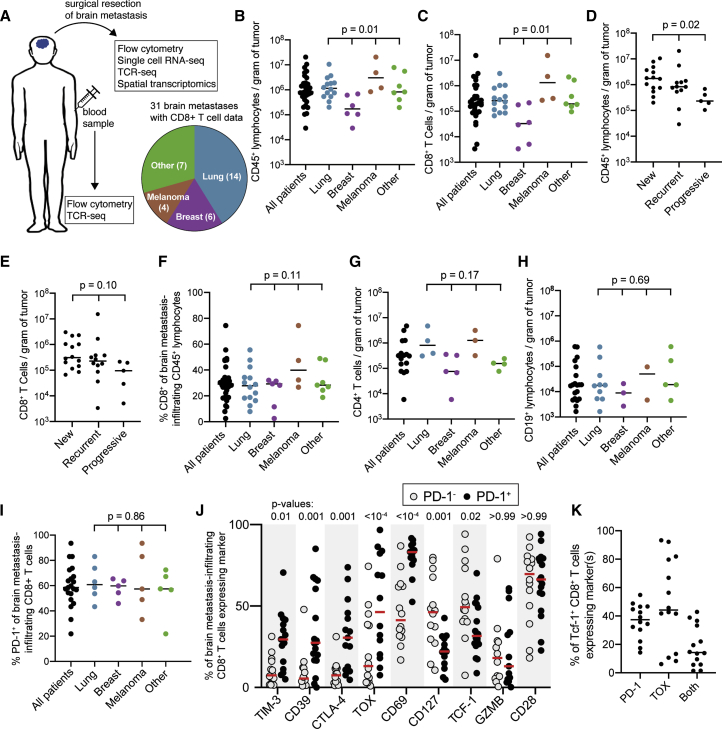
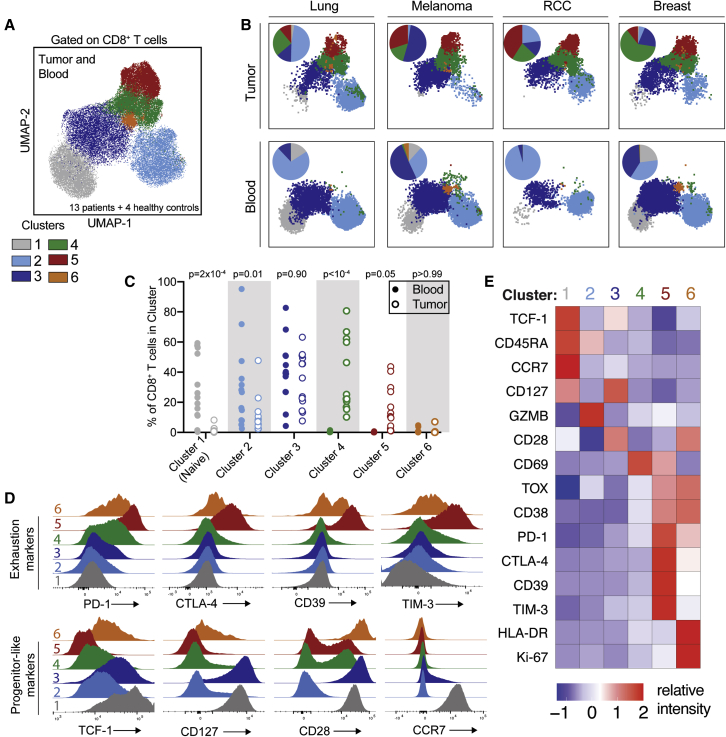
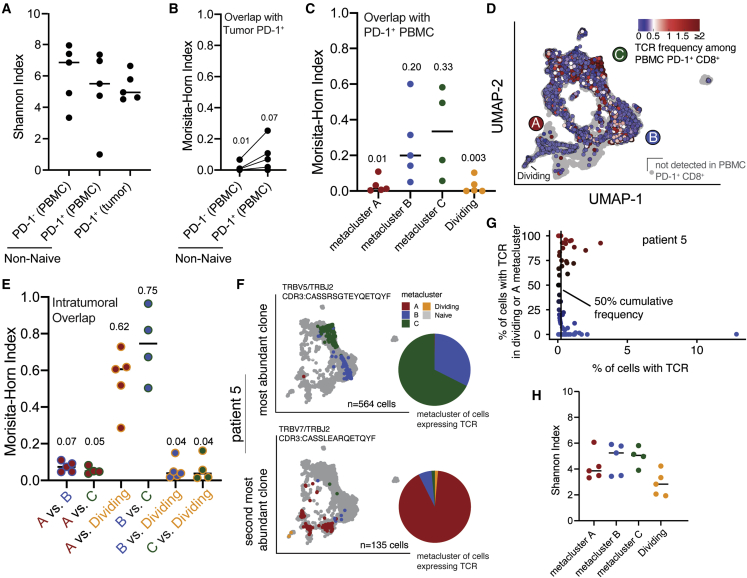
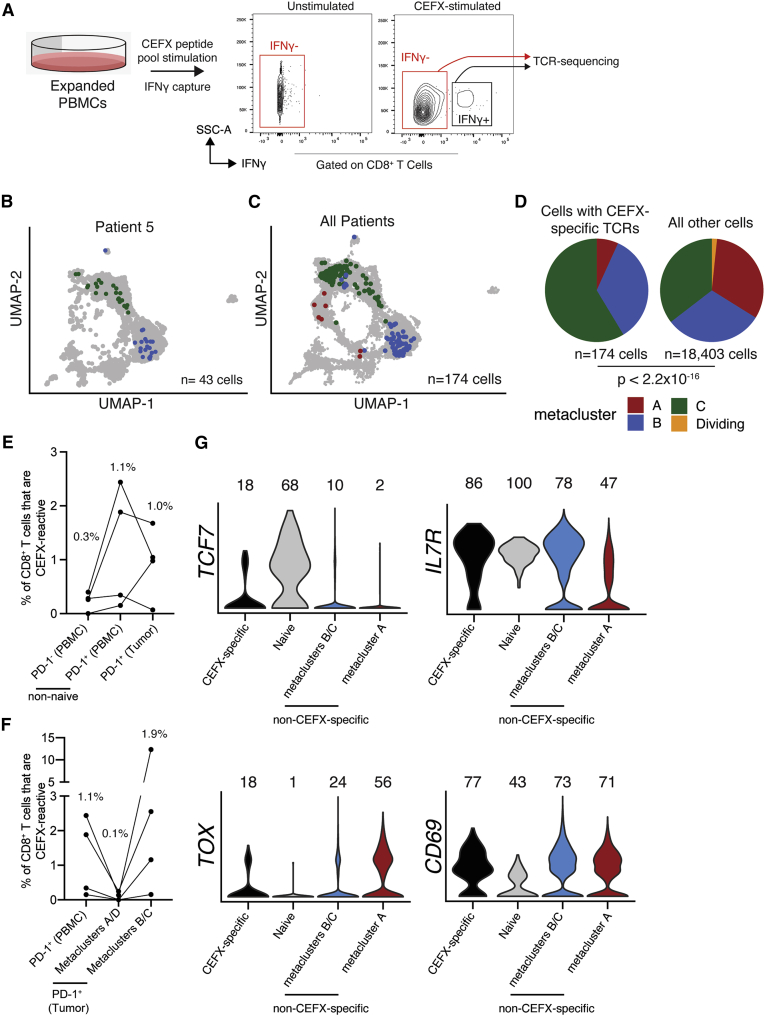
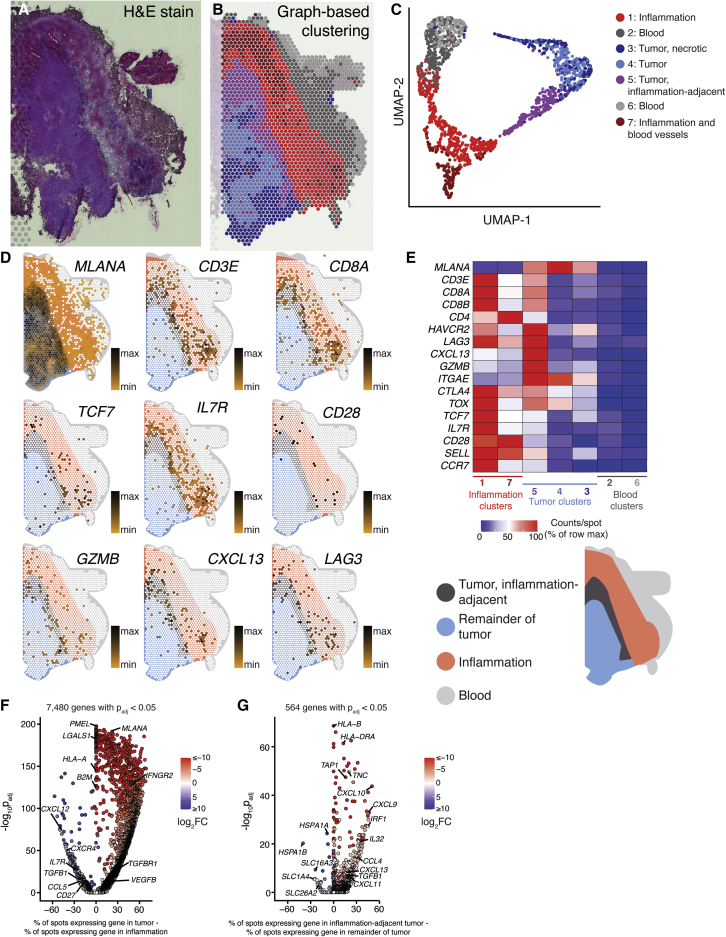
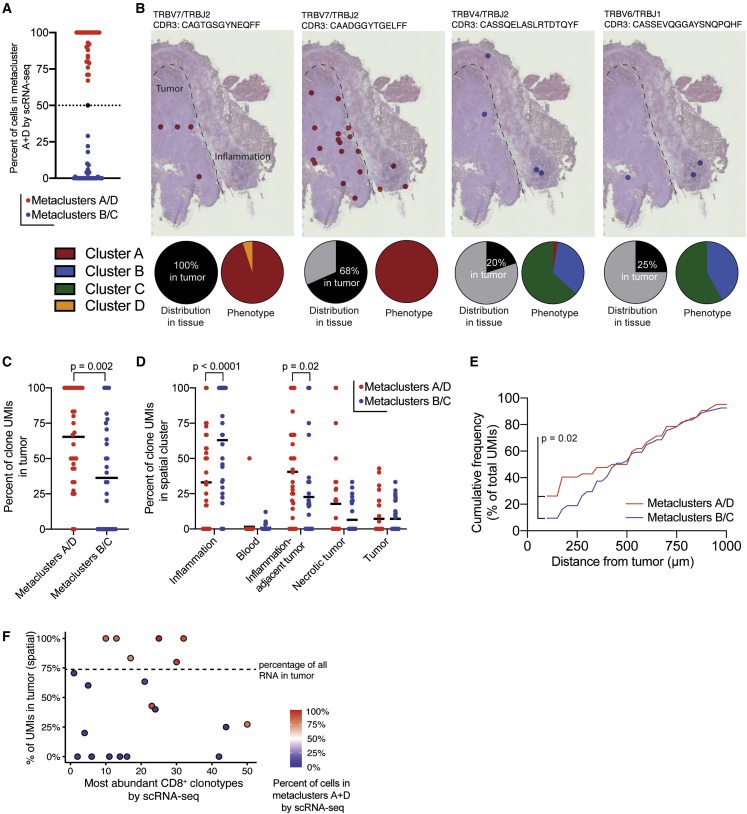
Metastatic disease in the brain is difficult to control and predicts poor prognosis. Here, we analyze human brain metastases and demonstrate their robust infiltration by CD8+ T cell subsets with distinct antigen specificities, phenotypic states, and spatial localization within the tumor microenvironment. Brain metastases are densely infiltrated by T cells; the majority of infiltrating CD8+ T cells express PD-1. Single-cell RNA sequencing shows significant clonal overlap between proliferating and exhausted CD8+ T cells, but these subsets have minimal clonal overlap with circulating and other tumor-infiltrating CD8+ T cells, including bystander CD8+ T cells specific for microbial antigens. Using spatial transcriptomics and spatial T cell receptor (TCR) sequencing, we show these clonally unrelated, phenotypically distinct CD8+ T cell populations occupy discrete niches within the brain metastasis tumor microenvironment. Together, our work identifies signaling pathways within CD8+ T cells and in their surrounding environment that may be targeted for immunotherapy of brain metastases.

Keywords: CD8(+) T cells; TCR-sequencing; brain metastases; bystander; exhaustion; spatial transcriptomics.


Conflict of interest statement

Declaration of interests R.A. holds patents related to the PD-1 pathway. All other authors declare no competing interests.

Figures

None
Graphical abstract
Figure 1
Figure 1
Human brain metastases are well infiltrated by PD-1+ CD8+ T cells (A) Experimental schema and distribution of samples among primary tumor histologies. (B and C) Density of CD45+ lymphocytes (B) and CD8+ T cells (C) for all 31 brain metastases grouped by primary tumor type. (D and E) Density of CD45+ lymphocytes (D) and CD8+ T cells (E) for all 31 brain metastases grouped by patient disease status at time of tumor resection. (F) Frequency of CD8+ cells among lymphocytes grouped by tumor type for all 31 patients. (G and H) Density of CD4+ T cells (G) and B cells (H) for 20 and 16 of the tumors, respectively. (I) Percentage of CD8+ T cells expressing PD-1 in 21 tumors. (J) Phenotype of PD-1- versus PD-1+ CD8+ T cells within brain metastases (n = 12–14 for each marker). (K) Percentage of tumor-infiltrating TCF-1+ CD8+ T cells expressing PD-1, TOX, or both (n = 14). Bars on graphs indicate median. In (B)–(E) and (G), statistics show variance among primary tumor types with the Kruskal-Wallis test. In (F), (H), and (I), statistics show one-way ANOVA. In (J), statistics show a mixed-effects model analysis with Sidak’s multiple comparisons test. See also Figure S1.
Figure 2
Figure 2
Spectral flow cytometry reveals that brain metastases are infiltrated by CD8+ T cells that are phenotypically distinct from circulating CD8+ T cells (A) Uniform manifold approximation and projections (UMAPs) of high-parameter flow-cytometry data gated on CD8+ T cells from 13 brain metastases, patient-matched blood, and blood from four healthy controls. Cells are colored by FlowSOM cluster. (B) UMAPs of CD8+ T cells from four individual patients (renal cell carcinoma [RCC]). Tumor-infiltrating and circulating CD8+ T cells are shown in the top and bottom rows, respectively. Inlaid pie charts show percentage of cells in each FlowSOM cluster. (C) Percentage of CD8+ T cells in each cluster is shown for each patient’s blood and tumor sample. (D) Expression of selected markers in each CD8+ T cell cluster. (E) Relative intensity of each indicated marker within each flow cluster. Statistics in (C) show differences between blood and tumor frequency by two-way ANOVA with Sidak’s multiple comparisons test. See also Figure S2.
Figure 3
Figure 3
Transitory and terminally differentiated PD-1+ CD8+ T cells infiltrate human brain metastases (A) UMAPs of all 22,828 PD-1+ CD8+ T cells sorted from 5 brain metastases and naive cells sorted from patient-matched blood samples. Hierarchical clustering is shown at right. (B) Distribution of each patient’s PD-1+ CD8+ T cells among metaclusters. (C) Distribution of PD-1+ CD8+ T cells among metaclusters for each primary tumor type. (D) Phenotype of PD-1+ CD8+ T cells from brain metastasis and matched circulating naive cells for each patient. (E) Expression of selected genes in each metacluster. Numbers above each violin indicate the percentage of cells in each metacluster expressing the gene. (F) Expression of selected genes projected on UMAP. (G) Relative expression of selected genes in each metacluster. See also Figures S3 and S4.
Figure 4
Figure 4
Dividing and terminally differentiated CD8+ T cells are clonally related to each other but not to other PD-1+ brain-metastasis-infiltrating or circulating CD8+ T cells (A) TCR diversity of circulating and brain-metastasis-infiltrating CD8+ T cells from the same 5 patients shown in Figure 3. (B) Quantification of TCR overlap between tumor-infiltrating PD-1+ CD8+ T cells with circulating PD-1- and PD-1+ cells from individual patients. (C) Quantification of TCR overlap between circulating PD-1+ CD8+ T cells and tumor-infiltrating PD-1+ CD8+ T cells within each metacluster. (D) UMAPs colored by frequency of each cell’s TCR among circulating PD-1+ CD8+ T cells. (E) Quantification of TCR overlap between PD-1+ CD8+ T cells within each brain-metastasis-infiltrating metacluster. (F) UMAP of cells from the most abundant (top) and second most abundant (bottom) TCR clonotype in patient 5, colored according to metacluster. Gray dots represent all other cells from the patient. Pie charts show distribution among metaclusters of cells expressing the TCR. (G) Distribution in phenotype of all clones detected among brain-metastasis-infiltrating PD-1+ CD8+ T cells from patient 5. Vertical line indicates 50% cumulative frequency of TCR clones. (F and G) Four other patients are shown in Figure S6. (H) TCR diversity of intratumoral metaclusters. In (A), (C), (E), and (G), lines indicate the median. See also Figure S5.
Figure 5
Figure 5
Microbe-specific CD8+ T cells are present in human brain metastases and are enriched in metaclusters B/C (A) We performed IFNγ capture on expanded, CEFX-stimulated PBMCs and subsequently sorted IFNγ- and IFNγ+ CD8+ T cells for TCR sequencing to identify CEFX-specific TCRs from 4 of the 5 patients from whom we had scRNAseq data. (B and C) Brain-metastasis-infiltrating PD-1+ CD8+ T cells with CEFX-specific TCRs colored by phenotype on the UMAP for patient 5 (B) and all patients (C). (D) scRNA-seq phenotype of CEFX-specific (left) and all other (right) brain-metastasis-infiltrating PD-1+ CD8+ T cells from all four patients. (E) Frequency of CEFX-specific cells among circulating and tumor-infiltrating CD8+ T cells. (F) Frequency of CEFX-specific cells among circulating PD-1+ CD8+ T cells and tumor-infiltrating PD-1+ CD8+ T cell subsets. (G) Expression of selected genes by CEFX-specific brain-metastasis-infiltrating PD-1+ CD8+ T cells and all remaining cells by metacluster. In (E) and (F), medians are shown above each column. In (G), numbers indicate percentage of cells with measurable expression of the indicated marker. p value in (D) was calculated by Fisher’s exact test. See also Figures S6 and S7.
Figure 6
Figure 6
Genes associated with the terminally differentiated CD8+ T cell phenotype are preferentially expressed within the tumor parenchyma of a melanoma brain metastasis (A) Hematoxylin-and-eosin-stained section of a melanoma brain metastasis (patient 16). (B) Spatial location of capture spots, colored by transcriptional cluster. (C) UMAP and clustering of capture areas by transcriptional phenotype. (D) Expression of selected genes within the tissue section. White indicates no detection of the indicated gene in a given capture area. A spatial legend is given at bottom right. (E) Normalized expression density of selected genes in each tissue cluster. (F) Gene-expression differences between tumor (clusters 3, 4, and 5) and peritumoral inflammation (clusters 1 and 7). (G) Differential gene expression between inflammation-adjacent tumor (cluster 5) and the remainder of tumor (clusters 3 and 4). See also Figures S8–S14.
Figure 7
Figure 7
CD8+ T cell phenotype dictates location in the tumor microenvironment (A) scRNA-seq phenotype of brain-metastasis-infiltrating PD-1+ CD8+ T cells expressing TCRs identified by spatial transcriptomics in patient 16. Each dot represents one TCR clone identified in both scRNA-seq and spatial-transcriptomics data. For subsequent analysis, TCR clones were classified as metacluster A/D clones (red) or metacluster B/C clones (blue) based on the scRNA-seq phenotype of cells expressing the clone. (B) Spatial location of selected TCR clones within tissue from patient 16. Each dot represents a capture area in which at least one unique molecular identifier (UMI) for the indicated clone was found. Pie charts indicate the percentage of UMIs found in the tumor parenchyma (left) and the percentage of cells expressing the indicated TCR in each scRNA-seq metacluster (right). (C) Spatial distribution of UMIs from metacluster A/D and B/C clones in the tissue section shown in (B). Each dot is a single TCR clone. (D) Distribution of TCR UMIs in tissue clusters from patient 16 identified by spatial transcriptomics (Figure 6B). (E) Cumulative frequency of UMIs outside the tumor parenchyma as a function of distance from the tumor border. (F) Tumor localization of most frequent clones. Lower numbers indicate more expanded clones. TCRs not identified within the tissue section are not shown. Dashed line indicates the percentage of all gene expression UMIs found in tumor regions. The p value in (C) was calculated by Mann-Whitney test. p values in (D) were calculated by two-way ANOVA with Sidak’s multiple comparisons test. The p value in (E) was calculated by the Kolmogorov-Smirnov test. See also Figure S10.

References

    1. Forrester J.V., McMenamin P.G., Dando S.J. CNS infection and immune privilege. Nat. Rev. Neurosci. 2018;19:655–671. - PubMed
    1. Arvanitis C.D., Ferraro G.B., Jain R.K. The blood–brain barrier and blood–tumour barrier in brain tumours and metastases. Nat. Rev. Cancer. 2020;20:26–41. - PMC - PubMed
    1. Nduom E.K., Yang C., Merrill M.J., Zhuang Z., Lonser R.R. Characterization of the blood-brain barrier of metastatic and primary malignant neoplasms. J. Neurosurg. 2013;119:427–433. - PMC - PubMed
    1. Berghoff A.S., Fuchs E., Ricken G., Mlecnik B., Bindea G., Spanberger T., Hackl M., Widhalm G., Dieckmann K., Prayer D., et al. Density of tumor-infiltrating lymphocytes correlates with extent of brain edema and overall survival time in patients with brain metastases. Oncoimmunology. 2016;5:e1057388. - PMC - PubMed
    1. Duchnowska R., Pęksa R., Radecka B., Mandat T., Trojanowski T., Jarosz B., Czartoryska-Arłukowicz B., Olszewski W.P., Och W., Kalinka-Warzocha E., et al. Immune response in breast cancer brain metastases and their microenvironment: the role of the PD-1/PD-L axis. Breast Cancer Res. 2016;18:43. - PMC - PubMed

Publication types

Substances