. 2022 May 17;3(5):100621.
doi: 10.1016/j.xcrm.2022.100621. Epub 2022 Apr 27.

Transcriptional profiling of macrophages in situ in metastatic melanoma reveals localization-dependent phenotypes and function

Affiliations

Transcriptional profiling of macrophages in situ in metastatic melanoma reveals localization-dependent phenotypes and function

Jan Martinek et al. Cell Rep Med. .

Abstract

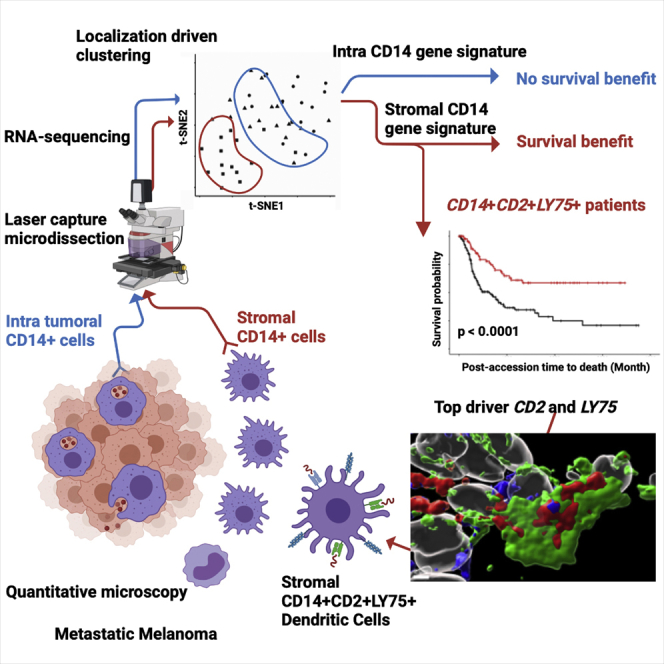
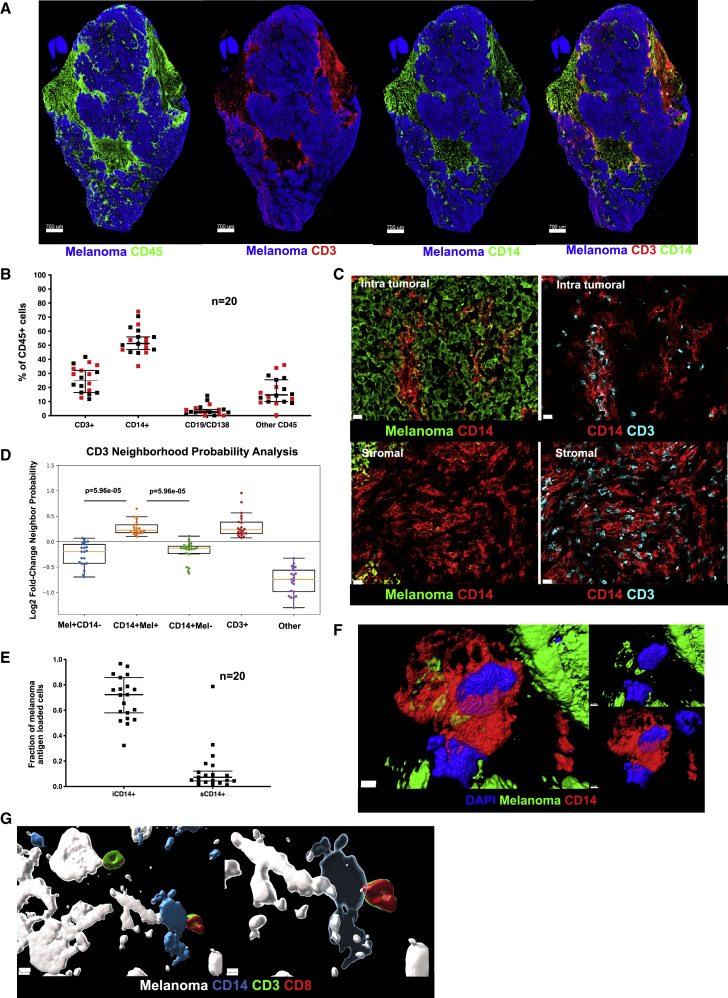
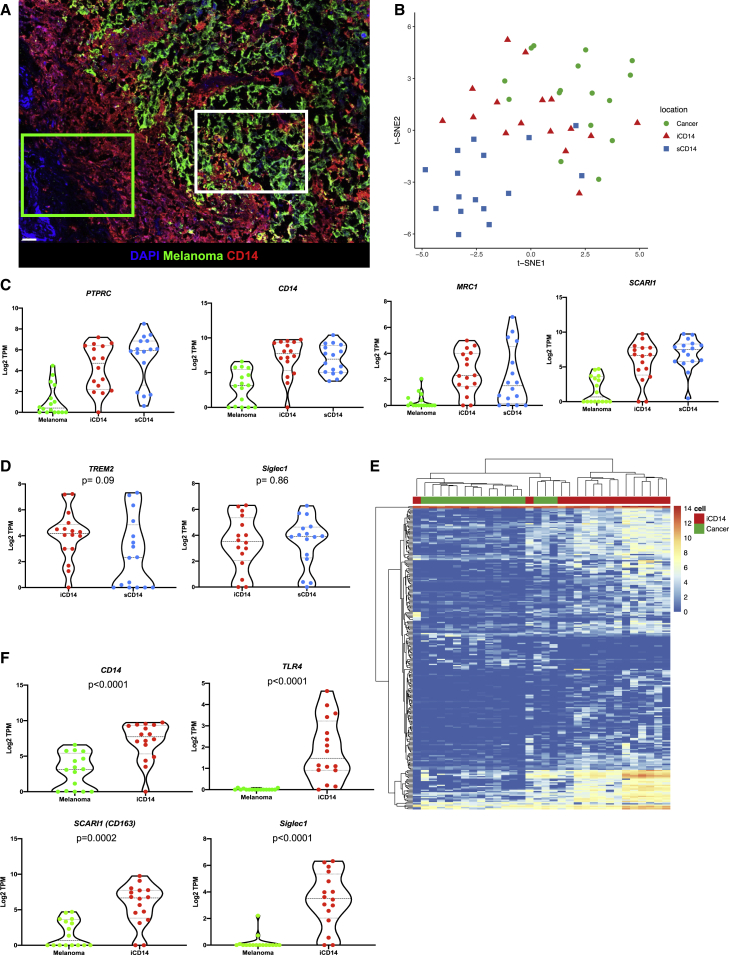
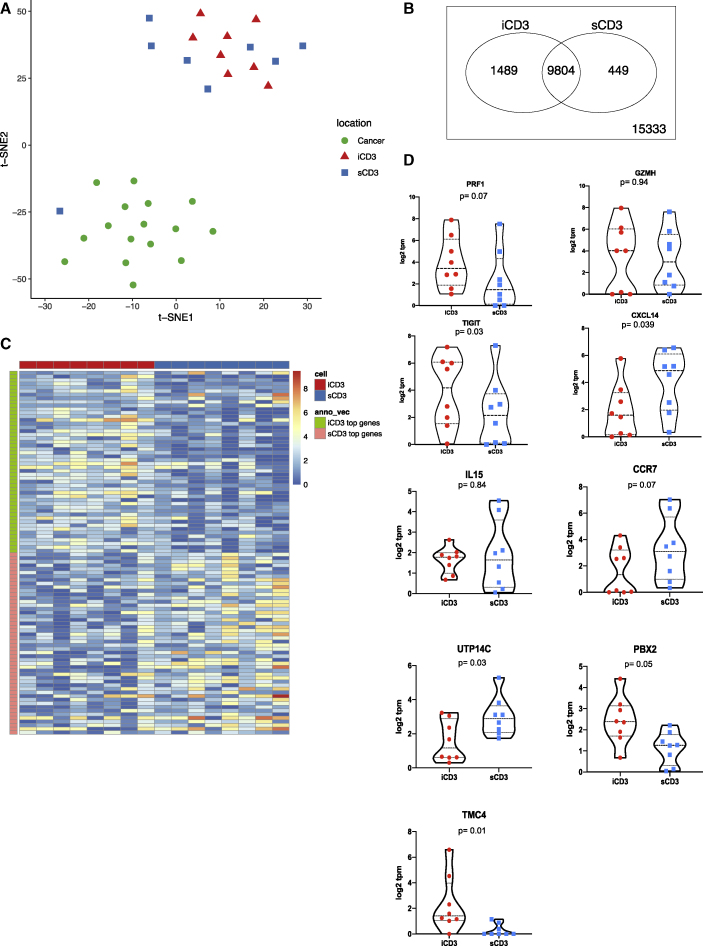
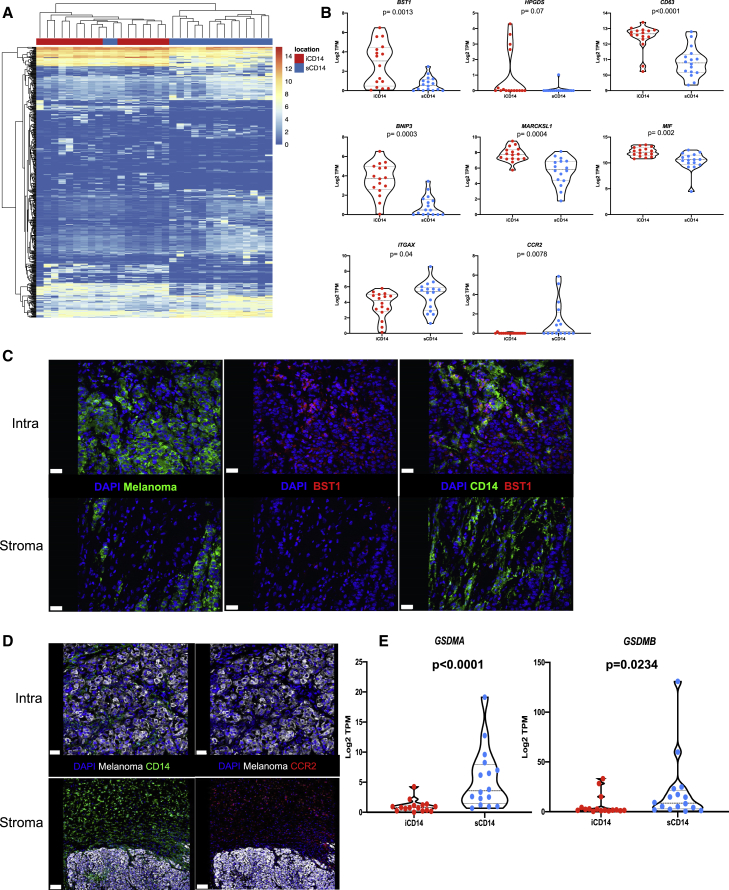
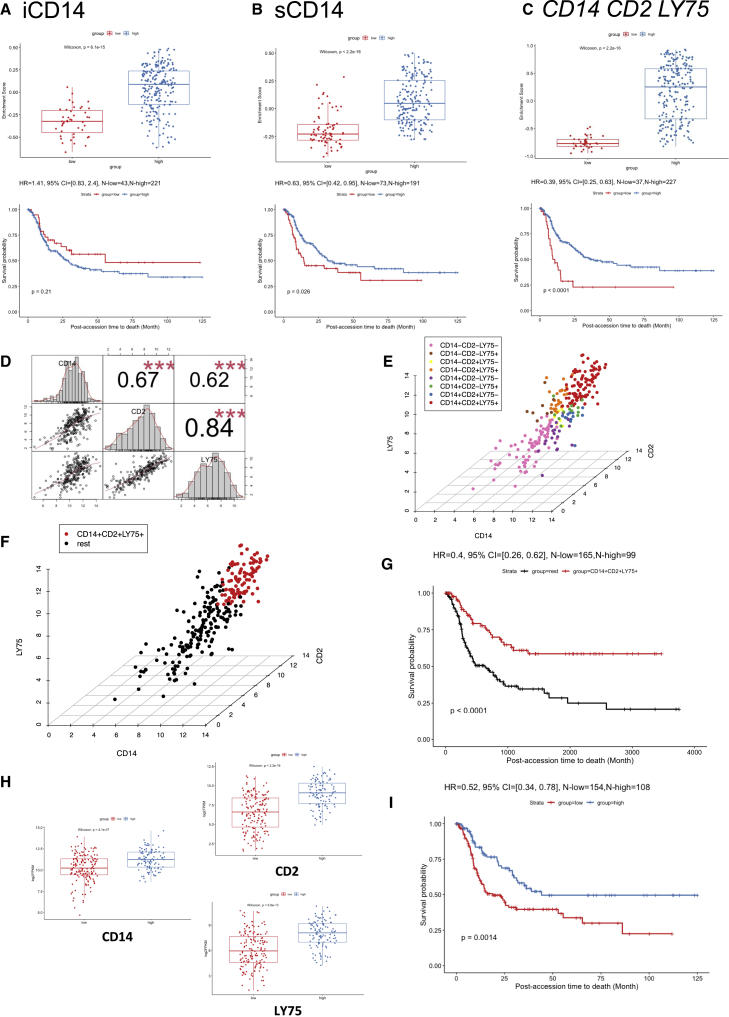
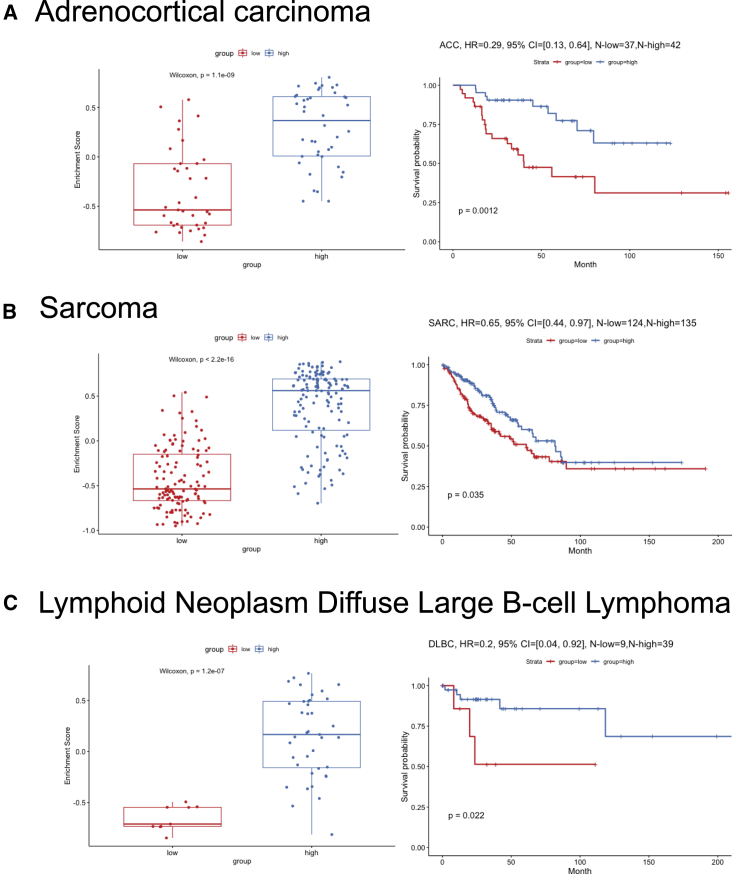
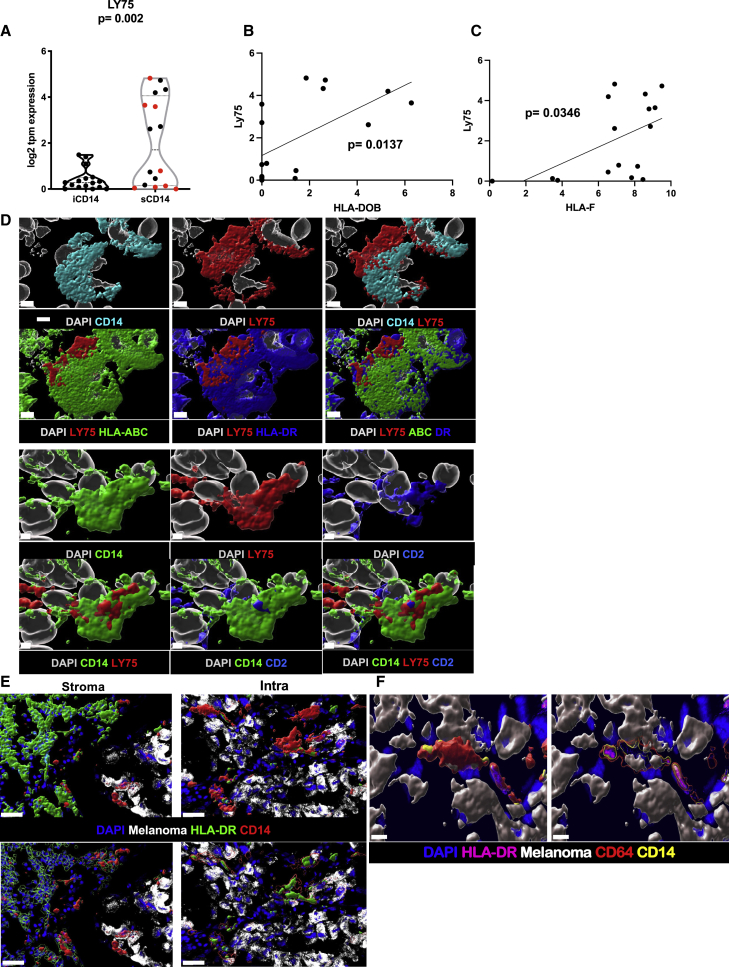
Modulation of immune function at the tumor site could improve patient outcomes. Here, we analyze patient samples of metastatic melanoma, a tumor responsive to T cell-based therapies, and find that tumor-infiltrating T cells are primarily juxtaposed to CD14+ monocytes/macrophages rather than melanoma cells. Using immunofluorescence-guided laser capture microdissection, we analyze transcriptomes of CD3+ T cells, CD14 + monocytes/macrophages, and melanoma cells in non-dissociated tissue. Stromal CD14+ cells display a specific transcriptional signature distinct from CD14+ cells within tumor nests. This signature contains LY75, a gene linked with antigen capture and regulation of tolerance and immunity in dendritic cells (DCs). When applied to TCGA cohorts, this gene set can distinguish patients with significantly prolonged survival in metastatic cutaneous melanoma and other cancers. Thus, the stromal CD14+ cell signature represents a candidate biomarker and suggests that reprogramming of stromal macrophages to acquire DC function may offer a therapeutic opportunity for metastatic cancers.

Keywords: CD205; DEC-205; LY75; dendritic cells; macrophage; melanoma; myeloid infiltrate; spatial analysis; spatial tissue organization; transcriptomics.


Conflict of interest statement

Declaration of interests K.P. serves as advisory board member and a shareholder for Cue Biopharma, Inc., Cambridge, MA. J.B.: While this work was performed and the manuscript was being prepared, J.B. served on the board of directors (BOD) for Neovacs; served on the scientific advisory board (SAB) for Georgiamune LLC; served as a BOD member and a stock holder for Ascend Biopharmaceuticals; SAB member and a stock holder for Cue Biopharma; and a stock holder for Sanofi. J.B. joined Immunai in New York as their new chief scientific officer in August 2021 and is also continuing a limited affiliation with JAX until end of March 2022. R.F. is scientific advisor of EvolveImmune (an immuno oncology company), Zai labs, and GlaxoSmithKline. All additional authors declare no competing interests.

Figures

None
Graphical abstract
Figure 1
Figure 1
Cellular maps of metastatic melanoma tumors (A) Example of melanoma whole section scan. From left to right: melanoma antigens (blue) and CD45 (green); or CD3 (red); or CD14 (green); or CD3 (red) and CD14 (green). Scale bar, 700 μm. (B) Composition of CD45+ infiltrate in metastatic melanoma by histocytometry. Each square represents a different sample, bar indicates median value with 95% CI; red square represents tissues of non-lymphatic origin; n = 20. (C) Top two panels depict iCD14+ cells (red) within melanoma clusters (green), left panel and iCD14 cells in close contact with CD3+ T cells (cyan), right panel. Lower two panels depict sCD14+ cells (red) in stromal area, left panel, which are also in close contact with CD3+ T cells (cyan), right panel. Scale bar, 20μm. (D) Neighborhood probability analysis reveals proximity of CD3+ T cells with melanoma antigen-loaded CD14+ cells and other CD3+ T cells versus lower probability of proximity of CD3+ T cells with melanoma cells. CD3+ T cell proximity was determined with respect to melanoma cells (Mel+CD14), melanoma antigen-loaded CD14+ cells (CD14+Mel+), melanoma antigen-lacking CD14+ cells (CD14+Mel), other CD3+ T cells (CD3+), and other cell types (other). Log2FC greater than zero indicates increased likelihood of proximity; n = 20. Line at Median with 95% CI. (E) Ratio of CD14+ cells loaded with unprocessed melanoma antigen. Tumor-infiltrating iCD14+ cells have a significantly higher ratio compared with stromal sCD14+ cells. Each square represents a different sample, bar indicates median value with 95% CI; n = 20. (F) STED imaging of individual iCD14+ cells reveals intracytoplasmic localization of non-processed melanoma antigen. Surface rendering of DAPI (blue), CD14 (red) and melanoma antigen (green). Left panel shows overlay of all channels, top right panel shows CD14 vs DAPI; lower right panel shows DAPI versus melanoma antigen. Scale bar, 2 μm, n = 3. (G) STED imaging reveals melanoma cells (white) interacting with iCD14+ cells (blue), which are also in contact with a CD3+ (green) CD8+ (red) T cells. Left panel shows opaque surface rendering for all channels together; scale bar, 5 μm. Right panel shows transparent surface rendering for CD14 channel to allow visualization of intracytoplasmic melanoma antigen in iCD14+ cells and close interaction with CD3+CD8+ T cells. Scale bar, 3 μm, n = 4.
Figure 2
Figure 2
Transcriptional maps of CD14+ cells (A) Image of melanoma tissue stained for melanoma antigens (green) and CD14 (red), illustrating areas from which sCD14+ cells (green square) and iCD14+ cells (white square) are individually harvested by LCM; scale bar, 30 μm. (B) t-SNE plot of all iCD14+ (red triangles); sCD14+ (blue squares), and melanoma cells (green circles) harvested by LCM. Genes with raw read count >100 are used in the t-SNE algorithm. The plot shows that cells are clustered based on tissue localization rather than by a cell lineage or by a sample, harvest on eight different samples in duplicate. (C) Violin plots of gene expression for monocyte/macrophage genes PTPRC, CD14, SCARI1, MRC1 across all samples harvested by LCM. Gene expression is calculated in log2 TPM value. Line at median with 95% CI. (D) Violin plots of gene expression for tissue residency genes TREM2 and SIGLEC1 across all iCD14 and sCD14+ cells harvested by LCM. Gene expression is calculated in log2 TPM value. Line at median with 95% CI. Wilcoxon paired test. (E) Unsupervised hierarchical clustering based on DEGs between all iCD14 up-regulated genes across all iCD14 and melanoma cells, harvested by LCM. (F) Violin plots of gene expression for CD14, TLR4, SCARI1, and SIGLEC1 across all iCD14 and melanoma cells harvested by LCM. Gene expression is calculated in log2 TPM value. Line at median with 95% CI.
Figure 3
Figure 3
Transcriptional programs of intratumoral and stromal T cells (A) t-SNE plot of all iCD3+ T cells (red triangles); sCD3+ T cells (blue squares), and melanoma cells (green circles) harvested by LCM illustrates overlap of iCD3+ and sCD3+ cells. Genes with raw read count >100 are used in the t-SNE algorithm. (B) Venn diagram of expressed genes for iCD3+ and sCD3+ T cells. An expressed gene is defined as 75% quantile ≥1 TPM in the samples (PAL75). The plot shows 1,489 and 449 unique genes expressed by iCD3+ or by sCD3+ T cells, respectively. (C) Heatmap representing top 50 genes in iCD3+ T cells (green and red) and sCD3+ T cells (orange and blue) across all CD3+ T cells harvested by LCM. (D) Violin plots of gene expression for PRF1, GZMH, TIGIT, CXCL14, IL15, CCR7, UTP14C, PBX2, TMC4 across all iCD3 and sCD3+ T cells harvested by LCM. Gene expression is calculated in log2 TPM value. Line at median with 95% CI. Wilcoxon paired test.
Figure 4
Figure 4
Stromal signature of CD14+ cells (A) Unsupervised hierarchical clustering based on differentially expressed genes between iCD14+ cells (206 up-regulated genes) and sCD14+ cells (282 up-regulated genes); FC >2; FDR<0.05; 75% quantile ≥0.5 TPM. (B) Candidate DEGs and their expression across all iCD14+ and sCD14+ cells. Expression values are shown in log2 TPM. Line at median with 95% CI. Wilcoxon paired test. (C and D) Immunofluorescence staining of melanoma samples confirming expression pattern of DEGs at the protein level. C = BST1 protein staining (red) only expressed by iCD14+ cells (green, top right panel) compared with sCD14+ cells (green, lower right panel). Left top and lower panels shows localization of melanoma nest (green); scale bar, 30 μm. (D) CCR2 (red right top and lower panel) only expressed by sCD14+ cells (green lower left); scale bar, 100 μm, while iCD14+ cells (green top left) do not show CCR2 staining; scale bar, 30 μm. Representative images from whole tissue scan. (E) Violin plots of gene expression for GSDMA and GSDMB across all iCD14 and sCD14+ cells harvested by LCM. Gene expression is calculated in log2 TPM value. Line at median with 95% CI. Wilcoxon paired test.
Figure 5
Figure 5
Survival analysis in TCGA cohorts (A) Survival analysis of DEGs up-regulated in iCD14+ cells in curated TCGA metastatic melanoma cohort. The upper panel shows the boxplot of the gene set enrichment score of the two patient groups stratified by the expression level of DEGs up-regulated in iCD14+ cells (see details in STAR Methods). The patient group with higher and lower median gene set enrichment score is named as the “high” and “low” group, respectively. Nonparametric test p value is indicated in the boxplot. The lower panel shows the long-term survival curve for the two groups of patients in the TCGA metastatic melanoma cohort. The two groups do not have significantly different survival outcome, with p value = 0.21. The hazard ratio value, 95% confidence interval, and number of patients in the “high” and “low” groups are indicated in the plot. (B) Similar plot as (A), but for DEGs up-regulated in sCD14+ cells. The long-term survival curve for the two groups of patients in the TCGA metastatic melanoma cohort show significantly different survival outcome, with p value = 0.026 and hazard ratio = 0.63, where the group with “high” sCD14 gene set enrichment score has better survival outcome than the group with “low” sCD14 gene set enrichment score. (C) Similar plot as (A) but for three genes: CD14, CD2, and LY75. The long-term survival curve for the two groups of patients in the TCGA metastatic melanoma cohort show significantly different survival outcome, with p value < 0.0001 and hazard ratio = 0.39, where the group with “high” gene set enrichment score of CD14, CD2, and LY75 has better survival outcome than the group with “low” gene set enrichment score. (D) Correlation analysis of CD14, CD2, and LY75 in the TCGA metastatic melanoma cohort. The gene expression of CD14, CD2, and LY75 are in log2 FPKM values. The histograms of the expression distribution of each of the three genes, the pairwise scatterplots of any two of the three genes, and the Pearson’s correlation coefficient with p value of any two of the three genes are shown in the plot. Three red asterisks indicate the p value is less than 0.001. (E) 3D scatterplot of gene expression of CD14, CD2, and LY75 in the TCGA metastatic melanoma cohort. The x axis, y axis, and z axis indicate the log2 FPKM of CD14, CD2, and LY75, respectively. The mean expression value of CD14, CD2, and LY75 are used as the thresholds to define eight groups of patients (CD14+CD2+LY75+, CD14+CD2+LY75, CD14+CD2LY75+, CD14+CD2LY75, CD14CD2+LY75+, CD14CD2+LY75, CD14CD2LY75+, and CD14CD2LY75). The colors of the points indicate the group that a patient belongs to. (F) Similar plot as (E) but for CD14+CD2+LY75+ versus the rest of patients in the TCGA metastatic melanoma cohort. The CD14+CD2+LY75+ and the rest of the patients are highlighted by red and black, respectively. (G) The long-term survival curve for the two groups of patients defined in (F). The two groups have significantly different survival outcome with p value <0.0001. The hazard ratio value, 95% confidence interval, and number of patients in the CD14+CD2+LY75+ and “rest” groups are indicated in the plot. (H) Expression comparisons between low lymphocyte density group and high lymphocyte density group for CD14, CD2, and LY75, respectively. Nonparametric test p value is indicated in each plot. (I) The survival analysis between the low lymphocyte density group and the high lymphocyte density group, where the high group has better survival outcome than the low group with HR = 0.52 and p value = 0.0014.
Figure 6
Figure 6
Survival analysis of CD14, CD2, and LY75 in adrenocortical carcinoma, sarcoma, and DLBC (A) Survival analysis of CD14, CD2, and LY75 in TCGA adrenocortical carcinoma cohort. The left panel shows the boxplot of the gene set enrichment score of the two patient groups stratified by the expression level of CD14, CD2, and LY75 (see details in STAR Methods). The patient group with higher and lower median gene set enrichment score is named as the “high” and “low” group, respectively. Nonparametric test p value is indicated in the boxplot. The right panel shows the long-term survival curve for the two groups of patients in the TCGA adrenocortical carcinoma cohort. The two groups have significantly different survival outcome with p value = 0.0012. The hazard ratio value, 95% confidence interval, and number of patients in the “high” and “low” groups are indicated in the plot. (B) Similar plot as (A) but for TCGA sarcoma cohort. (C) Similar plot as (A) but for TCGA DLBC cohort.
Figure 7
Figure 7
Stromal CD14+ LY75+ cells (A) Violin plot of LY75 expression in iCD14+ and sCD14+ cells harvested by LCM. The y axis shows log2 of TPM value. sCD14+ cells have significantly higher expression compared with iCD14+ cells (t test; p = 0.002). Red dots indicate metastasis to non-lymphatic tissues. (B) Significantly positive correlation between LY75 and HLA-DOB expression in sCD14 cells (simple linear regression p = 0.0137). (C) Significantly positive correlation between LY75 and HLA-F expression in sCD14 cells (simple linear regression p =0.0346). (D) Surface rendering of high-resolution confocal microscopy. Top panel shows CD14 (cyan) co-expression with LY75 (red). CD14+/LY75+ cells also express HLA-ABC (green) and HLA-DR (blue). Nuclei shown in white; scale bar, 4 μm, n = 3. Lower panel showing CD14+ (green) cell, co-expressing LY75+ (red) is also CD2+ (blue). Nuclei shown in white. Scale bar, 2 μm, n = 3. (E) Comparison of HLA-DR cellular localization between cCD14 and iCD14+ cells. Top panel shows surface rendering for HLA-DR (green) and CD14 (red) signal along with melanoma (white) and DAPI (blue) staining. For sCD14+ cells, HLA-DR surface masks CD14 surface while in iCD14 it is the opposite. Lower panels HLA-DR (left) and CD14 (right) surfaces were rendered transparent to reveal the presence of masked signal. Together showing the difference in cellular localization for HLA-DR between iCD14+ and sCD14+ cells. Scale bar, 30 μm, n = 3. (F) Intracellular clustering of HLA-DR in iCD14 cells. Left panels represent intensity color-coded rendering of HLA-DR staining, surface rendering of CD64 (red); CD14 surface rendering (yellow); melanoma cells surface rendering (white); DAPI (blue). Right panel: same color scheme but CD64 and CD14 surfaces are transparent to reveal HLA-DR high-intensity signal in the form of cytoplasmic clusters, suggesting limited antigen presentation abilities for iCD14+ cells. Scale bar, 10 μm, n = 3.

Comment in

References

    1. Hodi F.S., O'Day S.J., McDermott D.F., Weber R.W., Sosman J.A., Haanen J.B., Gonzalez R., Robert C., Schadendorf D., Hassel J.C., et al. Improved survival with ipilimumab in patients with metastatic melanoma. N. Engl. J. Med. 2010;363:711–723. - PMC - PubMed
    1. Wolchok J.D., Chiarion-Sileni V., Gonzalez R., Rutkowski P., Grob J.J., Cowey C.L., Lao C.D., Wagstaff J., Schadendorf D., Ferrucci P.F., et al. Overall survival with combined nivolumab and ipilimumab in advanced melanoma. N. Engl. J. Med. 2017;377:1345–1356. - PMC - PubMed
    1. Larkin J., Chiarion-Sileni V., Gonzalez R., Grob J.J., Rutkowski P., Lao C.D., Cowey C.L., Schadendorf D., Wagstaff J., Dummer R., et al. Five-year survival with combined nivolumab and ipilimumab in advanced melanoma. N. Engl. J. Med. 2019;381:1535–1546. - PubMed
    1. Topalian S.L., Taube J.M., Anders R.A., Pardoll D.M. Mechanism-driven biomarkers to guide immune checkpoint blockade in cancer therapy. Nat. Rev. Cancer. 2016;16:275–287. - PMC - PubMed
    1. Merad M., Sathe P., Helft J., Miller J., Mortha A. The dendritic cell lineage: ontogeny and function of dendritic cells and their subsets in the steady state and the inflamed setting. Annu. Rev. Immunol. 2013;31:563–604. - PMC - PubMed

Publication types