. 2022 May 17;39(7):110756.
doi: 10.1016/j.celrep.2022.110756.

Choice-selective sequences dominate in cortical relative to thalamic inputs to NAc to support reinforcement learning

Affiliations

Choice-selective sequences dominate in cortical relative to thalamic inputs to NAc to support reinforcement learning

Nathan F Parker et al. Cell Rep. .

Abstract

How are actions linked with subsequent outcomes to guide choices? The nucleus accumbens, which is implicated in this process, receives glutamatergic inputs from the prelimbic cortex and midline regions of the thalamus. However, little is known about whether and how representations differ across these input pathways. By comparing these inputs during a reinforcement learning task in mice, we discovered that prelimbic cortical inputs preferentially represent actions and choices, whereas midline thalamic inputs preferentially represent cues. Choice-selective activity in the prelimbic cortical inputs is organized in sequences that persist beyond the outcome. Through computational modeling, we demonstrate that these sequences can support the neural implementation of reinforcement-learning algorithms, in both a circuit model based on synaptic plasticity and one based on neural dynamics. Finally, we test and confirm a prediction of our circuit models by direct manipulation of nucleus accumbens input neurons.

Keywords: CP: Neuroscience; circuit modeling; imaging; learning; nucleus accumbens; optogenetics; prelimbic; reinforcement learning; thalamus.


Conflict of interest statement

Declaration of interests The authors declare no competing interests.

Figures

Figure 1.
Figure 1.. Cellular-resolution imaging of PL and mTH neurons that project to the NAc in mice performing a reinforcement learning task
(A) Schematic of probabilistic reversal learning task. (B) Example behavior during a recording session. The choice of the mouse (black marks) follows the identity of the high-probability lever as it alternates between left and right (gray lines). (C) Left: probability the mice choose the left or right lever ten trials before and after a reversal from a left-to-right high-probability block. Right: same as left for right-to-left high-probability block reversals. (D) Mice had a significantly higher stay probability following a rewarded versus unrewarded trial (***p = 5 × 10 9, two-tailed t test, n = 16 mice). (E) Coefficients from a logistic regression that uses choice and outcome from the previous five trials to predict choice on the current trial. Positive regression coefficients indicate a greater likelihood of repeating the previous choice. (F) Left: surgical schematic for PL-NAc (top) and mTH-NAc (bottom) recordings showing the injection site and optical lens implant with miniature head-mounted microscope attached. Right: coronal section from a PL-NAc (top) and mTH-NAc (bottom) mouse showing GCaMP6f expression in the recording sites. Inset: confocal image showing GCaMP6f expression in individual neurons. (G) Left: example field of view from a recording in PL-NAc (top, blue) and mTH-NAc (bottom, orange) with five representative regions of interest (ROIs). Right, normalized GCaMP6f fluorescence traces from the five ROIs on the left. For visualization, each trace was normalized by the peak fluorescence across the hour-long session. Data in (C), (D), and (E) are presented as mean ± SEM across mice (n = 16).
Figure 2.
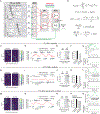
Figure 2.. PL-NAc preferentially represents action events while mTH-NAc preferentially represents the CS+
(A) Time-locked responses of individual PL-NAc (blue) and mTH-NAc (orange) neurons to task events. Data are presented as mean ± SEM across trials. (B) Kernels representing the response to each of the task events for an example neuron, generated from the encoding model. The predicted GCaMP trace is the sum of the individual response kernels (see STAR Methods). (C) Heatmap of response kernels generated from the encoding model for all PL-NAc neurons. Heatmap is ordered by the time of the peak response across all behavioral events (n = 278 neurons, n = 7 mice). (D) Same as (C) except the heatmap of response kernels is from mTH-NAc neurons (n = 256 neurons, n = 9 mice). (E) Heatmap of mean Z-scored GCaMP6f fluorescence from PL-NAc neurons aligned to the time of each event in the task. Neurons are ordered as in (C). (F) Same as (E) for mTH-NAc neurons. (G) Top row: fraction of neurons significantly modulated by action events in the PL-NAc (blue) and mTH-NAc (orange). For all action events, PL-NAc had a larger fraction of significantly modulated neurons than mTH-NAc. Bottom row: fraction of neurons in PL-NAc (blue) and mTH-NAc (orange) significantly modulated by stimulus events. Two out of three stimulus events had a larger fraction of significantly modulated neurons in mTH-NAc than in PL-NAc. Significance was determined using the linear model used to generate response kernels in (B) (STAR Methods). (H) Top: a significantly larger fraction of event-modulated PL-NAc neurons encode at least one action event (p = 0.0004: two-proportion Z test comparing fraction of action-modulated PL-NAc and mTH-NAc neurons). Bottom: a significantly larger fraction of mTH-NAc neurons encode a stimulus event (p = 0.002: two-proportion Z test comparing fraction of stimulus-modulated neurons between PL-NAc and mTH-NAc). Asterisk denotes p < 0.05. For (G) and (H), fractions are determined using the total number of neurons significantly modulated by at least one task event (n = 140 for PL-NAc, n = 90 for mTH-NAc).
Figure 3.
Figure 3.. PL-NAc preferentially represents choice but not outcome relative to mTH-NAc
(A) Fraction of choice-selective neurons in PL-NAc (n = 92 out of 278 neurons, 7 mice) and mTH-NAc (n = 42 out of 256 neurons, 9 mice). A significantly larger fraction of PL-NAc neurons was choice-selective compared with mTH-NAc neurons (p = 9.9 × 10 −6: two-proportion Z test). (B) Choice decoding accuracy using randomly selected subsets of simultaneously imaged neurons around the lever press. The PL-NAc population more accurately decoded the choice of the trial compared with mTH-NAc (*p < 0.05, unpaired two-tailed t test, n = 9 PL-NAc and 6 mTH-NAc mice, peak decoding accuracy of 72% ± 3% for PL-NAc and 60% ± 2% for mTH-NAc). (C) Fraction of outcome-selective neurons in mTH-NAc (n = 86 out of 256 neurons, 9 mice) and PL-NAc (n = 62 out of 278 neurons, 7 mice). A significantly larger fraction of mTH-NAc neurons were outcome-selective compared with PL-NAc neurons (p = 0.004: two-proportion Z test). (D) Outcome decoding accuracy using neural activity after the time of the CS from randomly selected, simultaneously imaged neurons in mTH-NAc (orange, peak decoding accuracy: 73% ± 2%) and PL-NAc (blue, peak decoding accuracy: 68% ± 1%). p > 0.05, unpaired two-tailed t test. Data in (B) and (D) are presented as mean ± SEM across mice; n = 6 PL-NAc mice and 9 mTH-NAc mice. In (A) and (C) the asterisk denotes p < 0.05, two-proportion Z test.
Figure 4.
Figure 4.. Choice-selective sequences in PL-NAc persist into the subsequent trial
(A) Top: average peak-normalized GCaMP6f fluorescence of three simultaneously imaged PL-NAc choice-selective neurons. Data are presented as mean ± SEM across trials. Bottom: heatmaps of GCaMP6f fluorescence across trials aligned to ipsilateral (blue) and contralateral (gray) press. (B and C) Heatmaps showing sequential activation of choice-selective PL-NAc neurons (n = 92/278 neurons from 7 mice). Each row is a neuron’s average GCaMP6f fluorescence time-locked to the ipsilateral (left column) and contralateral (right column) lever press, normalized by its peak average fluorescence. In (B) (“train data”), heatmap is average fluorescence from half of trials and ordered by the time of peak activity. In (C) (“test data”), the peak-normalized, time-locked GCaMP6f fluorescence from the other half of trials was plotted in the order from “train data” in (B). (D) Correlation between time of peak activity using the “train” and “test” trials for choice-selective PL-NAc neurons in response to a contralateral or ipsilateral lever press (R2 = 0.80, p = 5.3 × 10⁻²², n = 92 neurons). (E) Average decoding accuracy of choice on the current (blue), previous (gray), and next (black) trial as a function of time-adjusted GCaMP6f fluorescence throughout the current trial from ten simultaneously imaged PL-NAc neurons. Data are presented as mean ± SEM across mice. Red dashed line indicates median onset of reward consumption. *p < 0.01, two-tailed, one-sample t test across mice comparing decoding accuracy to chance, n = 6 mice.
Figure 5.
Figure 5.. Choice-selective sequences recorded in PL-NAc, combined with known downstream connectivity, can implement a temporal difference (TD) learning model based on synaptic plasticity
(A) Schematic of circuit architecture used in the model. Model implementation used single-trial recorded PL-NAc or mTH-NAc responses as input. See results and STAR Methods for model details and Figure S9 for alternative, mathematically equivalent circuit architectures. (B) Model equations. V: value; VL, VR: weighted sum of the nL left-choice- or nR right-choice-preferring NAc neuron activities fiL and fiR, respectively, with weights wiL or WiR; α: learning rate; τe: decay time constant for the PL-NAc synaptic eligibility trace E(t); Δ: delay of the pathway through the VTA GABA interneuron; γ: discounting of value during time Δ. (C) Heatmap of single-trial PL-NAc estimated firing rates input to the model. (D) Behavior of the synaptic plasticity model for 120 example trials. The decision variable (red trace) and the choice of the model (black dots) follow the identity of the higher probability lever. (E) Probability the model chooses left (black) and right (gray) following a left-to-right block reversal. (F) Stay probability of the synaptic plasticity model following rewarded and unrewarded trials. (G) Top: simulated VTA dopamine neuron activity averaged across rewarded (green) and unrewarded (gray) trials. Bottom: coefficients from a linear regression that uses outcome of the current and previous five trials to predict dopamine neuron activity following outcome feedback (STAR Methods). (H–L) Same as (C) to (G), instead showing results from using estimated firing rates from mTH-NAc single-trial activity. The mTH-NAc model input generates worse performance than using PL-NAc input, with less and slower modulation of the decision variables, and weaker modulation of dopamine activity by previous trial outcomes. Dashed line in (L) shows results from PL-NAc model (same data as in G). (M) Control model including only early-firing neurons active at the onset of the sequence, when the model makes the choice. (N–Q) Same as (D) to (G), instead showing results from using the early-only control model. Open bar in (P) and dashed line in (Q) show results from PL-NAc model (same data as in F and G).
Figure 6.
Figure 6.. Neural dynamics model, with recorded choice-selective PL-NAc activity input to the critic, performs the task similarly to synaptic plasticity model
(A) Model schematic. See results and STAR Methods for details. (B–E) Example behavior and dopamine activity from the neural dynamics model. Panel descriptions are the same as those for the synaptic plasticity model (Figures 5D–5G). (F) Reward rate as a function of the number of training episodes for the model with recorded PL-NAc input to the critic (orange) and for a model with persistent choice-selective input to the critic (black). Red arrow indicates the training duration used to generate all other figure panels. Gray dashed line indicates chance reward rate of 0.4. (G) Relationship between the decision variable used to select the choice on the next trial and the calculated RPE across right and left blocks. The RPE shown is an average of 0–2 s after lever press, averaged across blocks. The decision variable is also averaged across blocks. (H) Evolution of the principal components of the output of the actor LSTM units across trials within a right and left block. The displayed activity is from the first time point in each trial (when the choice is made), averaged across blocks. The first three components accounted for 70.9%, 16.6%, and 6.4% of the total variance at this time point, respectively. (I) Cosine of the angle between the actor network’s readout weight vector and the vectors corresponding to the first three principal components (PCs). Network activity in the PC1 direction (but not PC2 or PC3) aligns with the network readout weights. (J) Coefficients from a linear regression that uses choice on the previous trial (green), average RPE from 0–2 s after the lever press (red), and “choice × RPE” interaction (blue) from the previous seven trials to predict the amplitude of activity in PC1 on the current trial.
Figure 7.
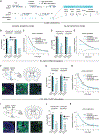
Figure 7.. Stimulation of PL-NAc neurons disrupts the influence of previous trial outcomes on subsequent choice in both the models and mice
(A) In the mice and models, PL-NAc neurons were stimulated for the whole trial on a random 10% of trials, disrupting the endogenous choice-selective sequential activity (see STAR Methods and Figure S13). (B) Effect of stimulating the PL-NAc input on the previous (left) or current (right) trial in the synaptic plasticity model. (C) Logistic choice regression showing dependence of the current choice on previously rewarded and unrewarded choices, with and without stimulation. Higher coefficients indicate a higher probability of staying with the previously chosen lever. (D and E) Same as (B) and (C) for the neural dynamics model. (F) Top left: schematic illustrating injection site in the PL (black needle) and optical fiber implant in the NAc core. Top right: location of optical fiber tips of PL-NAc ChR2 cohort (n = 14 mice) Bottom left: coronal section showing ChR2-YFP expression in PL. Bottom middle and right: ChR2-YFP expression in PL terminals in the NAc core. (G) Similar to the models, PL-NAc ChR2 stimulation on the previous trial significantly reduced the mice’s stay probability following a rewarded trial (p = 0.002) while increasing stay probability following an unrewarded trial (p = 0.0005). Stimulation on the current trial had no significant effect on stay probability following rewarded (p = 0.62) or unrewarded (p = 0.91) trials. All comparisons were paired two-tailed t tests, n = 14 mice. (H) PL-NAc ChR2 stimulation decreased the weight of rewarded choices one and two trials back (p = 0.002: one trial back; p = 0.023: two trials back) and increased the weight of unrewarded choices one trial back (p = 5.4 × 10⁻⁶). (I–K) Same as (F) to (H) for mTH-NAc ChR2 stimulation (n = 8 mice). mTH-NAc stimulation had no significant effect on stay probability following either rewarded (p = 0.85) or unrewarded choices (p = 0.40) on the previous trial back (J, paired t test, n = 8 mice) or multiple trials back (K, p > 0.05 for all trials back, one-sample t tests). Current-trial stimulation also had no effect following either rewarded (p = 0.59) or unrewarded (p = 0.50) choices. **p < 0.005 and *p < 0.05 for one-sample two-tailed t tests.

References

    1. Aggarwal M, Hyland BI, and Wickens JR (2012). Neural control of dopamine neurotransmission: implications for reinforcement learning. Eur. J. Neurosci 35, 1115–1123. - PubMed
    1. Akhlaghpour H, Wiskerke J, Choi JY, Taliaferro JP, Au J, and Witten IB (2016). Dissociated sequential activity and stimulus encoding in the dorsomedial striatum during spatial working memory. Elife 5, e19507. - PMC - PubMed
    1. Apicella P, Ljungberg T, Scarnati E, and Schultz W (1991). Responses to reward in monkey dorsal and ventral striatum. Exp. Brain Res 85, 491–500. - PubMed
    1. Asaad WF, Lauro PM, Perge JA, and Eskandar EN (2017). Prefrontal neurons encode a solution to the credit-assignment problem. J. Neurosci 37, 6995–7007. - PMC - PubMed
    1. Atallah HE, Lopez-Paniagua D, Rudy JW, and O’Reilly RC (2007). Separate neural substrates for skill learning and performance in the ventral and dorsal striatum. Nat. Neurosci 10, 126–131. - PubMed

Publication types