. 2022 May 17;39(7):110822.
doi: 10.1016/j.celrep.2022.110822.

Glutamate released by Cajal-Retzius cells impacts specific hippocampal circuits and behaviors

Affiliations

Glutamate released by Cajal-Retzius cells impacts specific hippocampal circuits and behaviors

Max Anstötz et al. Cell Rep. .

Abstract

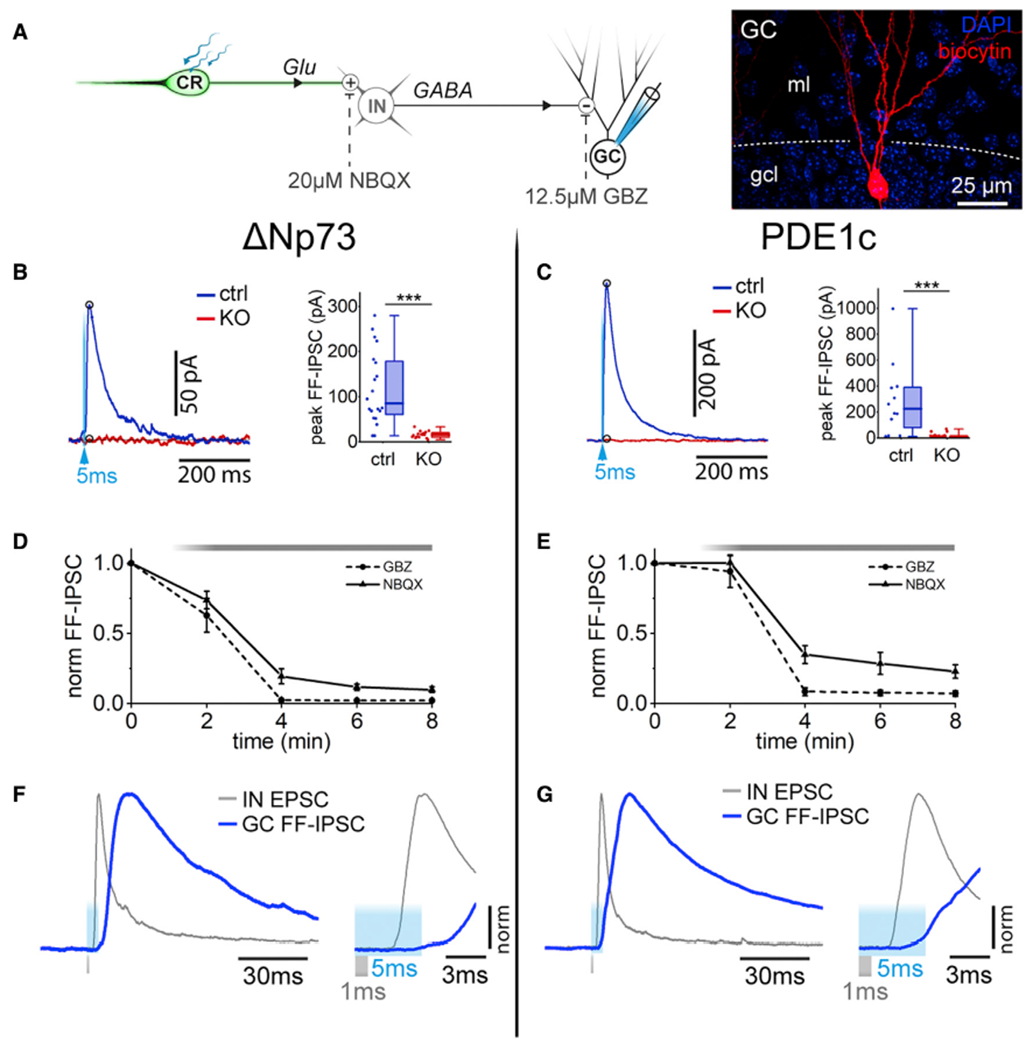
The impact of Cajal-Retzius cells on the regulation of hippocampal circuits and related behaviors is unresolved. Here, we directly address this issue by impairing the glutamatergic output of Cajal-Retzius cells with the conditional ablation of vGluT2, which is their main vesicular glutamate transporter. Although two distinct conditional knockout lines do not reveal major alterations in hippocampal-layer organization and dendritic length of principal neurons or GABAergic cells, we find parallel deficits in specific hippocampal-dependent behaviors and in their putative underlying microcircuits. First, conditional knockout animals show increased innate anxiety and decreased feedforward GABAergic inhibition on dentate gyrus granule cells. Second, we observe impaired spatial memory processing, which is associated with decreased spine density and reduced AMPA/NMDA ratio of postsynaptic responses at the perforant- and entorhino-hippocampal pathways. We conclude that glutamate synaptically released by Cajal-Retzius cells is critical for the regulation of hippocampal microcircuits and specific types of behaviors.

Keywords: CP: Neuroscience; anxiety; development; interneuron; memory; optogenetics; spine; transporter.


Conflict of interest statement

Declaration of interests The authors declare no competing interests.

Figures

Figure 1.
Figure 1.. Validation of two distinct conditional vGluT2 KO lines
(A) Left: overview of the hippocampal molecular layers in the ΔNp73-control (ctrl, left) and ΔNp73-KO mouse (KO, right). Expression of ChR2(H134R)-EYFP by CRs in yellow (EYFP). DAPI counterstaining: cyan (DAPI). White dotted lines: borders between layers. SLM, stratum lacunosum moleculare; ml, molecular layer of the dentate gyrus; gcl, granule cell layer; SP, stratum pyramidale. (B) As in (A) but for PDE1c-ctrl and PDE1c-KO animals. (C) Left: regions delimited by the red corners in (A). Insets: individual CRs and p73 nuclear immunoreactivity (magenta). DAPI stain in cyan. Right: summary plot of the linear density of p73-labled CRs in the two genotypes (ctr: blue, KO: red, n = 18 sections and 3 mice per genotype). (D) As in (C) but for PDE1c-ctrl and PDE1c-KO mice (ctrl, n = 10 sections; KO, n = 12 sections, 3 mice per genotype). (E) Left: immunoreactivity of EYFP+ CR terminals (yellow) for vGluT1, vGluT2, and vGluT3 (magenta) in ΔNp73-ctrl (top row) and ΔNp73-KO animals (bottom row). Right: quantification of bouton density according to their specific vGluT labeling (vGluT1, vGluT2, and vGluT3) and genotype (ctrl; KO, n = 6 stacks, 3 mice per genotype). (F) As in (E) but for PDE1c-ctrl and PDE1c-KO mice (n = 6 stacks, 3 mice per genotype). P30 animals. (G) Flash-evoked photocurrents in CRs. Left: averaged traces of photocurrents in ΔNp73-ctrl (ctrl, blue, n = 18 cells, 3 mice) and ΔNp73-KO animals (KO, red, n = 16 cells, 2 mice) are superimposed. Vholding = −60 mV. Circle: current peak; light blue arrow: time of the flash (1 ms duration). Middle: same traces at an expanded timescale. Notice the nearly instantaneous photocurrent during the flash (light blue shaded area). Right: summary plot of all experiments. (H) As in (G) but for PDE1c-ctrl and PDE1c-KO animals (ctrl, n = 22 cells, 5 mice, and KO, n = 20 cells, 8 mice). (I) Postsynaptic responses generated by CRs on interneurons (INs). Left, averaged EPSCs in INs of the molecular layers, following the optogenetic stimulation of CRs (light blue area). Vholding = −60 mV. Middle: same traces at a different timescale. In contrast to the photocurrents in (G), the EPSC follows the flash. Right: summary graph showing impaired transmission in KO (n = 27 cells, 4 mice) versus ctrl animals (n = 38 cells, 7 mice). The schematic shows the direct recording of flash-evoked (blue lightning) photocurrents from a CR and of EPSCs from an IN. The excitatory and glutamatergic nature of the connection is indicated by the (+) symbol and (Glu), respectively. (J) As in (I) but for PDE1c-ctrl (n = 66 cells, 10 mice) and PDE1c-KO mice (n = 48 cells, 9 mice). Boxplots: median (middle dash), lower and upper quartiles (box borders), and minimum and maximum (whiskers). ns, p > 0.05; *p < 0.05; and **p < 0.01.
Figure 2.
Figure 2.. Increased innate anxiety in ΔNp73- and PDE1c-KO mice
(A) Upper row: averaged heatmaps of the time spent at specific locations in open-field tests for ΔNp73-ctrl (ctrl, left, n = 17) and ΔNp73-KO (KO, right, n = 18) animals. Notice the aversion of KO mice for the central area compared with the border closer to the walls (delimited by the white dotted line). Lower row: averaged heatmaps of the speed of the animals. Thick orange stripes: environmental cues. (B) As in (A) but for PDE1c-ctrl (n = 16) and PDE1c-KO (n = 13) mice. (C) Summary plots of the relative time spent in the center (left), ratio of center/border speed (middle), and normalized distance traveled (right) by ΔNp73-ctrl and ΔNp73-KO mice. Notice the enhanced central avoidance in KO mice, despite the normalized distance traveled similar to ctrl animals. (D) Same organization as in (C) but for PDE1c-ctrl (n = 16) and PDE1c-KO mice (n = 13). (E) Elevated plus maze test: averaged heatmaps for ΔNp73-ctrl (ctrl, left, n = 7) and ΔNp73-KO (KO, right, n = 8) animals. In contrast to the open arms (open) of the plus-shaped platform, closed arms are protected by walls (closed). KO mice show increased tendency to avoid the open space. (F) As in (E) but for PDE1c-ctrl (n = 7) and PDE1c-KO (n = 7) animals. (G) Summary boxplots of the relative time spent in the open arm (left), number of center entries (middle), and normalized distance traveled (right). Notice the aversion for the open arm and the decreased exploratory activity. (H) Same organization as in (G) but for PDE1c-ctrl and PDE1c-KO animals. (I) Averaged heatmaps for the light/dark transitions task for ΔNp73-ctrl (ctrl, left, n = 7) and ΔNp73-KO (KO, right, n = 8) mice. The left half of the arena (grey) is covered and kept in the dark, whereas the right half is illuminated. KO mice have increased preference for the darker compartment. (J) As in (I) but for PDE1c-ctrl (n = 7) and PDE1c-KO (n = 7) animals. (K) Summary quantification of the relative time spent in the light area (left), number of entries in the light compartment (middle), and normalized traveled distance (evaluated in the illuminated area, right). (L) As in (K) but for PDE1c-ctrl and PDE1c-KO mice. Boxplots: median (middle dash), lower and upper quartiles (box borders), and minimum and maximum (whiskers). ns, p > 0.05; *p < 0.05; and **p < 0.01.
Figure 3.
Figure 3.. Loss of CR-dependent feedforward inhibition in the dentate gyrus of ΔNp73- and PDE1c-KO mice
(A) Left: circuit involved in flash-evoked (light blue lightning) feedforward IPSCs recorded from granule cells. CR, Cajal-Retzius cell; IN, interneuron; GC, granule cell. (+) and (Glu), excitatory and glutamatergic connection; (−) and GABA:, inhibitory and GABAergic synapse. Dotted lines: blocking action of the drugs. Right: GC filled with biocytin (red). Dotted line: fissure. ml, molecular layer; gcl, granule cell layer. DAPI counterstain: blue. (B) Left, averaged flash-evoked (light blue arrow) feedforward IPSCs in GCs of ΔNp73-ctrl (ctrl, blue, n = 20 cells, 5 mice) and ΔNp73-KO mice (KO, red, n = 16 cells, 3 mice). Right: summary plot comparing responses in KO versus control animals. (C) As in (B) but for PDE1c-ctrl (n = 27 cells, 2 mice) and PDE1c-KO mice (n = 12 cells, 3 mice). (D) Time course of the block of the normalized feedforward IPSC (norm FF-IPSC) in control mice by either gabazine (GBZ, 12.5 μM, dotted line, n = 7 cells, 2 mice) or NBQX (NBQX, 20 μM, solid line, n = 9 cells, 3 mice). Gray bar: drug application. The sensitivity of the flash-evoked response to GBZ and NBQX demonstrates its feedforward nature. (E) As in (D) but for PDE1c-ctrl and PDE1c-KO animals (GBZ, n = 8 cells, 2 mice, and NBQX, n = 14 cells, 6 mice). (F) Left: super imposition of the normalized averaged monosynaptic EPSC recorded from INs (gray, data from Figure 1) with the normalized averaged FF-IPSC (blue). Both waveforms (from ΔNp73-ctrl mice) are positive going to facilitate the comparison. Right: different timescale. Despite the shorter-duration flash (1 ms, gray downward shaded area) used for the monosynaptic response (compared with 5 ms used for the FF-IPSC, blue upward shaded area), the FF-IPSC has a longer latency and slower risetime, indicative of its polysynaptic and compound nature. (G) As in (F) but for PDE1c-ctrl mice. Boxplots: median (middle dash), lower and upper quartiles (box borders), and minimum and maximum (whiskers). ***p < 0.001.
Figure 4.
Figure 4.. The selective impairment in spatial memory of ΔNp73- and PDE1c-KO mice is associated with layer-specific loss of dendritic spines and reduced AMPA/NMDA ratio of electrically evoked EPSCs
(A) Left: object-location test. Arena (box) with environmental cues (thick orange stripes) and two objects (object1, black filled circle, and object2, grey filled circle). Object2 is moved to a different spot for the testing phases. Right: summary plots of the relative time spent by the mice in proximity of object2 (relative to the total time spent close to object1 and object2) according to the phase of the experiment (training: train; testing: test) and genotype (ΔNp73-ctrl: ctrl, n = 17; DNp73-KO: KO, n = 18). Relative time spent with the moved object increases in ctrl, but not in KO, mice. (B) As in (A) but for PDE1c-ctrl (n = 16) and PDE1c-KO (n = 14) animals. (C) Left: novel-object-recognition test during the training and testing phases. Object2 (grey filled circle) is replaced by object3 (empty diamond) in the testing phase. Right: summary graphs of the relative time spent in proximity to object2 during training (and to object3 during testing) relative to the total time spent with object1 and object2 during training (and object1 and object3 during testing). Data sorted according to phase and genotype (ΔNp73-ctrl: ctrl; ΔNp73-KO: KO). Both ctrl (n = 13) and KO (n = 16) mice increase their preference for the unfamiliar object in the testing phase. (D) As in (E) but for PDE1c-ctrl (n = 16) and PDE1c-KO (n = 14) mice. (E) Left: reconstructions of a biocytin-filled GC (top) and of a CA1 pyramidal neuron (PC; bottom) from a ΔNp73-ctrl mouse. The regions used for spine-density quantification are indicated by the light red area delimited by the red dotted lines. Electrical stimulation is indicated by the thin black electrode and yellow lightening. Responses are purely excitatory (+) because of added GBZ (12.5 μM). ml, distal half of the molecular layer of the dentate gyrus; SLM, stratum lacunosum moleculare; SO, stratum oriens. Middle: dendritic spines (Golgi stain) from ΔNp73-ctrl (ctrl) and ΔNp73-KO (KO) mice in GCs (top) and in apical (middle) or basal (bottom) dendrites of PCs. Right: summary plots. Notice the decreased spine density in KO mice, limited to the dendrites in the molecular layers (ctrl and KO GCs, n = 25 and n = 26 dendrites, respectively; ctrl and KO PCs, 18 dendrites each in SLM) as opposed to those in stratum oriens (ctrl and KO PCs, n = 18 dendrites each in SO). 3 mice per genotype, P30. (F) As in (E) but for PDE1c-ctrl and PDE1c-KO mice (ctrl and KO GCs, n = 27 dendrites each, ctrl and KO PC, n = 35 and n = 39 dendrites in SLM, and ctrl and KO PCs, n = 33 and n = 37 dendrites in SO). 3 mice per genotype, P30. (G) Left: averaged evoked EPSCs recorded in GCs (top, ml stimulation) and PCs (middle, SLM stimulation; bottom, SO stimulation) from ΔNp73-ctrl (ctrl, blue) and ΔNp73-KO (KO, red) mice at Vholding = −60 mV (inward currents) and +40 mV (outward currents). Traces normalized to the peak of the inward currents (norm AMPA). Circles: times of measurements (peak of inward currents [AMPA] and after 75 ms for outward currents [NMDA*]). Right: summary plots of AMPA/NMDA* ratios in ctrl versus KO mice according to cell type and stimulus location. Stimulation of ml (ctrl, n = 20 and KO, n = 22 GCs, 5 and 4 mice, respectively) and SLM (ctrl, n = 19 and KO, n = 17 PCs, 4 mice per genotype) produces different AMPA/NMDA* ratios in KO versus control animals, in contrast to responses triggered by SO stimulation (ctrl, n = 19, and KO, n = 17 PCs, 4 mice per genotype). (H) As in (G) but for PDE1c-ctrl and -KO animals (ctrl, n = 20 and KO, n = 15 GCs, 4 and 2 mice, respectively; ctrl n = 9 and ctrl KO n = 11 PCs for SLM stimulation, 4 and 3 mice, respectively; ctrl, n = 16 and KO n = 19 PCs for SO stimulation, 4 and 3 mice, respectively). Boxplots: median (middle dash), lower and upper quartiles (box borders), and minimum and maximum (whiskers). ns, p > 0.05; *p < 0.05; **p < 0.01; and ***p < 0.001.

Similar articles

Cited by

References

    1. Ainge JA, and Langston RF (2012). Ontogeny of neural circuits underlying spatial memory in the rat. Front. Neural Circ 6, 8. 10.3389/fncir.2012.00008. - DOI - PMC - PubMed
    1. Amelio I, Panatta E, Niklison-Chirou MV, Steinert JR, Agostini M, Morone N, Knight RA, and Melino G (2020). The C terminus of p73 is essential for hippocampal development. Proc. Natl. Acad. Sci. U S A 117, 15694–15701. 10.1073/pnas.2000917117. - DOI - PMC - PubMed
    1. Anstötz M, Huang H, Marchionni I, Haumann I, Maccaferri G, and Lübke JH (2016). Developmental profile, morphology, and synaptic connectivity of Cajal-Retzius Cells in the postnatal mouse hippocampus. Cereb. Cortex 26, 855–872. 10.1093/cercor/bhv271. - DOI - PMC - PubMed
    1. Anstötz M, Lee SK, Neblett TI, Rune G, and Maccaferri G (2018a). Experience-dependent regulation of Cajal-Retzius cell networks in the developing and adult mouse hippocampus. Cereb. Cortex 28, 672–687. 10.1093/cercor/bhx153. - DOI - PMC - PubMed
    1. Anstötz M, Quattrocolo G, and Maccaferri G (2018b). Cajal-Retzius cells and GABAergic interneurons of the developing hippocampus: close electrophysiological encounters of the third kind. Brain Res. 1697, 124–133. 10.1016/j.brainres.2018.07.028. - DOI - PMC - PubMed

Publication types

LinkOut - more resources