. 2022 May 17;39(7):110824.
doi: 10.1016/j.celrep.2022.110824.

The non-essential TSC complex component TBC1D7 restricts tissue mTORC1 signaling and brain and neuron growth

Affiliations

The non-essential TSC complex component TBC1D7 restricts tissue mTORC1 signaling and brain and neuron growth

Sandra Schrötter et al. Cell Rep. .

Abstract

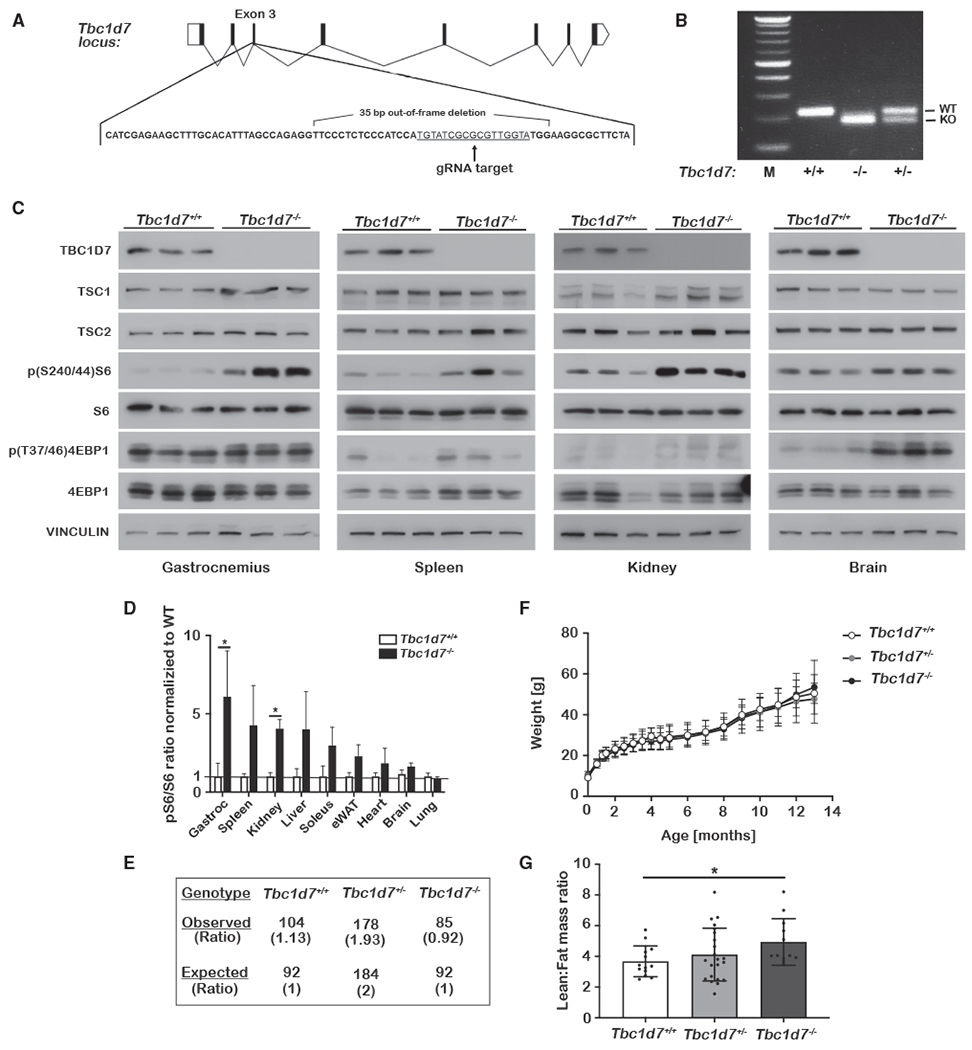
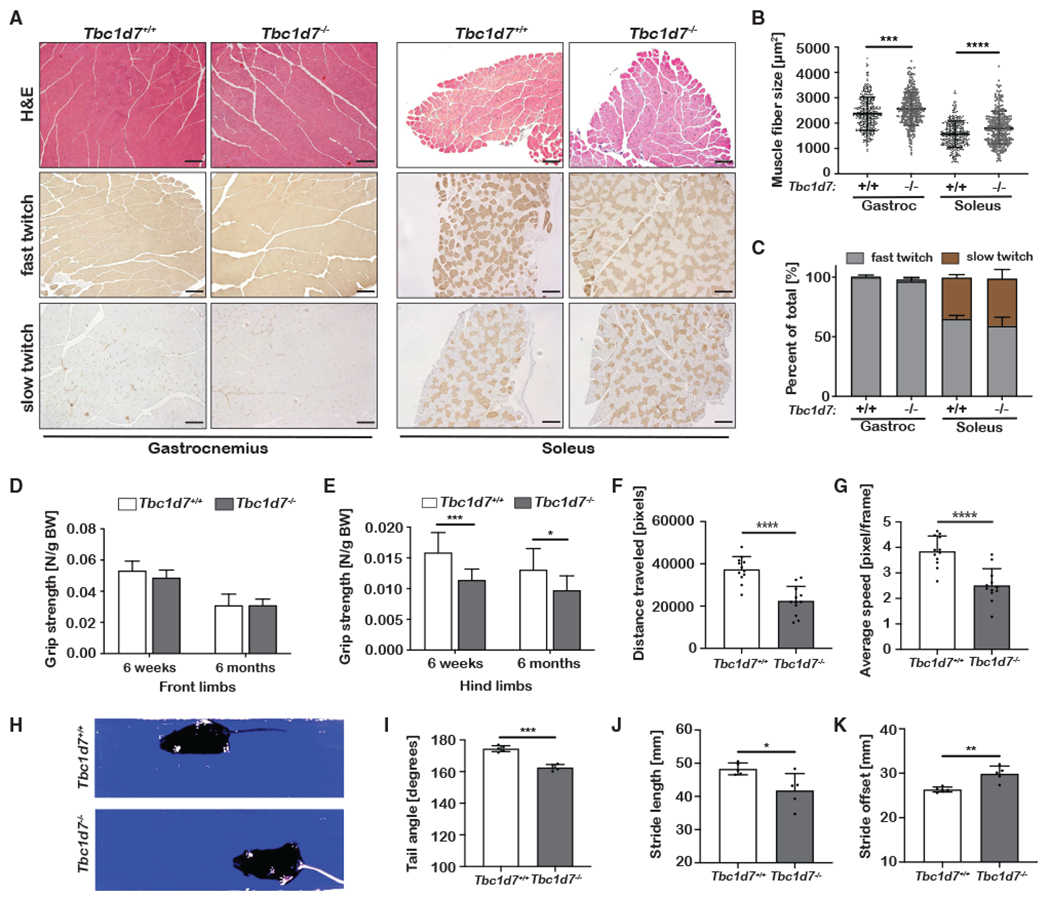
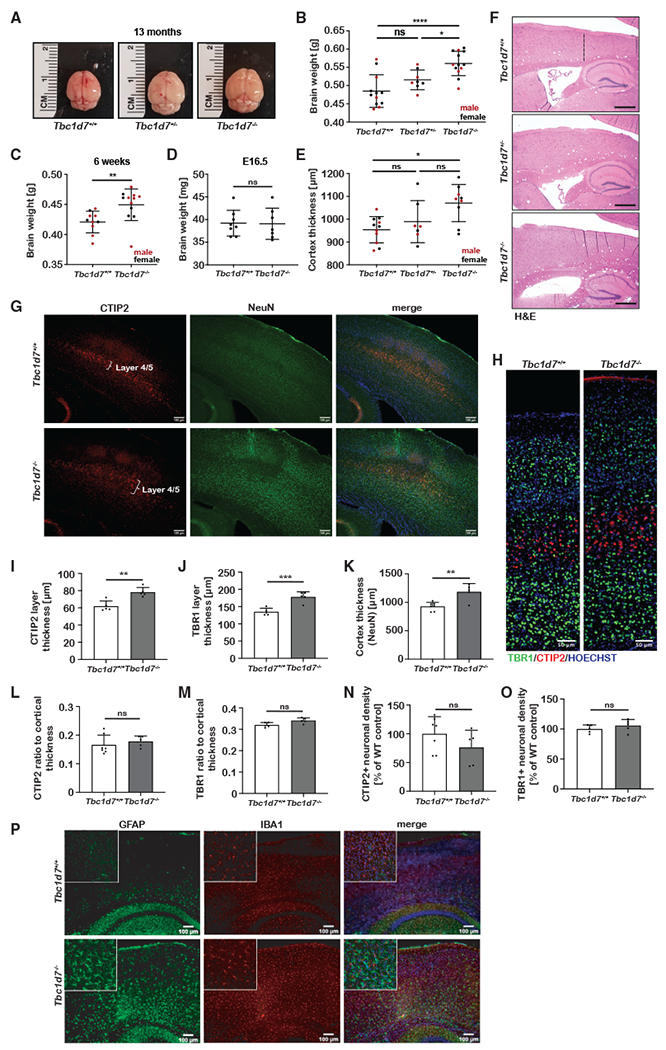
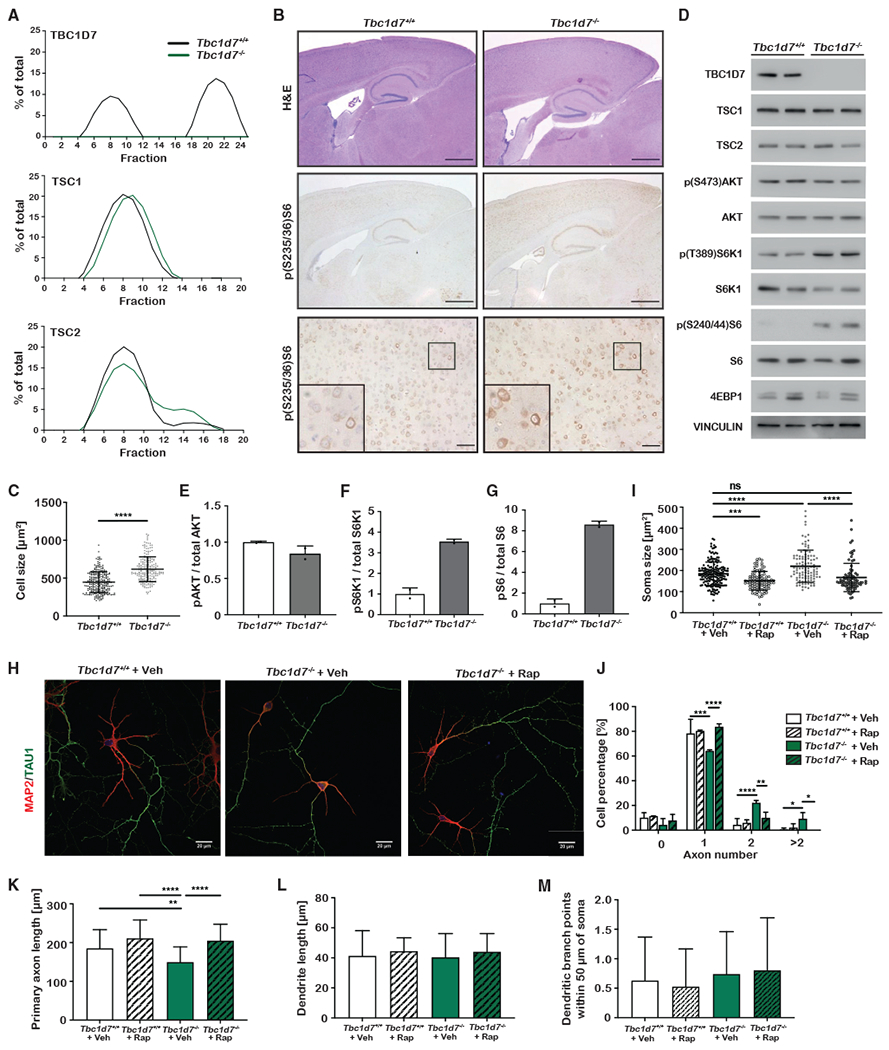
The tuberous sclerosis complex (TSC) 1 and 2 proteins associate with TBC1D7 to form the TSC complex, which is an essential suppressor of mTOR complex 1 (mTORC1), a ubiquitous driver of cell and tissue growth. Loss-of-function mutations in TSC1 or TSC2, but not TBC1D7, give rise to TSC, a pleiotropic disorder with aberrant activation of mTORC1 in various tissues. Here, we characterize mice with genetic deletion of Tbc1d7, which are viable with normal growth and development. Consistent with partial loss of function of the TSC complex, Tbc1d7 knockout (KO) mice display variable increases in tissue mTORC1 signaling with increased muscle fiber size but with strength and motor defects. Their most pronounced phenotype is brain overgrowth due to thickening of the cerebral cortex, with enhanced neuron-intrinsic mTORC1 signaling and growth. Thus, TBC1D7 is required for full TSC complex function in tissues, and the brain is particularly sensitive to its growth-suppressing activities.

Keywords: CP: Developmental biology; CP: Neuroscience; TBC1D7; Tsc1; Tsc2; brain; gait; growth; hamartin; mTOR; megalencephaly; mouse model; neurons; rapamycin; tuberin; tuberous sclerosis complex.


Conflict of interest statement

Declaration of interests B.D.M. is a member of the scientific advisory board and a shareholder of Navitor Pharmaceuticals. M.S. reports grant support from Novartis, Biogen, Astellas, Aeovian, Bridgebio, and Aucta and is on the scientific advisory boards for Novartis, Roche, Regenxbio, SpringWorks Therapeutics, Jaguar Therapeutics, and Alkermes. All other authors declare no competing financial interests.

Figures

Figure 1.
Figure 1.. Generation and initial characterization of Tbc1d7 knockout mice
(A and B) Scheme for CRISPR-Cas9 targeting of Tbc1d7, with the identified 35-bp out-of-frame deletion (A) denoted and (B) detected by PCR genotyping. (C and D) Immunoblots of tissue lysates from littermate Tbc1d7+/+ and Tbc1d7−/− mice at 6 weeks of age following a 6 h daytime fast. Phospho-S6 to total S6 ratios are quantified in (D) as mean ± SD. n = 3. (E) Genotypes of 368 offspring of crosses between Tbc1d7+/− mice. (F) Body weights from a cohort of littermate offspring from Tbc1d7+/− crosses over 13 months graphed as mean ± SD at each age. n = 13 Tbc1d7+/+, 19 Tbc1d7+/−, and 12 Tbc1d7−/−. Age 0 is the weight at weaning (21 days). (G) DEXA scan analysis of the mice in (F) at 6 months of age, with the lean-to-fat-mass ratio graphed as mean ± SD. Statistical analysis by one-way ANOVA, *p < 0.05.
Figure 2.
Figure 2.. Muscle and gait analysis of Tbc1d7 knockout mice
(A–C) Histological cross-sections of muscle from 6-week-old mice stained as indicated. Scale bars, 100 μm. (B) Cross-sectional muscle-fiber area graphed as mean ± SD. (C) Quantification of muscle-fiber types graphed as mean percentage of total ± SD. n = 4. (D and E) Front-limb (D) and hind-limb (E) grip strength measured at 6 weeks and 6 months of age graphed as mean ± SD. 6 week: n = 9 Tbc1d7+/+ and 13 Tbc1d7−/− 6 month: n = 13 Tbc1d7+/+ and 12 Tbc1d7−/−. (F and G) Open-field test of 6-month-old mice, with (F) distance traveled and (G) speed graphed as mean ± SD. n = 12. (H–K) Video-recorded gait analysis of 6-month-old mice with (I) tail angle, (J) stride length, and (K) stride offset graphed as mean ± SD. n = 5. Statistical analysis (B, E–G, and I–K) by Student’s t test, *p < 0.05, **p < 0.01, ***p < 0.001, ****p < 0.0001.
Figure 3.
Figure 3.. Loss of TBC1D7 leads to brain overgrowth
(A and B) Representative brains from each genotype at 13 months (A) with brain weights graphed as mean ± SD. (B). n = 12 Tbc1d7+/+, 8 Tbc1d7++/−, and 13 Tbc1d7−/−. (C) Brain weights at 6 weeks graphed as mean ± SD. n = 11 Tbc1d7+/+ and 13 Tbc1d7−/−. (D) Brain weights at E16.5 graphed as mean ± SD. n = 8 Tbc1d7+/+ and 7 Tbc1d7−/−. (E and F) Cortical thickness measured at the primary motor cortex in sagittal brain sections from 13-month-old mice is graphed as mean ± SD (E). n = 11 Tbc1d7+/+, 7 Tbc1d7+/− and 9 Tbc1d7−/−. Representative H&E-stained sections are shown, with the cortical region measured denoted with a dashed line (F, top). Scale bars, 500 μm. (G and H) Immunofluorescence imaging of brain sections from 8-month-old mice stained as indicated (G and H). Scale bars, 100 (G) and 50 μm (H). (I–O) Measurement of thickness for layer IV/V (I), layer VI (J), and total cortex (K) and ratio of layer IV/V (L) or layer VI (M) to total cortex, and quantification of neuronal density in these layers (N and O) were graphed as mean ± SEM. n = 7 Tbc1d7+/+ and 5 Tbc1d7−/−. (P) Immunofluorescence imaging of brain sections from 8-month-old mice stained as indicated. Inset shows a 5× magnification. Scale bar, 100 μm. Statistical analysis by one-way ANOVA (B and E) and Student’s t test (C, D, and I–K), *p < 0.05, **p < 0.01, ***p < 0.001, ****p < 0.0001.
Figure 4.
Figure 4.. Analysis of neuronal cell size and polarization of Tbc1d7 knockout mice
(A) Percentage total for the indicated proteins in size-exclusion chromatography fractions of whole-brain lysates from mice aged 1 year. (B) Histological analysis of sagittal sections from brains of 6-week-old mice stained as indicated. Scale bars, 1 mm (top/middle) and 100 μm (bottom), with inset showing a 2.5× zoom of the marked area. (C) Quantification of soma area in phospho-S6-stained cortical neurons from (B) in 5 mice from each genotype, graphed as mean ± SD. n = 262 Tbc1d7+/+ and 213 Tbc1d7−/− cells. (D–G) mTORC1 signaling in primary cortical neurons (DIV7) following 4 h of growth factor and amino-acid withdrawal. Immunoblots (D) and quantification (E-G) graphed as mean ± SD. n = 2. (H–L) Immunofluorescence imaging of primary hippocampal neurons (DIV7) treated from DIV4 with vehicle or rapamycin (100 nM). Data are from DIV7 neurons, with soma area (I), axon number (J), axon length (K), dendrite length (L), and dendritic branch points (M) measured and graphed as mean ± SD for 2 technical replicates in each of 3 independent experiments. n = 179 Tbc1d7+/+ with vehicle, 93 Tbc1d7+/+ with rapamycin, 109 Tbc1d7−/− with vehicle, and 87 Tbc1d7−/− with rapamycin. Statistical analysis by Student’s t test (C) and one-way ANOVA (H–K), *p < 0.05, **p < 0.01, ***p < 0.001, ****p < 0.0001.

References

    1. Alfaiz AA, Micale L, Mandriani B, Augello B, Pellico MT, Chrast J, Xenarios I, Zelante L, Merla G, and Reymond A (2014). TBC1D7 mutations are associated with intellectual disability, Macrocrania, patellar dislocation, and celiac disease. Hum. Mutat 35, 447–451. 10.1002/humu.22529. - DOI - PubMed
    1. Amende I, Kale A, McCue S, Glazier S, Morgan JP, and Hampton TG (2005). Gait dynamics in mouse models of Parkinson’s disease and Huntington’s disease. J. Neuroeng. Rehabil 2, 20. 10.1186/1743-0003-2-20. - DOI - PMC - PubMed
    1. Andrews MG, Subramanian L, and Kriegstein AR (2020). Mtor signaling regulates the morphology and migration of outer radial glia in developing human cortex. Elife 9, 1–21. 10.7554/elife.58737. - DOI - PMC - PubMed
    1. Anttila V, Winsvold BS, Gormley P, Kurth T, Bettella F, McMahon G, Kallela M, Malik R, de Vries B, Terwindt G, et al. (2013). Genome-wide meta-analysis identifies new susceptibility loci for migraine. Nat. Genet 45, 912–917. 10.1038/ng.2676. - DOI - PMC - PubMed
    1. Bar-Peled L, Chantranupong L, Cherniack AD, Chen WW, Ottina KA, Grabiner BC, Spear ED, Carter SL, Meyerson M, and Sabatini DM (2013). A tumor suppressor complex with GAP activity for the rag GTPases that signal amino acid sufficiency to mTORC1. Science 340, 1100–1106. 10.1126/science.1232044. - DOI - PMC - PubMed

Publication types

MeSH terms

Substances

Supplementary concepts