. 2022 May 17;39(7):110814.
doi: 10.1016/j.celrep.2022.110814.

WEE1 inhibition enhances the antitumor immune response to PD-L1 blockade by the concomitant activation of STING and STAT1 pathways in SCLC

Affiliations

WEE1 inhibition enhances the antitumor immune response to PD-L1 blockade by the concomitant activation of STING and STAT1 pathways in SCLC

Hirokazu Taniguchi et al. Cell Rep. .

Abstract

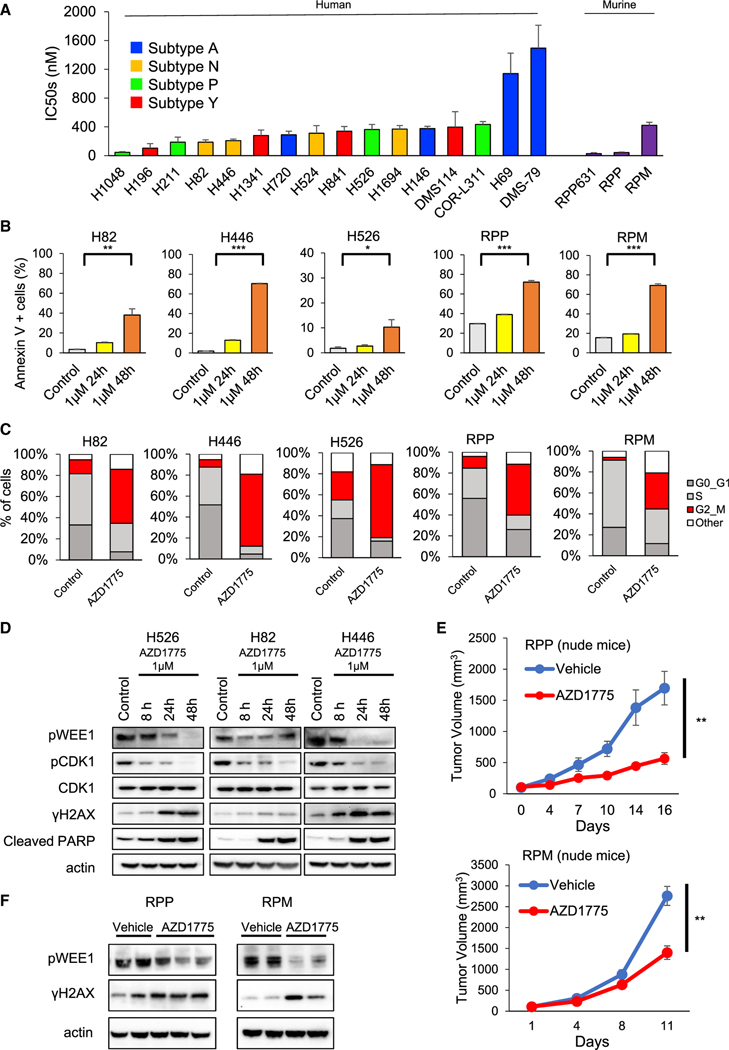
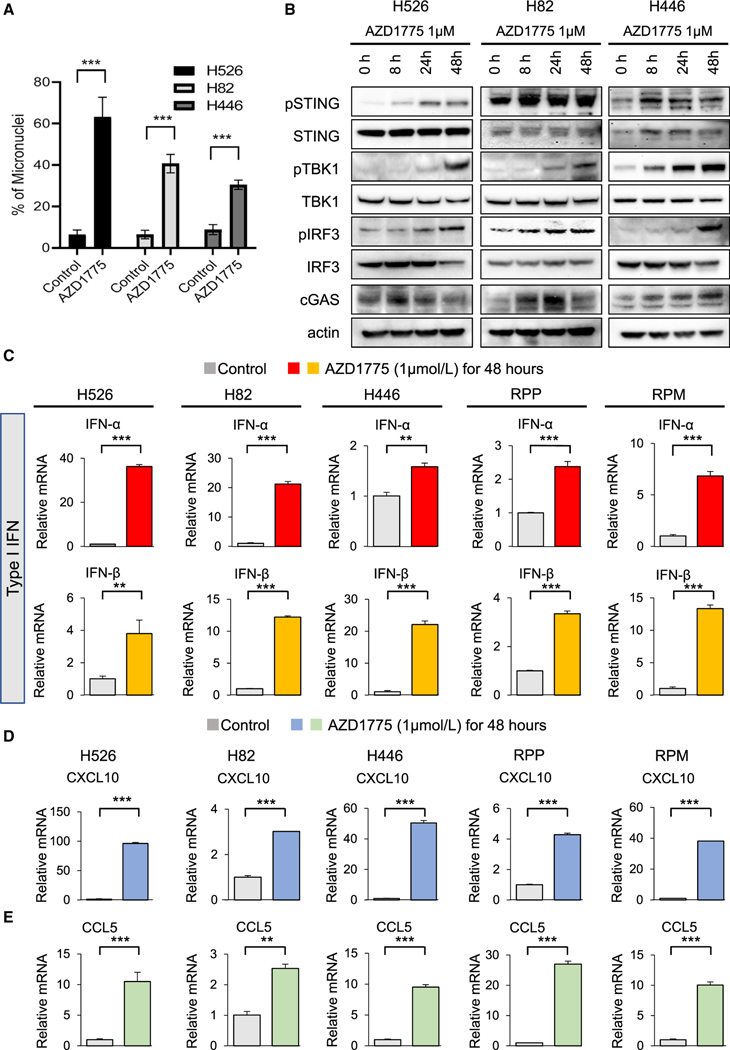
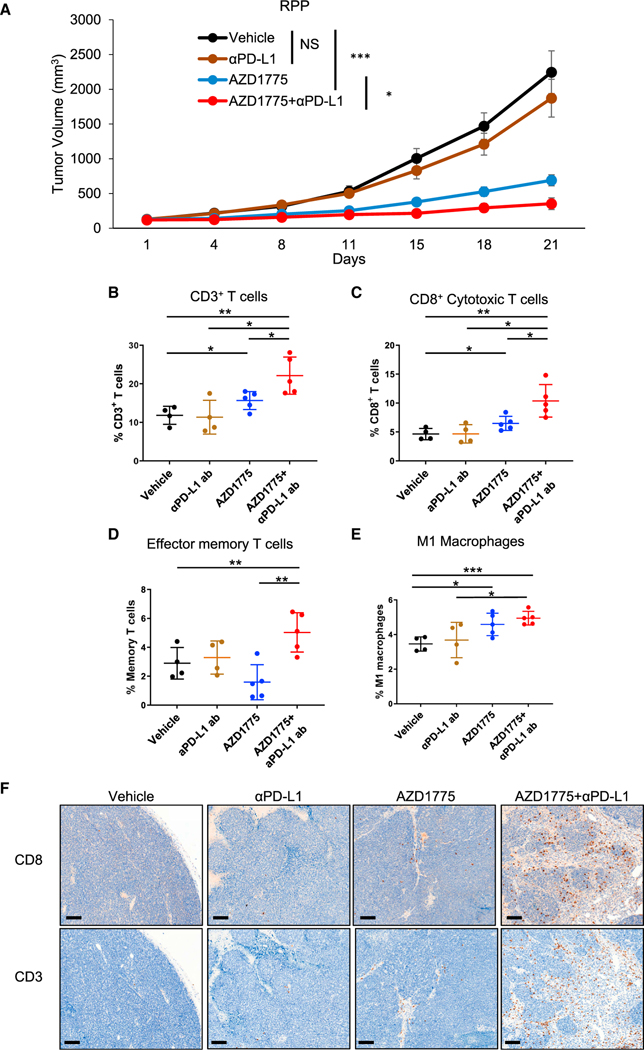
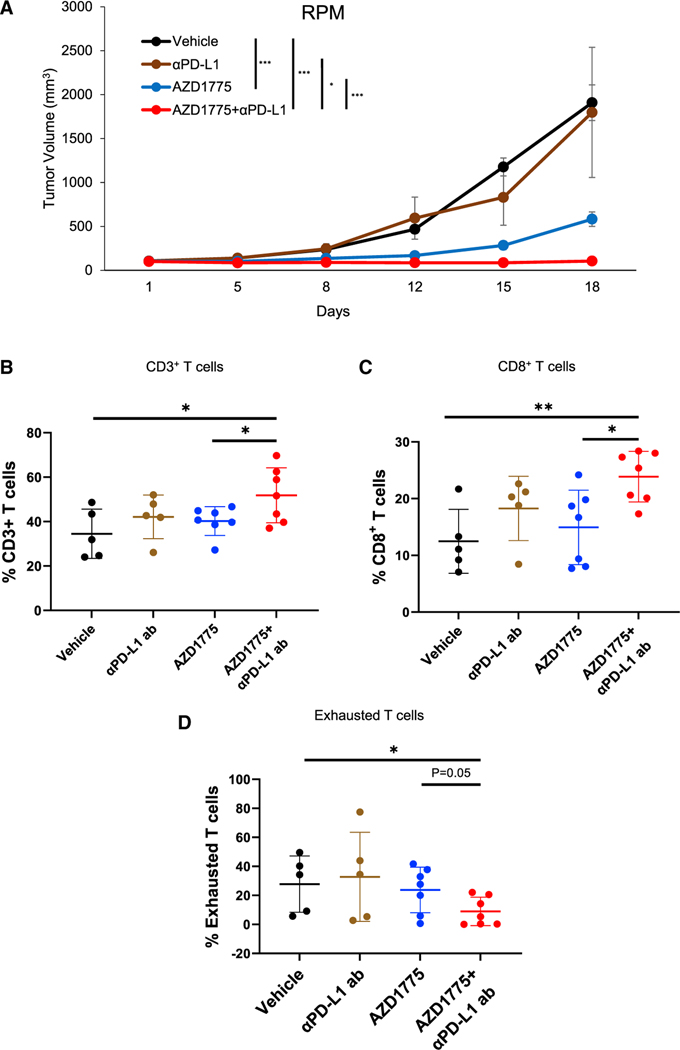
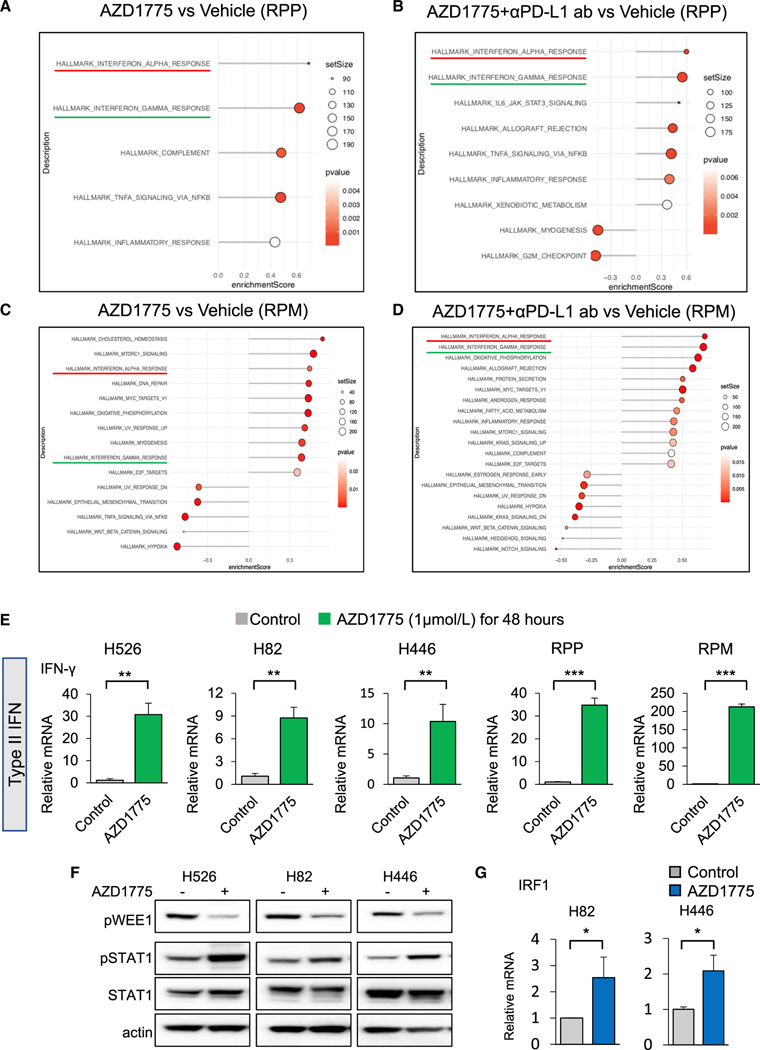
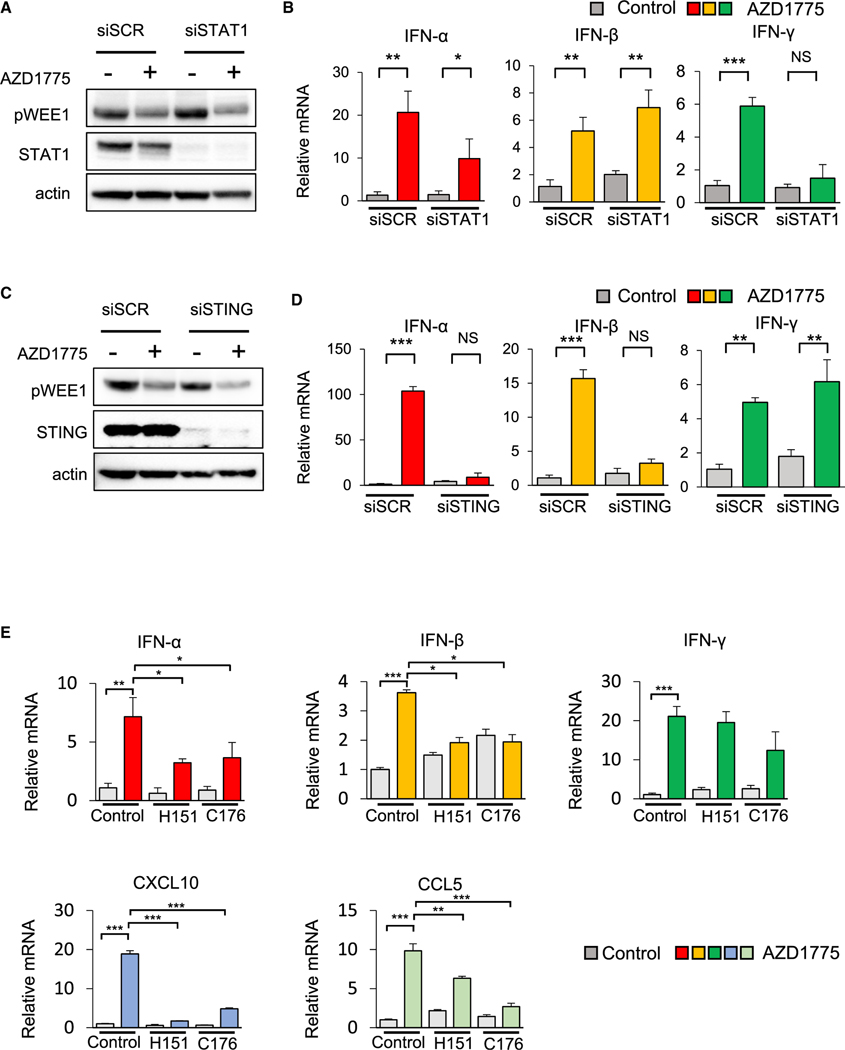
Small cell lung cancers (SCLCs) have high mutational burden but are relatively unresponsive to immune checkpoint blockade (ICB). Using SCLC models, we demonstrate that inhibition of WEE1, a G2/M checkpoint regulator induced by DNA damage, activates the STING-TBK1-IRF3 pathway, which increases type I interferons (IFN-α and IFN-β) and pro-inflammatory chemokines (CXCL10 and CCL5), facilitating an immune response via CD8+ cytotoxic T cell infiltration. We further show that WEE1 inhibition concomitantly activates the STAT1 pathway, increasing IFN-γ and PD-L1 expression. Consistent with these findings, combined WEE1 inhibition (AZD1775) and PD-L1 blockade causes remarkable tumor regression, activation of type I and II interferon pathways, and infiltration of cytotoxic T cells in multiple immunocompetent SCLC genetically engineered mouse models, including an aggressive model with stabilized MYC. Our study demonstrates cell-autonomous and immune-stimulating activity of WEE1 inhibition in SCLC models. Combined inhibition of WEE1 plus PD-L1 blockade represents a promising immunotherapeutic approach in SCLC.

Keywords: CD8(+) T cells; CP: Cancer; CP: Immunology; PD-L1; SCLC; STAT1 pathway; STING pathway; WEE1 inhibition; immune checkpoint blockade; immunotherapy; interferon.


Conflict of interest statement

Declaration of interests C.M.R. has consulted regarding oncology drug development with AbbVie, Amgen, Ascentage, Astra Zeneca, Bicycle, Celgene, Daiichi Sankyo, Genentech/Roche, Ipsen, Jazz, Lilly, Pfizer, PharmaMar, Syros, and Vavotek. C.M.R. serves on the scientific advisory boards of Bridge Medicines, Earli, and Harpoon Therapeutics. T.S. has received research grant from Jazz Pharmaceuticals. A.O.M. is currently employed by Regeneron Pharmaceuticals; none of the work herein was funded or sponsored by Regeneron. H.M. has received a commercial research grant from Chugai Pharm and speaking honoraria from Astra Zeneca and MSD, a subsidiary of Merck & Co., Inc.

Figures

Figure 1.
Figure 1.. The antitumor effect of AZD1775 in SCLC
(A) Cell viability IC50 values were determined in response to treatment with AZD1775 (0–10 μM) for 5 days in 16 human and three murine SCLC cell lines. The data shown represent the means ± SD of three individual experiments. (B) Cells were treated with 1 μM AZD1775 for 24 or 48 h. Then, the proportion of apoptotic cells was detected using annexin V-propidium iodide-based flow cytometry. Bars represent mean ± SD of triplicate. Statistical significance was determined using Student’s t test (**p < 0.01, ***p < 0.001). (C) Cells were treated with 1 μM AZD1775 for 16 h. Cell-cycle states were detected with EdU-DAPI-based flow cytometry. (D) Cells were treated with 1 μM AZD1775 for 8, 24, or 48 h. Western blots show protein expression of phospho-WEE1, phospho- and total CDK1, γH2AX, cleaved PARP, and actin (loading control) at each time indicated. (E) Tumor-growth curves of subcutaneous tumors in nude mice with conditional loss of Trp53, p130, and Rb1 (RPP; top) and Trp53, Rb1, and MYCT58A (RPM; bottom) treated with vehicle or 60 mg/kg of AZD1775 (n = 5 per group). Bars represent mean ± SE. Statistical significance was determined using Student’s t test (**p < 0.01). (F) Western blots showing phosho-WEE1, γH2AX, and actin (loading control) of RPP or RPM tumors from (E). See also Figure S1.
Figure 2.
Figure 2.. Antitumor immune response of AZD1775 is mediated via the cGAS-STING-TBK1-IRF3 pathway in SCLC
(A) Quantification of cells containing micronuclei (MN) after 1 μM AZD1775 treatment for 24 h. Bars represent mean ± SD of eight areas. Statistical significance was determined using Student’s t test (***p < 0.001). (B) Western blots showing the protein expression of STING pathway, phospho (p)- and total (t)-STING, p- and t-TBK1, p- and t-IRF3, cGAS, and actin (loading control) in SCLC cells treated with 1 μM AZD1775 for 8, 24, and 48 h. (C) Quantitative mRNA expression of IFN-α, IFN-β after treatment with 1 μM AZD1775 for 48 h in SCLC cells (H526, H82, H446, RPP, and RPM). Bars represent mean ± SD of triplicate. Statistical significance was determined using Student’s t test (**p < 0.01, ***p < 0.001). (D and E) Quantitative mRNA expression of (D) CXCL10 and (E) CCL5 after treatment with 1 μM AZD1775 for 48 h in SCLC cells (H526, H82, H446, RPP, and RPM). Bars represent mean ± SD of triplicate. Statistical significance was determined using Student’s t test (**p < 0.01, ***p < 0.001). See also Figures S2–S4.
Figure 3.
Figure 3.. WEE1 inhibition enhances antitumor responses induced by anti-PD-L1 antibody in vivo in RPP tumor-bearing model
(A) Tumor-growth curves of vehicle, AZD1775 alone (60 mg/kg, 5 of 7 days, Q.D.), anti-PD-L1 antibody alone (300 μg/body, once weekly), and AZD1775 plus anti-PD-L1 antibody groups in B6 129F1 mice injected with RPP cells (n = 10 per group). Bars represent mean ± SE. Statistical significance was determined using Student’s t test (*p < 0.05, ***p < 0.001). (B–E) RPP tumors were harvested at day 15 for immune profiling by flow cytometry. Cumulative data for the tumors are shown. Flow-cytometry analysis of (B) CD45+CD3+ total T cells, (C) CD45+CD3+CD8+ cytotoxic T cells, (D) effector memory CD8+ T cells: CD45+CD3+CD8+CD44hiCD62Llo, and (E) M1 macrophages: CD45+F4/80+GR-1CD11b+CD68+iNOS+. Percentages were the ratio to CD45+ cells (n = 5 for vehicle and anti-PD-L1 group, n = 6 for AZD1775 and AZD1775 plus anti-PD-L1 group). Bars represent mean ± SD. Statistical significance was determined using Student’s t test (*p < 0.05, **p < 0.01, ***p < 0.001). (F) CD8 and CD3 immunohistochemistry was performed on sections of tumors resected on day 21 (from A). Representative images are shown. Scale bar: 100 μm. See also Figure S5.
Figure 4.
Figure 4.. WEE1 inhibition enhances antitumor responses induced by anti-PD-L1 antibody in vivo in RPM tumor-bearing model
(A) Tumor-growth curves of vehicle, AZD1775 alone (60 mg/kg, 5 of 7 days, Q.D.), anti-PD-L1 antibody alone (300 μg/body, once weekly), and AZD1775 plus anti-PD-L1 antibody groups in B6FVBF1/J mice injected with RPM cells (n = 5 for vehicle and anti-PD-L1 antibody groups, n = 7 for AZD1775 and AZD1775 plus anti-PD-L1 antibody groups). The data shown represent the means ± SE. p values were calculated by Student’s t test (*p < 0.05, ***p < 0.001). (B–D) RPM tumors were harvested at day 19 for immune profiling by flow cytometry. Cumulative data for the tumors are shown. Flow-cytometry analysis of (B) CD45+CD3+ total T cells, (C) CD45+CD3+CD8+ cytotoxic T cells, and (D) exhausted CD8+ T cells: CD45+CD3+CD8+PD-1+TIM-3+. Percentages in (B) and (C) were the ratio to CD45+ cells and percentages in (D) were the ratio to CD8+ cells (n = 5 for vehicle and anti-PD-L1 group, n = 7 for AZD1775 and AZD1775 plus anti-PD-L1 group). The data shown represent the means ± SD. p values were calculated by Student’s t test (*p < 0.05, **p < 0.01). See also Figure S6.
Figure 5.
Figure 5.. Pathway analysis demonstrates activation of type I and II interferon (IFN) pathways in SCLC mouse tumors treated with AZD1775 or AZD1775 plus anti-PD-L1 antibody, and AZD1775 mediates STAT1 pathway activation in SCLC cells
(A and B) HALLMARK pathway enrichment analyses of differentially expressed genes (DEGs) from RPP tumors on the mice treated with vehicle, AZD1775, or AZD1775 plus anti-PD-L1 antibody for 21 days. (A) AZD1775 versus vehicle and (B) AZD1775 plus anti-PD-L1 antibody versus vehicle (n = 5 per group). (C and D) HALLMARK pathway enrichment analyses of DEGs from RPM tumors on the mice treated with vehicle, AZD1775, or AZD1775 plus anti-PD-L1 antibody for 18 days. (C) AZD1775 versus vehicle and (D) AZD1775 plus anti-PD-L1 antibody versus vehicle (n = 4 per group). (E) Quantitative mRNA expression of IFN-γ after treatment with 1 μM of AZD1775 for 48 h in SCLC cells (H526, H82, H446, RPP, and RPM cells). The data shown represent the means ± SD of triplicate. p values were calculated by Student’s t test (**p < 0.01, ***p < 0.001). (F) Western blots show expression of p-WEE1, p- and total STAT1, and actin (loading control) in SCLC cells (H526, H82, H446). Cells were treated with 1 μM AZD1775 for 24 h. (G) Quantitative mRNA expression of IRF1 after treatment with 1 μM AZD1775 for 48 h in SCLC cells (H82, H446). The data shown represent the means ± SD of triplicate. p values were calculated by Student’s t test (*p < 0.05). See also Figure S7.
Figure 6.
Figure 6.. STING and STAT1 mediate induction of type I and type II interferons following WEE1 inhibition
(A and B) Knockdown of STAT1 (or siRNA control [siSCR]) by siRNA followed by treatment with 1 μM AZD1775 for 48 h in H82 cells. (A) Western blots show expression of p-WEE1, total STAT1, and actin (loading control). (B) Quantitative mRNA expression of IFN-α, IFN-β, and IFN-γ. (C and D) Knockdown of STING (or siSCR) by siRNA followed by treatment with 1 μM AZD1775 for 48 h in H82 cells. The data shown represent the means ± SD of triplicate. p values were calculated by Student’s t test (*p < 0.05, **p < 0.01, ***p < 0.001). (C) Western blots showing expression of p-WEE1, total STING, and actin (loading control). (D) Quantitative mRNA expression of IFN-α, IFN-β, and IFN-γ. The data shown represent the means ± SD of triplicate. p values were calculated by Student’s t test (**p < 0.01, ***p < 0.001). (E) Quantitative mRNA expression of IFN-α, IFN-β, IFN-γ, CXCL10, and CCL5 after treatment with 500 nM H151 or 1 μM C176 and 1 μM AZD1775 for 48 h in H526 cells. The data shown represent the means ± SD of triplicate. p values were calculated by Student’s t test (*p < 0.05, **p < 0.01, ***p < 0.001). See also Figure S8.

Similar articles

Cited by

References

    1. Alexandrov LB, Nik-Zainal S, Wedge DC, Aparicio SA, Behjati S, Biankin AV, Bignell GR, Bolli N, Borg A, Børresen-Dale AL, et al. (2013). Signatures of mutational processes in human cancer. Nature 500, 415–421. 10.1038/nature12477. - DOI - PMC - PubMed
    1. Antonia SJ, López-Martin JA, Bendell J, Ott PA, Taylor M, Eder JP, Jäger D, Pietanza MC, Le DT, de Braud F, et al. (2016). Nivolumab alone and nivolumab plus ipilimumab in recurrent small-cell lung cancer (CheckMate 032): a multicentre, open-label, phase 1/2 trial. Lancet Oncol. 17, 883–895. 10.1016/s1470-2045(16)30098-5. - DOI - PubMed
    1. Byers LA, and Rudin CM (2015). Small cell lung cancer: where do we go from here? Cancer 121, 664–672. 10.1002/cncr.29098. - DOI - PMC - PubMed
    1. Byers LA, Wang J, Nilsson MB, Fujimoto J, Saintigny P, Yordy J, Giri U, Peyton M, Fan YH, Diao L, et al. (2012). Proteomic profiling identifies dysregulated pathways in small cell lung cancer and novel therapeutic targets including PARP1. Cancer Discov. 2, 798–811. 10.1158/2159-8290.Cd-12-0112. - DOI - PMC - PubMed
    1. Cargill KR, Stewart CA, Park EM, Ramkumar K, Gay CM, Cardnell RJ, Wang Q, Diao L, Shen L, Fan YH, et al. (2021). Targeting MYC-enhanced glycolysis for the treatment of small cell lung cancer. Cancer Metab. 9, 33. 10.1186/s40170-021-00270-9. - DOI - PMC - PubMed

Publication types

MeSH terms