. 2022 May 17;39(7):110815.
doi: 10.1016/j.celrep.2022.110815.

A cytotoxic-skewed immune set point predicts low neutralizing antibody levels after Zika virus infection

Affiliations

A cytotoxic-skewed immune set point predicts low neutralizing antibody levels after Zika virus infection

Elizabeth E McCarthy et al. Cell Rep. .

Abstract

Although generating high neutralizing antibody levels is a key component of protective immunity after acute viral infection or vaccination, little is known about why some individuals generate high versus low neutralizing antibody titers. Here, we leverage the high-dimensional single-cell profiling capacity of mass cytometry to characterize the longitudinal cellular immune response to Zika virus (ZIKV) infection in viremic blood donors in Puerto Rico. During acute ZIKV infection, we identify widely coordinated responses across innate and adaptive immune cell lineages. High frequencies of multiple activated cell types during acute infection are associated with high titers of ZIKV neutralizing antibodies 6 months post-infection, while stable immune features suggesting a cytotoxic-skewed immune set point are associated with low titers. Our study offers insight into the coordination of immune responses and identifies candidate cellular biomarkers that may offer predictive value in vaccine efficacy trials aimed at inducing high levels of antiviral neutralizing antibodies.

Keywords: CP: Immunology; CyTOF; Zika virus; immune signatures; neutralizing antibodies; systems immunology.


Conflict of interest statement

Declaration of interests M.H.S. is founder and a board member of Teiko Bio, has received consultant fees from Five Prime Therapeutics, Earli, Ono Pharmaceutical, and January, and has received research funding from Roche/Genentech, Pfizer, Valitor, and Bristol-Myers Squibb.

Figures

Figure 1.
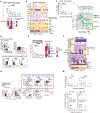
Figure 1.. Acute infection with ZIKV elicits profound phenotypic changes across peripheral blood cellular immune populations
(A) Twenty-five adults, viremic with acute ZIKV infection at the time of blood donation (index visit), had peripheral-blood sampling at up to three time points: acute phase of infection and early and/or late convalescence (see Table S1 for clinical characteristics). (B) Plasma ZIKV viral load (VL), neutralizing antibody titers (NT80) and total IgG and IgM levels of study-cohort participants. Red line connects median values at each sampling timepoint (±95% confidence interval [CI]). (C) Directed line plots for each participant in PCA space from early to later time points. Black triangles denote 8 uninfected control samples. (D) Scatterplots of days since index visit at the acute time point and the value of PC1 at the acute time point or the total distance traveled in PCA space between the acute and late convalescent time points (Spearman’s correlation with regression line). (E) Heatmap showing the Z score-normalized frequency of the log-adjusted feature abundances for the manually gated phenotypic features that change significantly over time (see Table S2 for list of features assessed). (F) SCAFFoLD maps showing clusters of cells associated with landmark cell-population nodes (black dots). Clusters that significantly change in abundance between the acute and late convalescent time points are labeled: increase (red), decrease (blue), or increase and then decrease (green). (G) Heatmap showing the normalized abundance of the clusters (Z score based on percentage of parent-cell-type population) that change significantly. Significance in (E)–(G) based on linear mixed effects (LME) model fit with p_adj < 0.05. See also Figure S1 and Tables S1 and S2
Figure 2.
Figure 2.. Transient accumulation of activated immune cells during acute ZIKV infection
(A) Frequency (as a percentage of total live cells) and phenotype (Z scored proportion of cells that express each marker) of CD14+CD16+ monocytes across the course of acute and resolving ZIKV infection. (B) Heatmap showing Z score-normalized median expression of indicated markers (rows) for each monocyte-associated cell cluster (columns). Column annotation indicates clusters that significantly decrease (blue), increase (red), increase and then decrease (green), or remain unchanged (gray) in abundance (as a percentage of CD14+ monocytes; p_adj < 0.05). (C) Change in abundance of CD14+ monocyte cluster 49 (as a percentage of CD14+ monocytes; p_adj = 0.0002; left) and Spearman’s correlation matrix of marker expression on single cells in CD14+ monocyte cluster 49 from acute-visit samples (right). (D) Gating scheme for non-naïve CD8+ T cells that co-express HLA-DR and CD38. Percentages shown are the percentage of parent populations in plotted sample. (E) Frequency (as a percentage of non-naïve CD8+ T cells) and phenotype (Z scored proportion of cells that express each marker) of HLA-DR+CD38+ non-naïve CD8+ T cells across the course of acute and resolving ZIKV infection. (F) Phenotype (Z scored median expression of each marker) of CD8+ T cell clusters that significantly decrease (blue), increase (red), increase and then decrease (green), or remain unchanged (gray) in abundance. (G) Gating scheme for B cell subsets, including activated and antibody-secreting B cells (ABCs and ASCs, respectively). Percentages shown are the percentage of parent populations in the plotted sample. (H) Frequency (as a percentage of non-naïve B cells) and phenotype of ABCs and ASCs across the course of acute and resolving ZIKV infection; p_adj < 0.05). *p_adj < 0.05, **p_adj < 0.01, and ***p_adj < 0.001. (A, C, E, and H) Red line connects median values at each sampling time point (±95% CI). UI, uninfected. N = 25 participants. See also Figures S3-S5.
Figure 3.
Figure 3.. Coordinated activation across different cell types in acute ZIKV infection
(A) Scatterplot of the frequency of ASC B cells and CD38+HLA-DR+ CD8+ T cells in acute ZIKV infection with regression line. (B) Number of significant (p_adj < 0.05) positive and negative correlations between cellular immune features that are present in acute ZIKV infection, grouped by those that are unique to ZIKV versus those shared with the uninfected (UI) cohort. (C) Odds ratio (±95% CI) that cellular immune feature correlations unique to ZIKV infection are more likely to be associated with different correlation attributes (compared with the correlations shared with the UI cohort). (D and E) Correlation plots of select features uniquely correlated in acute ZIKV infection (Spearman’s r with correlation line): (D) adaptive-to-innate immune features and (E) negatively correlated features. N = 17 participants (anti-ZIKV IgM- at index visit).
Figure 4.
Figure 4.. Correlated immune cell features during acute ZIKV infection
(A) Correlation heatmap depicting Spearman’s correlation values (no significance cutoff) of all manually gated features from acute ZIKV infection, representing the 17 participants who were ZIKV IgM- (“pre-IgM”) at the index visit. Hierarchical clustering was used to group cellular features into five modules. Negatively correlated modules 3 and 5 are indicated with bold outlines. (B) Distribution of (module 5 score - module 3 score) values at the acute visit among the pre-IgM study participants. N = 17 participants (anti-ZIKV IgM- at index visit). See also Figure S5.
Figure 5.
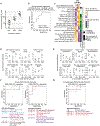
Figure 5.. Distinct cellular immune signatures are associated with the development of high versus low ZIKV neutralizing antibody titers 6 months after infection
(A) ZIKV neutralizing antibody titers (NT80) measured approximately 6 months post-index visit in the overall REDS-III study participants (gray dots) and the sub-cohort studied here (black dots). Participants were divided into tertiles based on these values. (B) Receiver operating characteristic (ROC) curve for predicting high- versus low-titer individuals using the difference between the acute-phase module 5 and 3 signature scores. (C) Heatmap showing Z score-normalized abundance at the acute visit for cellular features that were significantly (p_adj < 0.05) increased in high versus low 6-month NT80 titer participants at the acute time point. Row annotations for each feature indicate the following: mean values in a cross-sectional UI control cohort, whether or not the abundance of the feature significantly changed across time between acute to convalescent infection, and whether or not the abundance of the feature was also present at a significantly higher frequency (p_adj < 0.05) in the same group (high-versus low-titer participants) at the late convalescent time point. (D and E) Abundance (log-adjusted) of features during acute ZIKV infection associated with high (D) versus low (E) 6-month neutralizing antibody titers. (F) ROC curves for predicting high- versus low-titer individuals using the acute ZIKV cellular features from (C) that are associated with high (left) versus low (right) 6-month ZIKV NT80 titers. (G) ROC curves for predicting high-versus low-titer individuals using the late convalescent features associated with low 6-month ZIKV neutralizing antibody titers. (B, F, and G) The area under the curve (AUC) value and 95% CI for the features corresponding to each curve are colored by AUC value for each plot. N = 14 participants with 6-month ZIKV NT80 titer data available (anti-ZIKV IgM- at index visit).

Similar articles

Cited by

  • Comprehensive analysis of early T cell responses to acute Zika Virus infection during the first epidemic in Bahia, Brazil.
    Samri A, Bandeira AC, Gois LL, Silva CGR, Rousseau A, Corneau A, Tarantino N, Maucourant C, Queiroz GAN, Vieillard V, Yssel H, Campos GS, Sardi S, Autran B, Rios Grassi MF. Samri A, et al. PLoS One. 2024 May 9;19(5):e0302684. doi: 10.1371/journal.pone.0302684. eCollection 2024. PLoS One. 2024. PMID: 38722858 Free PMC article.
  • Zika virus: an overview update.
    de Jong HK, Grobusch MP. de Jong HK, et al. Curr Opin HIV AIDS. 2025 May 1;20(3):294-302. doi: 10.1097/COH.0000000000000926. Epub 2025 Mar 17. Curr Opin HIV AIDS. 2025. PMID: 40048580 Free PMC article. Review.
  • Combination immunotherapy induces post-intervention control of HIV.
    Peluso MJ, Sandel DA, Deitchman AN, Kim SJ, Dalhuisen T, Tummala HP, Tibúrcio R, Zemelko L, Borgo GM, Singh SS, Schwartz K, Deswal M, Williams MC, Hoh R, Shimoda M, Narpala S, Serebryannyy L, Khalili M, Vendrame E, SenGupta D, Whitmore LS, Tisoncik-Go J, Gale M Jr, Koup RA, Mullins JI, Felber BK, Pavlakis GN, Reeves JD, Petropoulos CJ, Glidden DV, Spitzer MH, Gama L, Caskey M, Nussenzweig MC, Chew KW, Henrich TJ, Yukl SA, Cohn LB, Deeks SG, Rutishauser RL. Peluso MJ, et al. Res Sq [Preprint]. 2025 Mar 19:rs.3.rs-6141479. doi: 10.21203/rs.3.rs-6141479/v1. Res Sq. 2025. PMID: 40166020 Free PMC article. Preprint.

References

    1. Abbink P, Larocca RA, De La Barrera RA, Bricault CA, Moseley ET, Boyd M, Kirilova M, Li Z, Ng’ang’a D, Nanayakkara O, et al. (2016). Protective efficacy of multiple vaccine platforms against Zika virus challenge in rhesus monkeys. Science 353, 1129–1132. 10.1126/science.aah6157. - DOI - PMC - PubMed
    1. Abbink P, Larocca RA, Visitsunthorn K, Boyd M, De La Barrera RA, Gromowski GD, Kirilova M, Peterson R, Li Z, Nanayakkara O, et al. (2017). Durability and correlates of vaccine protection against Zika virus in rhesus monkeys. Sci. Transl. Med 9, eaao4163. 10.1126/sci-translmed.aao4163. - DOI - PMC - PubMed
    1. Abbink P, Stephenson KE, and Barouch DH (2018). Zika virus vaccines. Nat. Rev. Microbiol 16, 594–600. 10.1038/s41579-018-0039-7. - DOI - PMC - PubMed
    1. Andrade P, Gimblet-Ochieng C, Modirian F, Collins M, Cárdenas M, Katzelnick LC, Montoya M, Michlmayr D, Kuan G, Balmaseda A, et al. (2019). Impact of pre-existing dengue immunity on human antibody and memory B cell responses to Zika. Nat. Commun 10, 938. 10.1038/s41467-019-08845-3. - DOI - PMC - PubMed
    1. Andrews SF, Chambers MJ, Schramm CA, Plyler J, Raab JE, Kanekiyo M, Gillespie RA, Ransier A, Darko S, Hu J, et al. (2019). Activation dynamics and Immunoglobulin evolution of pre-existing and newly generated human memory B cell responses to influenza hemagglutinin. Immunity 51, 398–410.e5. 10.1016/j.immuni.2019.06.024. - DOI - PubMed

Publication types