. 2022 Jun 9;185(12):2148-2163.e27.
doi: 10.1016/j.cell.2022.04.011. Epub 2022 May 17.

Zn-regulated GTPase metalloprotein activator 1 modulates vertebrate zinc homeostasis

Affiliations

Zn-regulated GTPase metalloprotein activator 1 modulates vertebrate zinc homeostasis

Andy Weiss et al. Cell. .

Abstract

Zinc (Zn) is an essential micronutrient and cofactor for up to 10% of proteins in living organisms. During Zn limitation, specialized enzymes called metallochaperones are predicted to allocate Zn to specific metalloproteins. This function has been putatively assigned to G3E GTPase COG0523 proteins, yet no Zn metallochaperone has been experimentally identified in any organism. Here, we functionally characterize a family of COG0523 proteins that is conserved across vertebrates. We identify Zn metalloprotease methionine aminopeptidase 1 (METAP1) as a COG0523 client, leading to the redesignation of this group of COG0523 proteins as the Zn-regulated GTPase metalloprotein activator (ZNG1) family. Using biochemical, structural, genetic, and pharmacological approaches across evolutionarily divergent models, including zebrafish and mice, we demonstrate a critical role for ZNG1 proteins in regulating cellular Zn homeostasis. Collectively, these data reveal the existence of a family of Zn metallochaperones and assign ZNG1 an important role for intracellular Zn trafficking.

Keywords: CBWD; COG0523; GTPase; METAP1; ZNG1; metallochaperone; metalloprotein; zf-C6H2; zinc; zinc finger.


Conflict of interest statement

Declaration of interests The authors declare no competing interests.

Figures

Figure 1.
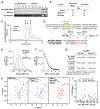
Figure 1.. Identification of metalloprotein targets of Zn regulated GTPase metalloprotein activator 1 (ZNG1) in vertebrates.
(A) Cladogram and analysis of ZNG1 protein sequence conservation in vertebrates. Numbers on branches denote nucleotide substitutions per site. (B) Amino acid conservation along the length of vertebrate ZNG1s indicates high sequence conservation particularly in the GTPase domains and at the N-terminus. Lighter shading reflects higher conservation. (C) Yeast-two-hybrid screens using full-length human, mouse, and zebrafish ZNG1s identify unique and shared interacting proteins. (D) Molecular function enrichment analysis of ZNG1 interaction protein PFAM domains. (E) Number and cellular activity of ZNG1 client Zn metalloproteins detected in yeast-two-hybrid screens. (F) ZNG1 zf interaction domains in Zn metalloproteins shown in E. (G) Conserved ZNG1 interaction domain of METAP1 across species overlaps with a C6H2 domain. Yellow shading indicates minimal conserved region. See also Figure S1 and Table S1.
Figure 2.
Figure 2.. ZNG1 interacts with METAP1 via a unique C6H2 Zn finger domain.
(A) Affinity chromatography of mouse (Mm) His-MBP-ZNG1 bound to amylose resin with purified Mm METAP1. Detection by SDS PAGE (top 2 panels) and immunoblot (bottom). W-wash, F-flow through, E-elution. (B) DLS analysis of full-length Mm ZNG1 and METAP1 shows complex formation in vitro. (C) Size exclusion chromatography of full-length Mm ZNG1 and METAP11-83. (D) Identification of a conserved N-terminal ‘CPELVPI’ motif in Mm, human (Hs), and zebrafish (Dr) ZNG1s and synthetic peptides. (E) Spectra of W45 fluorescence quenching of 3 μM METAP11-59 upon Mm ZNG1 N-terminus binding. (F) Peptide binding curve from (E) fit to a 1:1 binding model. (G) Measured affinities of METAP11-59 and METAP11-79 binding to Mm, Hs, and Dr ZNG1 N-termini. (H) 1H 15N HSQC NMR spectra of METAP11-59 alone (left), in complex with Mm ZNG1 N-terminal peptide (middle), and as N-terminal Mm ZNG1 peptide fusion (right). (I) Chemical shift perturbations in 15N METAP11-59 upon binding to Mm ZNG1 peptide. See also Figure S2.
Figure 3.
Figure 3.. NMR structure of METAP1-ZNG1 complex.
(A) 1H,15N NOE for the fusion (black) and free domain (red). (B) Structure of the 20 lowest-energy conformers of the Mm ZNG110-30 METAP11-59 fusion, colored by 1H,15N NOE. (C) Ribbon diagram of Mm ZNG110-30 METAP11-59 showing Zn coordination. (D) Stereo view of 20 lowest-energy conformers of Mm ZNG110-30 METAP11-59, colored by secondary structure, with helices in green, beta strands in purple, and peptide in blue. (E) Electrostatic surface map of the METAP11-59 peptide interface. (F) N-terminal ZNG1 motif among eukaryotic cluster 3 COG0523 proteins. See also Figure S3 and Table S2.
Figure 4.
Figure 4.. ZNG1 enhances METAP1 aminopeptidase activity in vitro.
(A) Representative titration of 1.0 μM METAP1, 1.0 μM quin-2 with Zn. (B) Representative titration of 1.3 μM ZNG1, 1.3 μM quin-2 with Zn. Solid lines are global fits of independent replicates; dashed lines are simulations of 10-fold greater and weaker affinities. (C) GTPase activity of ZNG1 with or without Zn and/or Zn2METAP1. (D) Initial rate of Met release from 750 μM MAHAIHY peptide by 20 nM METAP1 in different metalation states. (E) Activation of 10 μM Zn2METAP1 by 25 μM ZNG1 with or without Zn and 500 μM guanine nucleotides. (F) Activation of 10 μM Zn2METAP1 by 22.5 μM Zn or 25 μM ZnZNG1 with or without 500 μM guanine nucleotides, all with 250 μM NTA. In panels E and F, activation reactions were diluted to 20 nM METAP1 prior to monitoring cleavage of 750 μM MAHAIHY. (G) Mechanistic model of GTP hydrolysis-coupled Zn transfer from ZNG1 to the METAP1 active site. See also Figure S4.
Figure 5.
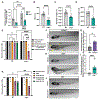
Figure 5.. zng1 mutant zebrafish display Zn-dependent sensitivity to Metap inhibition and phenocopy metap1 mutant larvae.
(A) zng1 expression levels measured by RT-qPCR in TPEN treated WT and zng1−/− mutant 6 dpf whole zebrafish larvae. (n=4 pools of 30 larvae per genotype / treatment group). (B-D) Height at anterior anal fin (HAA) (B), standard length (C), and snout to vent length (D) of zng1−/− and WT 6 dpf larvae. Each data point represents an individual larva. (E) Survival of WT and zng1−/− mutant larvae treated with Bengamide B and TPEN (n=3 groups of 5 larvae / genotype / treatment) over 3 days of treatment and terminating at 6 dpf. (F) Brightfield images of 6 dpf metap1 mutant larvae treated with 1 μM Bengamide B or vehicle control. Yellow arrows denote abnormal pathologies. Pericardial Edema (PCE), craniofacial defects (CD), yolk sack edema (YSE), and uninflated swim bladder (USB). Scale bars = 1 mm. (G) Quantification of gross pathology score of 6 dpf Bengamide B treated metap1 mutant and WT larvae. Pathology scores calculated as sum of each pathology indicated by the yellow arrows in panel F. Each data point represents an individual larva. (H) Brightfield images of 6 dpf zng1 mutant larvae treated with 500 nM Bengamide B or vehicle control. Scale bars = 1 mm. (I) Quantification of gross pathology score of 6 dpf Bengamide B treated zng1 mutant larvae as depicted above. (J) Brightfield images of 6 dpf WT larvae treated with 1 μM Bengamide B or vehicle control. Scale bars = 1mm. (K) Survival of WT and zng1−/− larvae treated with TNP-470 and TPEN (n=3 groups of 5 larvae / genotype / treatment) over 3 days of treatment and terminating at 6 dpf. Data in panels A, E, and K analyzed by two-way ANOVA with Tukey’s multiple comparison test. Data in panels B,C,D, G and I analyzed by Student’s t-test. See also Figure S5.
Figure 6.
Figure 6.. Zng1 mutant mice exhibit signatures of mitochondrial dysfunction on a Zn deficient diet.
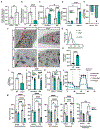
(A) Genotype distribution of WT, Zng1+/−, and Zng1−/− mice. Number of animals per genotype indicated in white text. (B) Percent weight gain of 5-7 week old WT and Zng1 mutant mice that were placed on a Zn-deficient diet for 6 weeks (n= 4-5 mice / genotype / sex). (C) Differential protein abundances from dissected kidneys of 11-13 week old female WT and Zng1 mutant mice that were maintained on a low Zn diet for 5 weeks. Proteins that putatively localize to the mitochondria are highlighted in red (n = 5 mice / genotype). (D) IPA analysis of differentially abundant proteins (Zng1−/−/WT) with significance of gene enrichment and number of differentially abundant proteins for each pathway depicted. z-scores are denoted within teal bars and indicate the predicted effects on each pathway (positive values: activation; negative values: inhibition, n.a.: no prediction through IPA available due to insufficient evidence in the Knowledge Base). Red bars indicate enriched proteins in Zng1 mutant animals and blue bars represent proteins with reduced abundance. Data in panel A analyzed by Chi-squared goodness of fit test. Data in panel B analyzed by two-way ANOVA with Sidak’s multiple comparison test within each sex. See also Figure S6 and Table S3.
Figure 7.
Figure 7.. ZNG1 regulates cellular respiration through stimulation of METAP activity.
(A) Expression of Zng1 in TKPTS cells treated with TPA. (B) Zng1 transcript levels in untreated WT and Zng1 mutant cells. (C-D) Cell proliferation quantified by CellTrace median fluorescence intensity (MFI) in Zn-deplete conditions (C) and following treatment with METAP2 inhibitor TNP-470 (D) using flow cytometry. (E) Ratio of processed 14-3-3γ protein levels in vehicle or TPA treated Zng1−/− /WT cells. (n = 4 / genotype / treatment). (F) Representative TEM images of WT and Zng1 mutant cells grown in Zn-deplete conditions (scale bars = 500 nm). Red box (top panel) outlines region of higher magnification (bottom panel). (G-H) Non-linear regression analysis of the size distribution of mitochondria (G) and mean signal intensity (H) in WT and Zng1 mutant cells treated with TPA. (WT n = 112 mitochondria, Zng1−/− n = 101 mitochondria). (I) ATP levels in cell lysates from untreated WT and Zng1 mutant cells. (J) Mitochondrial membrane potential (ΔΨm) in untreated and TPA treated cells. (K) Production of mitochondrial superoxide in cells treated with TNP-470 was quantified by flow cytometry. (L-M) Oxygen consumption rates (OCR) by cells treated with vehicle or TPA. OCR was normalized by cell number. Data in panels A, B, H, and I analyzed by Student’s t-test. Data in panel E analyzed by Welch’s t-test. Data in panel G analyzed by non-linear regression goodness of fit. Data in panels C, D, J, K, and M analyzed by two-way ANOVA with Tukey’s multiple comparison test. See also Figure S7 and Table S3.

Comment in

Similar articles

Cited by

References

    1. Addlagatta A, Hu X, Liu JO, and Matthews BW (2005). Structural basis for the functional differences between type I and type II human methionine aminopeptidases. Biochemistry 44, 14741–14749. - PubMed
    1. Andreini C, Banci L, Bertini I, and Rosato A (2006). Counting the zinc-proteins encoded in the human genome. J Proteome Res 5, 196–201. - PubMed
    1. Arfin SM, and Bradshaw RA (1988). Cotranslational processing and protein turnover in eukaryotic cells. Biochemistry 27, 7979–7984. - PubMed
    1. Ba LA, Doering M, Burkholz T, and Jacob C (2009). Metal trafficking: from maintaining the metal homeostasis to future drug design. Metallomics 1, 292–311. - PubMed
    1. Basu AK (2018). DNA Damage, Mutagenesis and Cancer. Int J Mol Sci 19. - PMC - PubMed

Publication types