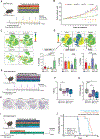
. 2023 Apr;72(4):736-748.
doi: 10.1136/gutjnl-2021-326514. Epub 2022 May 18.

Novel microenvironment-based classification of intrahepatic cholangiocarcinoma with therapeutic implications

Affiliations

Novel microenvironment-based classification of intrahepatic cholangiocarcinoma with therapeutic implications

Miguel A Martin-Serrano et al. Gut. 2023 Apr.

Abstract

Objective: The diversity of the tumour microenvironment (TME) of intrahepatic cholangiocarcinoma (iCCA) has not been comprehensively assessed. We aimed to generate a novel molecular iCCA classifier that incorporates elements of the stroma, tumour and immune microenvironment ('STIM' classification).

Design: We applied virtual deconvolution to transcriptomic data from ~900 iCCAs, enabling us to devise a novel classification by selecting for the most relevant TME components. Murine models were generated through hydrodynamic tail vein injection and compared with the human disease.

Results: iCCA is composed of five robust STIM classes encompassing both inflamed (35%) and non-inflamed profiles (65%). The inflamed classes, named immune classical (~10%) and inflammatory stroma (~25%), differ in oncogenic pathways and extent of desmoplasia, with the inflammatory stroma showing T cell exhaustion, abundant stroma and KRAS mutations (p<0.001). Analysis of cell-cell interactions highlights cancer-associated fibroblast subtypes as potential mediators of immune evasion. Among the non-inflamed classes, the desert-like class (~20%) harbours the lowest immune infiltration with abundant regulatory T cells (p<0.001), whereas the hepatic stem-like class (~35%) is enriched in 'M2-like' macrophages, mutations in IDH1/2 and BAP1, and FGFR2 fusions. The remaining class (tumour classical: ~10%) is defined by cell cycle pathways and poor prognosis. Comparative analysis unveils high similarity between a KRAS/p19 murine model and the inflammatory stroma class (p=0.02). The KRAS-SOS inhibitor, BI3406, sensitises a KRAS-mutant iCCA murine model to anti-PD1 therapy.

Conclusions: We describe a comprehensive TME-based stratification of iCCA. Cross-species analysis establishes murine models that align closely to human iCCA for the preclinical testing of combination strategies.

Keywords: cholangiocarcinoma; gene expression; immune response; immunotherapy; molecular biology.


Conflict of interest statement

Competing interests: JML is receiving research support from Bayer HealthCare Pharmaceuticals, Eisai Inc, Bristol-Myers Squibb, Boehringer-Ingelheim and Ipsen, and consulting fees from Eli Lilly, Bayer HealthCare Pharmaceuticals, Bristol-Myers Squibb, Eisai Inc, Celsion Corporation, Exelixis, Merck, Ipsen, Genentech, Roche, Glycotest, Nucleix, Sirtex, Mina Alpha Ltd and AstraZeneca. AV has received consulting fees from Genentech, Guidepoint, Fujifilm, Boehringer Ingelheim, FirstWord, and MHLife Sciences; advisory board fees from Exact Sciences, Nucleix, Gilead and NGM Pharmaceuticals; and research support from Eisai.

Figures
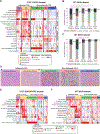
Figure 1
Figure 1
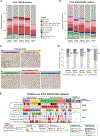
Identification of the STIM classes of iCCA. (A) Consensus-clustered heatmap in the training dataset (ICGC Japan) using the most representative TME-related components. Semiquantitative evaluation of the immune (B) and stromal infiltration (C) in the STIM classes (*p<0.05). (D) Representative H&E-stained images. Images were captured with ×200. Heatmaps summarise the main features of the STIM classes in the (E) ICGC SINGAPORE and (F) MT SINAI datasets. iCCA, intrahepatic cholangiocarcinoma; STIM, stroma, tumour, immune microenvironment; TME, tumour microenvironment.
Figure 2
Figure 2
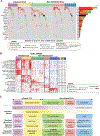
The STIM classes present different intratumour immune composition. Intratumour immune deconstruction of the STIM classes via CibersortX in the (A) ICGC JAPAN and (B) SINGAPORE cohorts. (C) Representative images of samples of the distinct STIM classes stained with an anti-CD8a antibody. Images were captured with ×200. (D) Quantification of staining intensities for FOXP3 (immune cells only) in the distinct STIM classes. (E) Heatmap representation of the overlap between our STIM classes and previously reported classes of iCCA (first two rows in black rounded rectangle), eCCA (orange rounded rectangle) and HCC (green rounded rectangle). Coloured asterisks on the right indicate significant enrichment in the corresponding class. iCCA, intrahepatic cholangiocarcinoma; eCCA, extrahepatic cholangiocarcinoma; HCC, hepatocellular carcinoma; STIM, stroma, tumour, immune microenvironment.
Figure 3
Figure 3
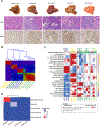
CAF subtypes represent potential mediators of immune evasion. (A) Colour-coded uMAP representation of the distinct CAF subtypes. (B) tSNE plots colour-coded for the expression of markers genes in each CAF cluster. (C) Immunofluorescence staining for POSTN and CK19 (mCAF) and CTSK and CK19 (imCAF). (D) Dot plot showing expression of POST and CTSK in the CAF subtypes and other TME cells. (E) Hierarchical clustering of correlation matrix among the distinct CAF signatures, IPRES and ECM and TGFβ related signatures. (F) EMT-related ligand receptors interactions between CAFs and malignant epithelial cells. (G) Heatmap representation of cell–cell interactions frequencies between CAF subtypes and other cells of the TME. (H) Dot plot showing unique receptor–ligand pair interactions inferred between the imCAFs and other cells of the TME. Pearson correlation between CCL5 expression and (I) NK and (J) T cell abundance. ECM, extracellular matrix; TME, tumour microenvironment.
Figure 4
Figure 4
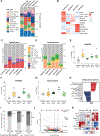
Association of the STIM classes with mutations and chromosomal instability. (A) Heatmap representation of mutations in driver genes. (B) Heatmap representation of the ssGSEA enrichment score for the Hallmark gene sets in the ICGC JAPAN dataset. (C) The graph summarises the main immune-related, stroma-related and tumour-related features of the five STIM classes. Candidate therapeutic opportunities (bottom row) are recommended based on: (1) preclinical evidence presented in this manuscript (in bold) or (2) molecular and immune characteristics of each class. iCCA, intrahepatic cholangiocarcinoma; STIM, stroma, tumour, immune microenvironment.
Figure 5
Figure 5
Available murine models of iCCA recapitulate the inflammatory stroma and the hepatic stem-like classes. (A) Representative images (H&E and CK19-stained, ×100) of healthy liver and murine iCCA tumours. (B) Unsupervised clustering of RNA-Seq data. (C) Heatmap representation of the ssGSEA enrichment score for the Hallmark pathways. Characteristic pathways of each human class are indicated by a coloured bar on the right of the heatmap. (D) Submap analysis between the human STIM classes and the murine tumours. iCCA, intrahepatic cholangiocarcinoma; STIM, stroma, tumour, immune microenvironment.
Figure 6
Figure 6
YAP1 signalling mediates macrophage recruitment. (A) Comparison of lineage proportions between healthy livers and murine tumours (CytOF). (B) Heatmap summarising the average of the percentage of immune cells (Z score) in the total CD45+ cells. (C–D) Comparison of lineage proportions between healthy livers and murine tumours (flow cytometry). (E–G) Myeloid populations (percentage of CD45+) in healthy livers and tumours. (H) Top signatures positively (red) or negatively (blue) enriched in human KRAS-mutant tumours. (I) Quantification of staining intensities for CD68 in 40 iCCAs. (J) Volcano plots of genes differentially expressed between YAP1/AKT1 and other murine tumours. (K) Heatmap of the expression levels for Yap1, Pdgf-d and other representative genes in sorted cells on YAP1 activation in tetOYAP mice generated in ref . *p<0.05. G-MDSCs, granulocytic myeloid-derived suppressor cells; HSC, hepatic stellate cells; iCCA, intrahepatic cholangiocarcinoma; KC, Kupffer cells; mDCs, myeloid dendritic cells; M-MDSC, monocytic myeloid-derived suppressor cells; NES, Normalised Enrichment Score; NK, natural killer.
Figure 7
Figure 7
In vivo antitumoural effect of rationale combination immunotherapies. (A) Experimental treatment scheme in the subcutaneous model with KAP cells (KRAS mutant). (B) Tumour growth of mice injected subcutaneously and treated with the KRAS inhibitor BI-3406, anti-PD1 monoclonal antibody (MoAb) or the combination for 14 days. (C) Heatmaps of t-Stochastic neighbour embedding (t-SNE) plot showing expression of CD45+ cells measured by flow cytometry in four mice per each treatment arm. (D) Heatmaps of t-SNE plot showing expression of thrree selected markers (CD8+, CD4+, Foxp3+, top panel) uncover immune cell changes induced by single agents versus combo; scale is indicated. Bottom panel: percentage of proliferating CD8+ cells (CD8+NK1.1+ panel), memory CD8+ (CD8+CD44+ panel) and Tregs (bottom right) in the four treatment arms (n=4 mice/arm); bars indicate SE. (E) Experimental treatment scheme in the HTVI model YAP1/AKT1. (F) Liver body ratio (LBR) of mice injected with YAP1 and AKT1 plasmids and treated with tivozanib, anti-PD1 moAb or combination. (G) Quantification of CK19 stained area as readout of tumorous growth in mice enrolled in one of the four arms. *<0.05; **<0.01; ***<0.001. (H). Representative images of liver from mice treated with placebo, tivozanib, anti-PD1 or combo (scans at 20×). (I) Experimental treatment scheme in the HTVI model NICD1/AKT1. (J) Survival curves of the four treatment arms. *<0.05; **<0.01; ***<0.001; ****<0.0001; n.s., non-significant. Tregs, regulatory T cells.

Comment in

References

    1. Banales JM, Marin JJG, Lamarca A, et al. Cholangiocarcinoma 2020: the next horizon in mechanisms and management. Nat Rev Gastroenterol Hepatol 2020;17:557–88. - PMC - PubMed
    1. Khan SA, Tavolari S, Brandi G. Cholangiocarcinoma: epidemiology and risk factors. Liver Int 2019;39 Suppl 1:19–31. - PubMed
    1. Abou-Alfa GK, Sahai V, Hollebecque A, et al. Pemigatinib for previously treated, locally advanced or metastatic cholangiocarcinoma: a multicentre, open-label, phase 2 study. Lancet Oncol 2020;21:671–84. - PMC - PubMed
    1. Makawita S K Abou-Alfa G, Roychowdhury S, et al. Infigratinib in patients with advanced cholangiocarcinoma with FGFR2 gene fusions/translocations: the PROOF 301 trial. Future Oncol 2020;16:2375–84. - PubMed
    1. Abou-Alfa GK, Pandya SS, Zhu AX. Ivosidenib for advanced IDH1-mutant cholangiocarcinoma - Authors’ reply. Lancet Oncol 2020;21:e371. - PubMed

Publication types

MeSH terms

Substances