. 2022 Jun 1;9(3):ENEURO.0289-21.2022.
doi: 10.1523/ENEURO.0289-21.2022. Print 2022 May-Jun.

Granule Cells Constitute One of the Major Neuronal Subtypes in the Molecular Layer of the Posterior Cerebellum

Affiliations

Granule Cells Constitute One of the Major Neuronal Subtypes in the Molecular Layer of the Posterior Cerebellum

Moushumi R Dey et al. eNeuro. .

Abstract

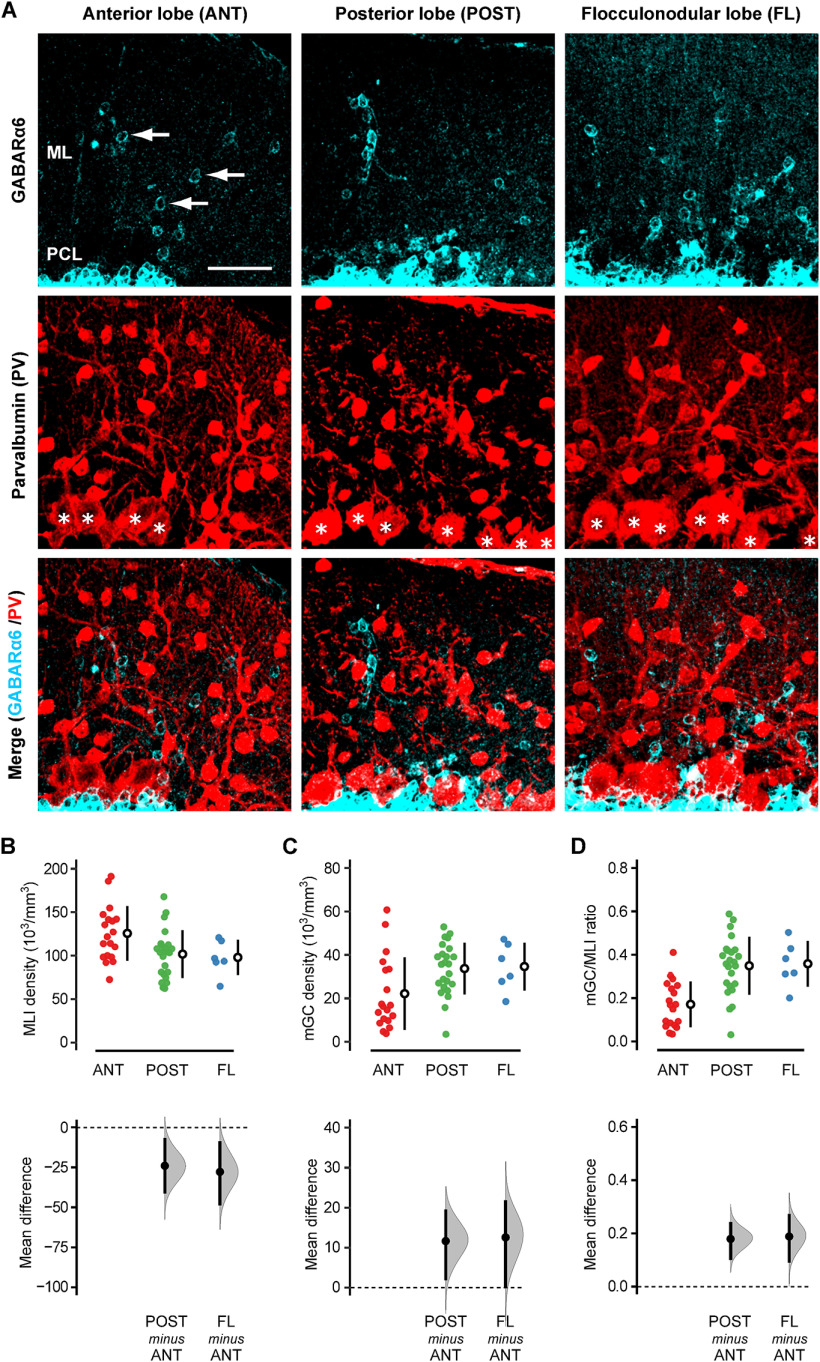
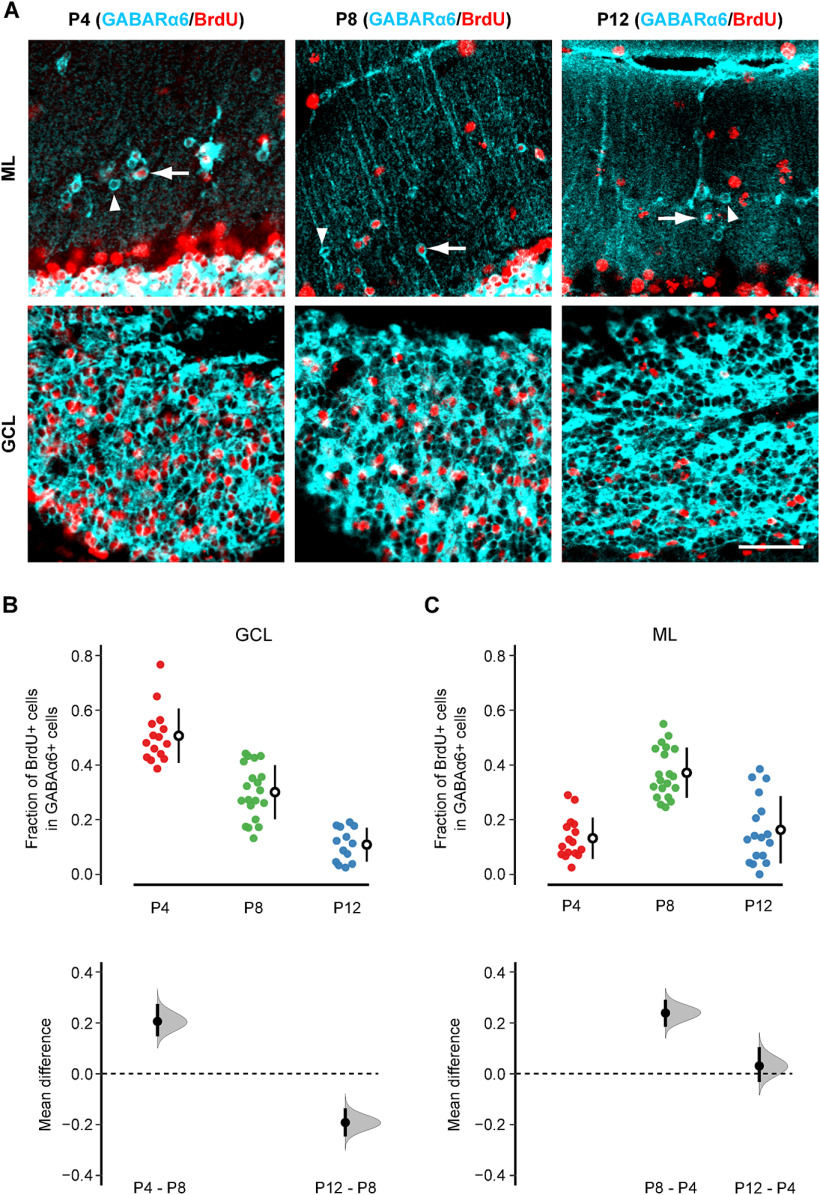
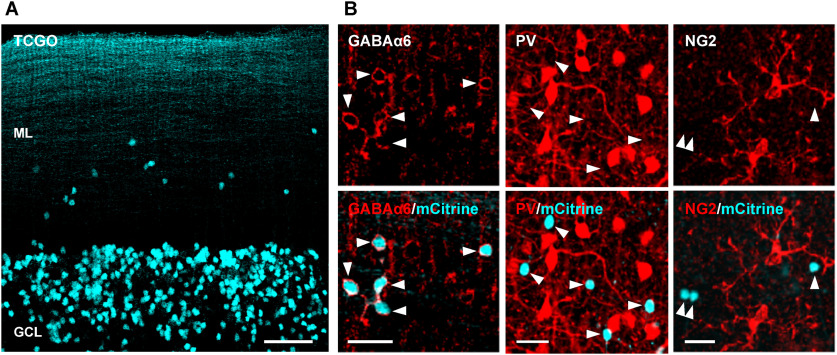
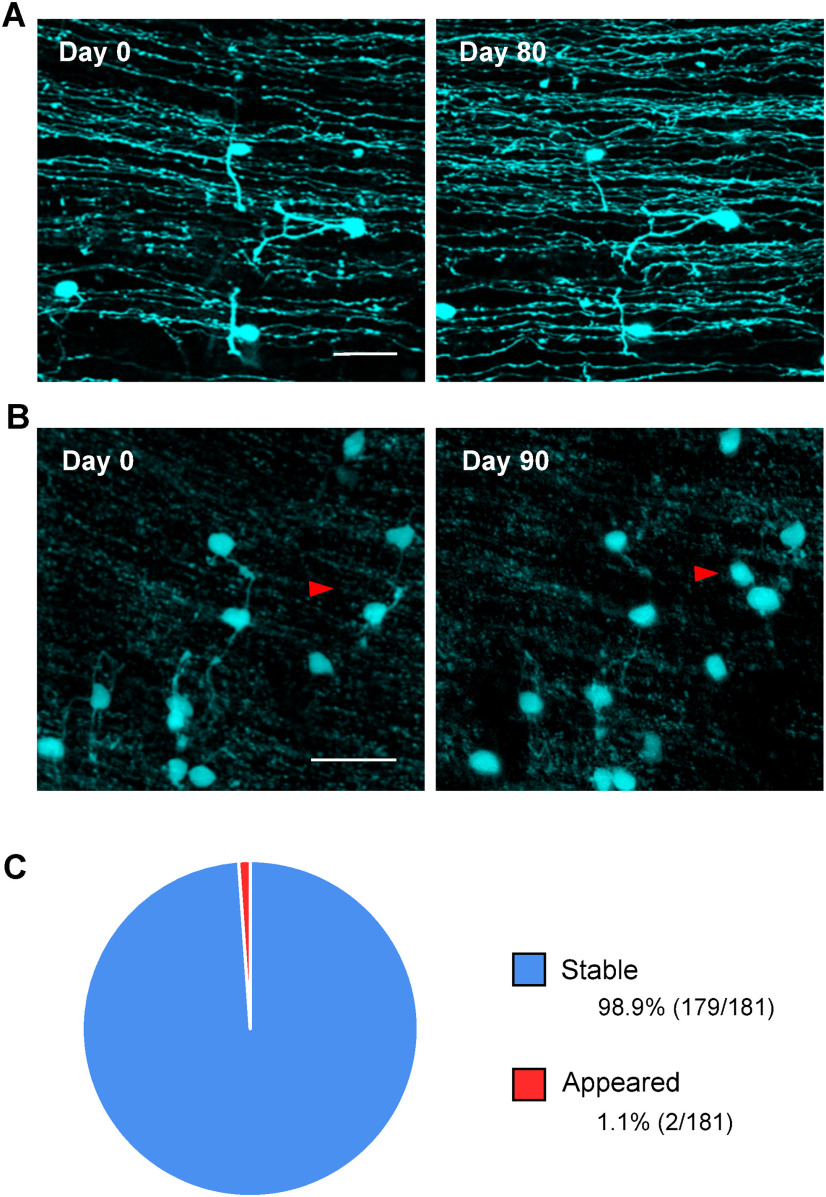
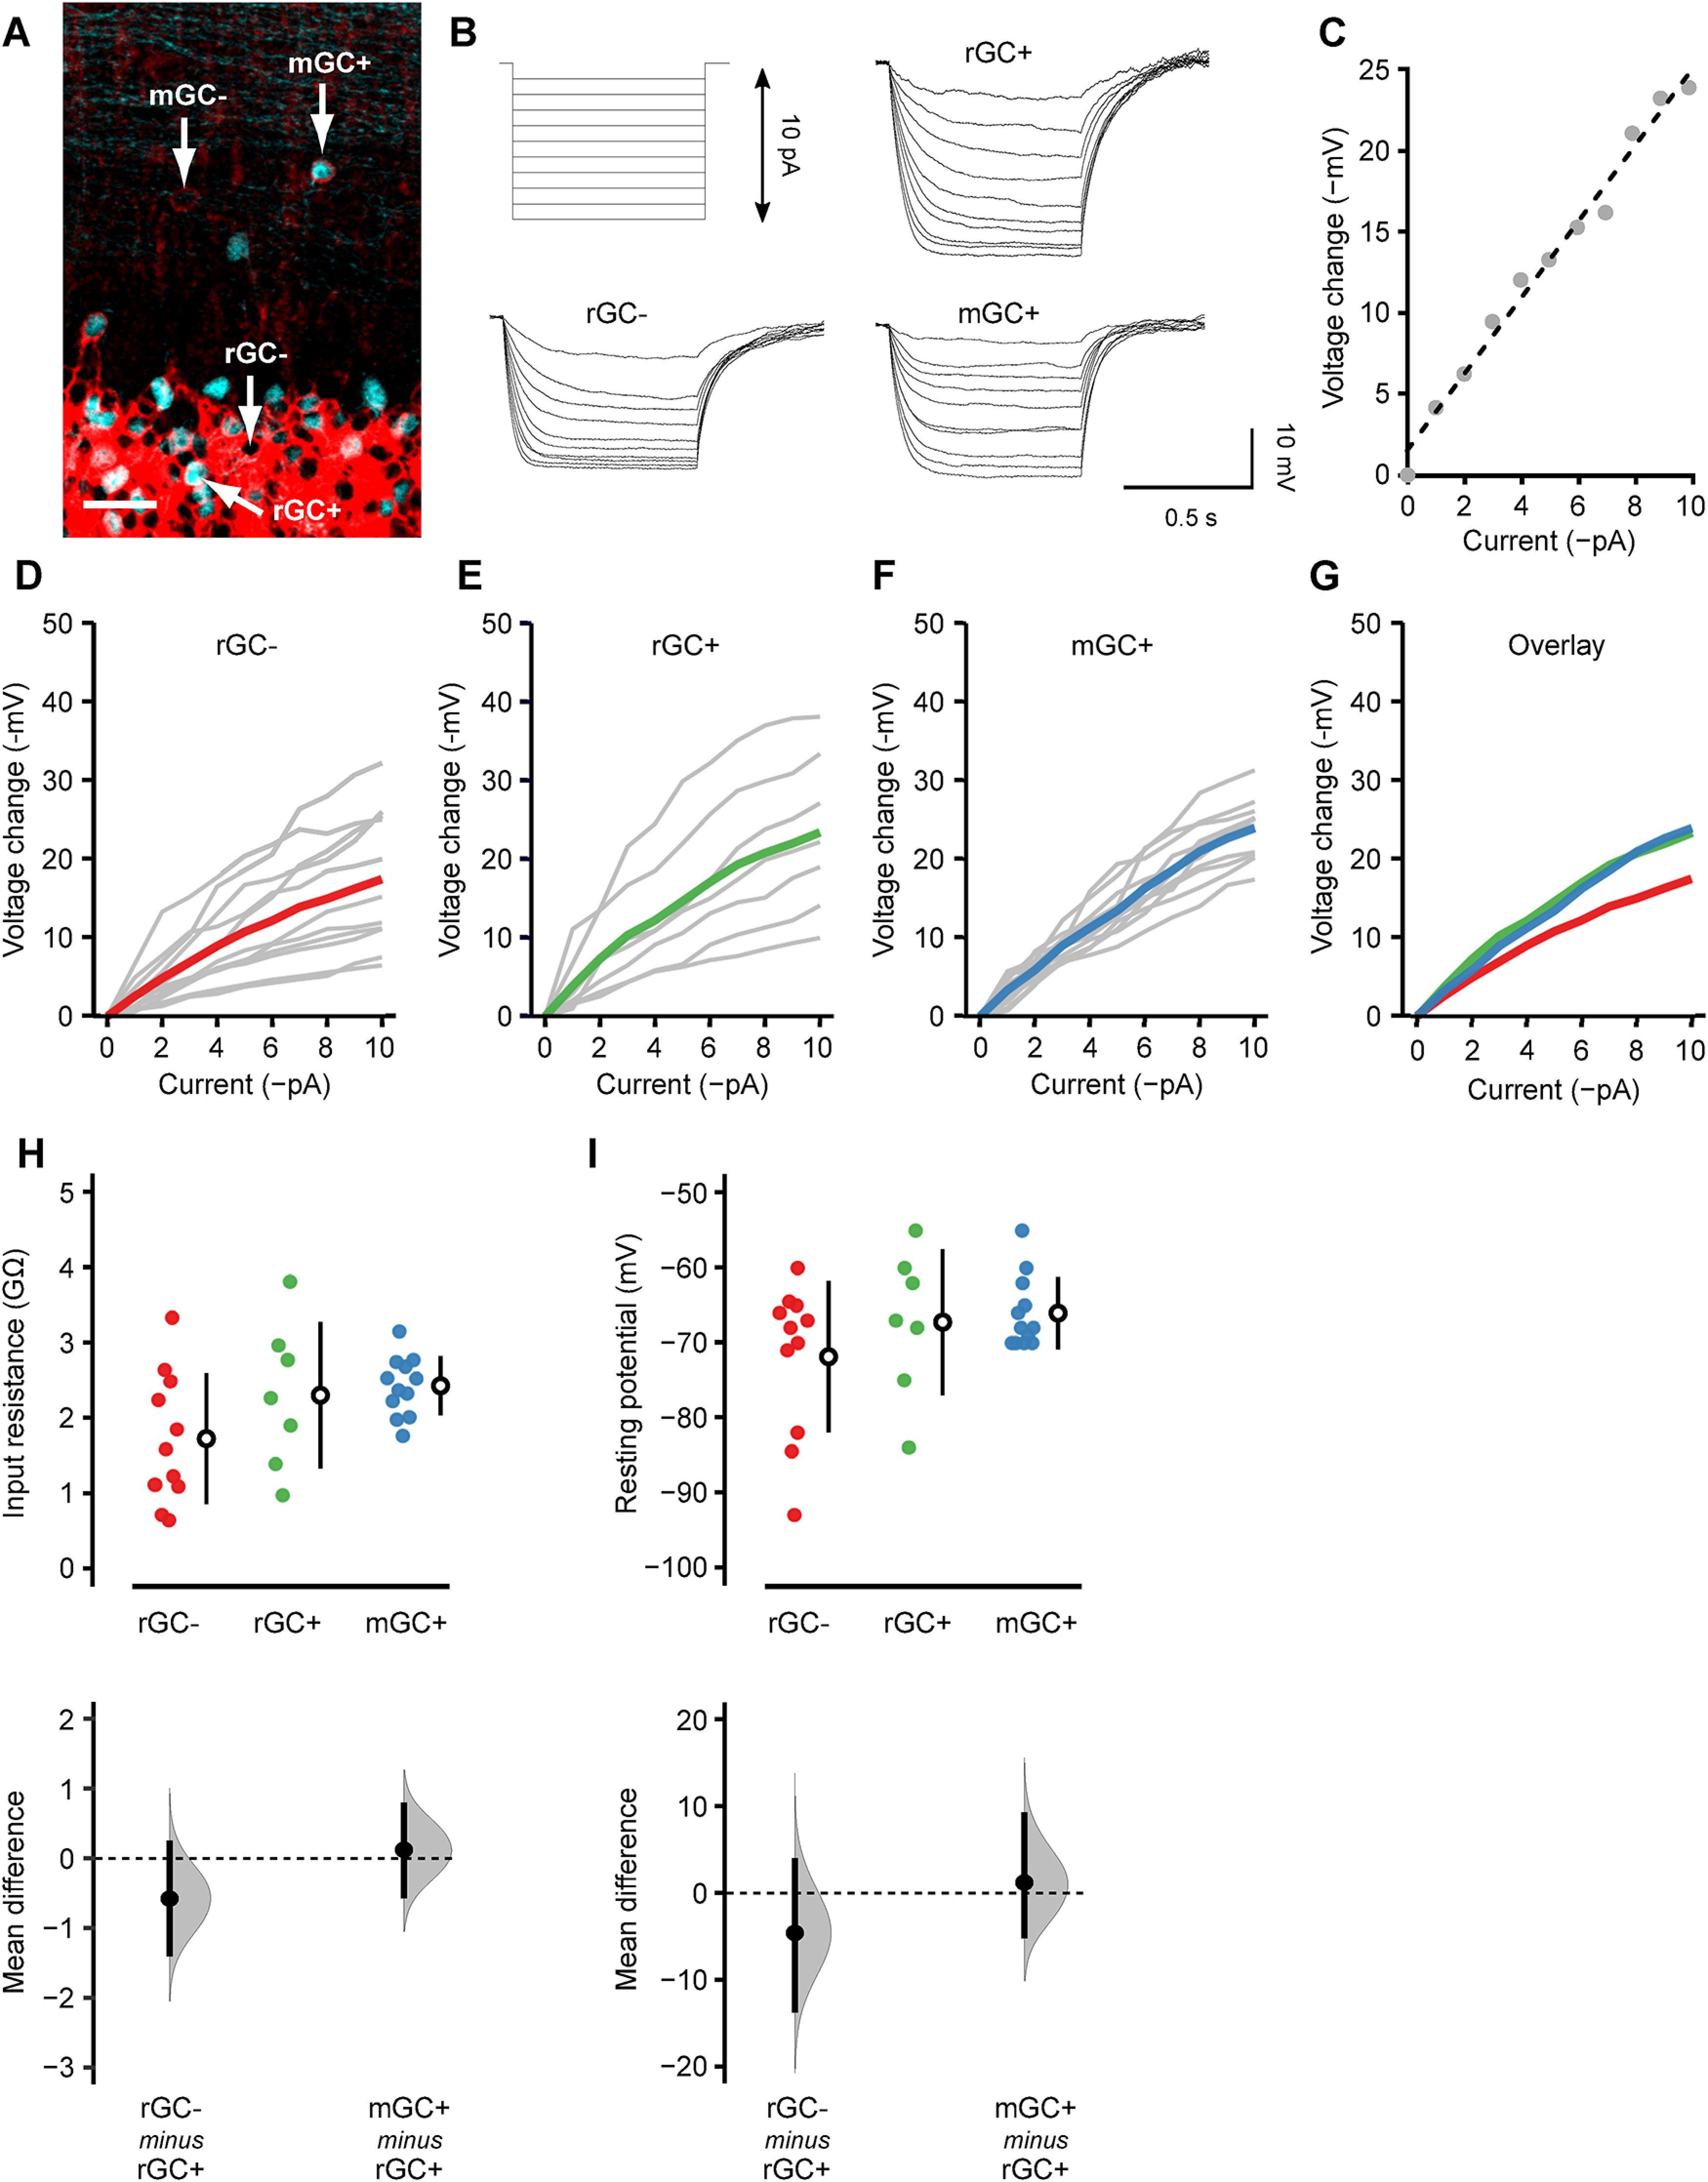
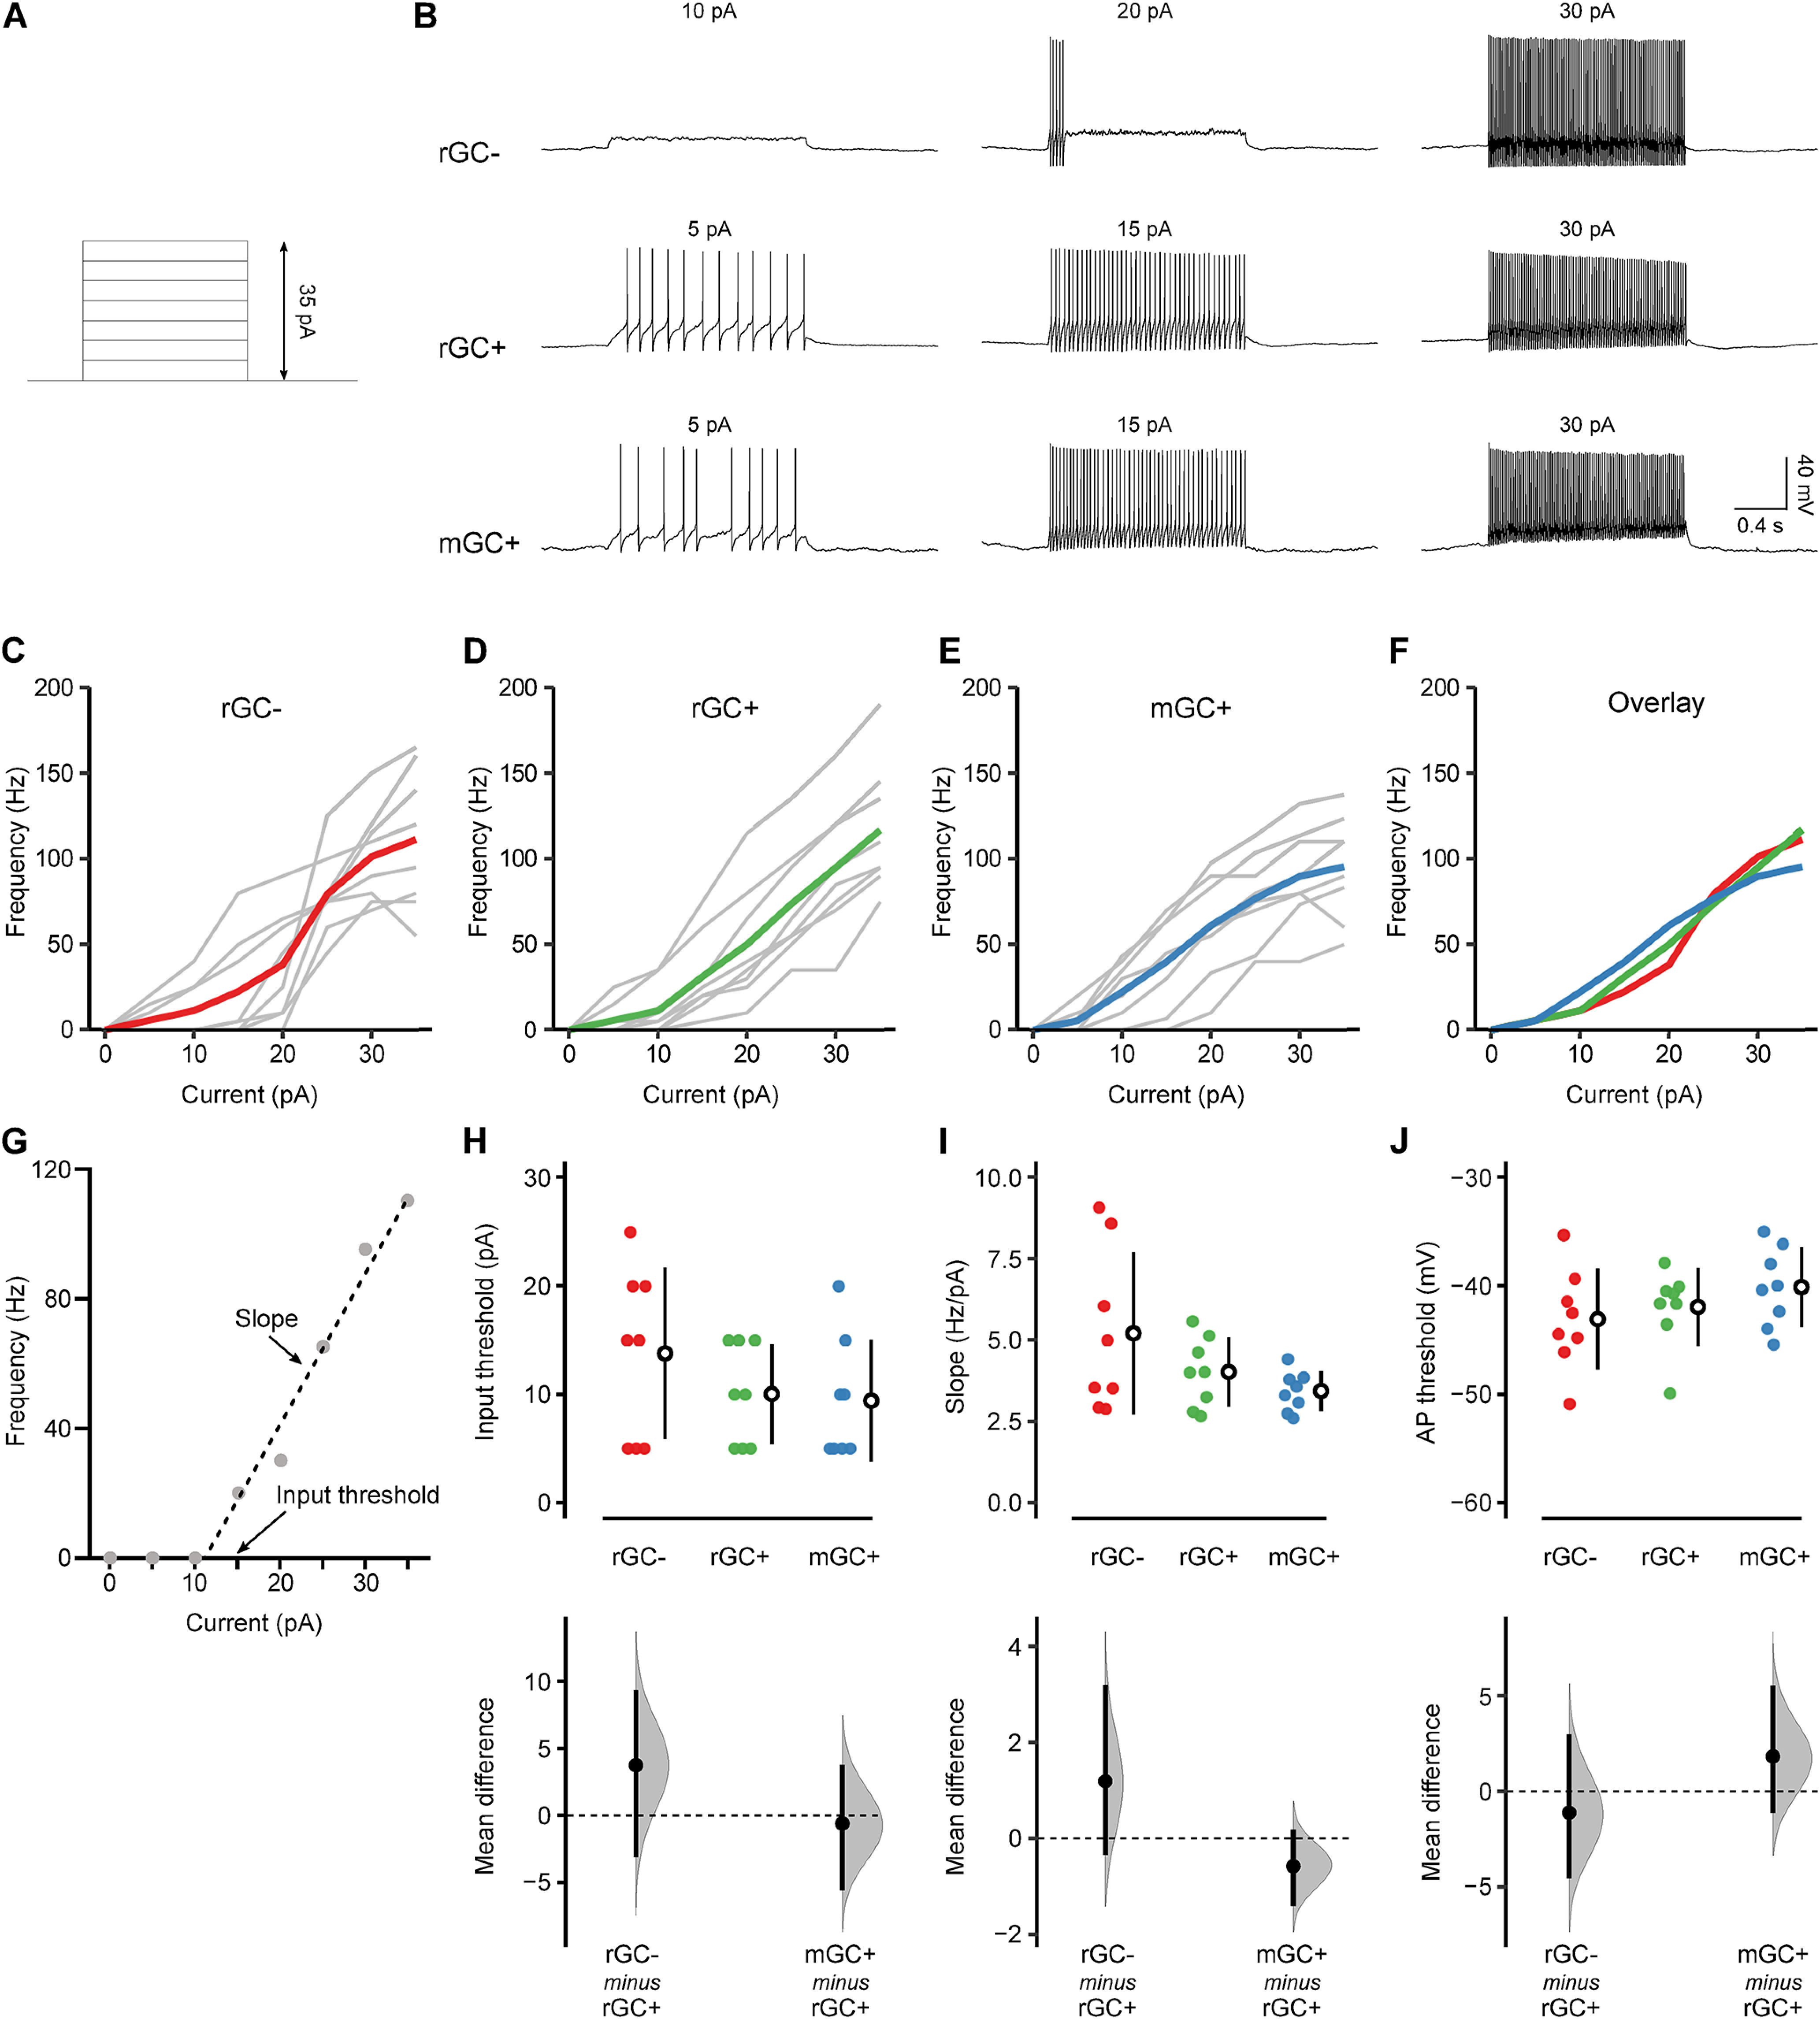
The migration of neurons from their birthplace to their correct destination is one of the most crucial steps in brain development. Incomplete or incorrect migration yields ectopic neurons, which cause neurologic deficits or are negligible at best. However, the granule cells (GCs) in the cerebellar cortex may challenge this traditional view of ectopic neurons. When animals are born, GCs proliferate near the pia mater and then migrate down to the GC layer located deep in the cerebellar cortex. However, some GC-like cells stay in the molecular layer, a layer between the pia mater and GC layer, even in normal adult animals. These cells were named ectopic GCs nearly 50 years ago, but their abundance and functional properties remain unclear. Here, we have examined GCs in the molecular layer (mGCs) with a specific marker for mature GCs and transgenic mice in which GCs are sparsely labeled with a fluorescent protein. Contrary to the previous assumption that mGCs are a minor neuronal population, we have found that mGCs are as prevalent as stellate or basket cells in the posterior cerebellum. They are produced during a similar period as regular GCs (rGCs), and in vivo time-lapse imaging has revealed that mGCs are stably present in the molecular layer. Whole-cell patch-clamp recordings have shown that mGCs discharge action potentials similarly to rGCs. Since axonal inputs differ between the molecular layer and GC layer, mGCs might be incorporated in different micro-circuits from rGCs and have a unique functional role in the cerebellum.

Keywords: cerebellum; development; ectopic neurons; granule cells; migration.


Figures

Figure 1.
Figure 1.
Immunohistochemical detection of mGCs and MLIs. A, The sagittal cerebellar slices of B6 mice were double-stained with antibodies for GABAARα6 (cyan, top row) and PV (red, middle row). The merged images are shown in the bottom row. Note that GABAARα6 signals do not colocalize with the somata of PV-positive cells. The left, middle, and right columns show examples taken from the anterior lobe (ANT; Lobules I–V), posterior lobe (POST; Lobules VI–IX), and flocculonodular lobe (FL; lobule X), respectively. The arrows in the top row indicate examples of mGCs. The asterisks in the middle row indicate Purkinje cell somata. ML, molecular layer; PCL, Purkinje cell layer. Scale bar: 40 μm. B–D, The density of MLIs (B), mGCs (C), and the mGC/MLI ratio (D) were quantified in each lobe, and the mean differences between ANT versus POST and ANT versus FL were estimated by bootstrap resampling. In the top panels, the closed circles indicate individual FOVs taken from ANT (red; n = 19), POST (green; n = 24), and FL (blue; n = 6) of four mice. The open circles and vertical lines indicate the mean and standard deviation (SD), respectively. In the bottom panels, the gray curves indicate the resampled distribution of the mean difference between ANT versus POST (POST minus ANT) and ANT versus FL (FL minus ANT). The closed black circles and vertical lines indicate the observed mean difference and 95% confidence interval, respectively. The horizontal dashed line is the line of zero mean difference. The statistical significance (p < 0.05) is assessed whether the 95% confidence interval includes this zero-line or not. Furthermore, the sharpness of the resampled distribution (relative to the mean difference) and the proximity of the confidence interval to the zero-line allow us to infer the certainty of the difference. All the estimation graphics used in this study have the same structure.
Figure 2.
Figure 2.
BrdU cell proliferation assay. A, Representative images of BrdU (red) and GABAARα6 (cyan) double staining in the normal adult cerebellum. The top and bottom rows indicate the images taken from the molecular layer (ML) and GC layer (GCL), respectively. BrdU was injected at P4 (left column), P8 (middle column), or P12 (right column). The arrows indicate examples of BrdU-positive mGCs, whereas the arrowheads indicate examples of BrdU-negative mGCs. Scale bar: 40 μm. B, C, The fraction of BrdU-positive cells in GABAARα6-positive cells was quantified in the GCL (B) and ML (C), and the mean differences between the BrdU injection days were estimated by bootstrap resampling. In the top panels, the closed circles indicate individual FOVs obtained from P4 injection (red; n = 15 for GCL, 16 for ML from 4 mice), P8 injection (green, n = 20 for GCL, 20 for ML from 5 mice), and P12 injection (blue; n = 13 for GCL, 17 for ML from 4 mice). The open circles and vertical lines indicate the mean and SD, respectively. In the bottom panels, the estimated mean differences between P8 versus P4 (P4 – P8) and P8 versus P12 (P12 – P8) are shown for the GCL (B), and the estimated mean differences between P4 versus P8 (P8 – P4) and P4 versus P12 (P12 – P4) are shown for the ML (C). The gray curves indicate the resampled distribution of the mean difference. The closed black circles and vertical lines indicate the observed mean difference and 95% confidence interval, respectively. The horizontal dashed line is the line of zero mean difference.
Figure 3.
Figure 3.
mCitrine exclusively labels mGCs in the molecular layer of TCGO mice. A, The cerebellar cortex of TCGO mice. mCitrine-expressing cells (cyan) are seen in the molecular layer (ML) and GCs layer (GCL). Scale bar: 50 μm. B, The molecular layer of TCGO mice was immunostained with antibodies for GABAARα6 (left column), PV (middle column), or NG2 (right column). The merged images (bottom row) show the mCitrine signal and the antibody signal in cyan and red, respectively. The arrowheads indicate the location of mCitrine-expressing cells. Note that mCitrine-expressing cells are co-labeled only with the anti-GABAARα6 antibody. Scale bar: 20 μm.
Figure 4.
Figure 4.
Long-term time-lapse in vivo imaging of mGCs. A, B, Representative images of mGCs in vivo. Images taken on the first day of imaging (day 0) are compared with the image taken 80 d later (A) and 90 d later (B). Axons running laterally in the images are parallel fibers. Red arrowheads in B indicate the mGC that did not exist on day 0 but appeared on day 90. Note that the images are maximum projections; hence, a small angular difference in the optical axis sometimes causes false changes in the projected images. The appearance of the mGC, indicated by the red arrowheads, was confirmed in the z-stack. Scale bar: 20 μm. C, The fractions of stable and newly appeared mGCs were quantified in 181 mGCs (from 10 mice) that were imaged longer than one month. Only two mGCs appeared, and no mGC disappeared. Scale bar: 20 μm.
Figure 5.
Figure 5.
Passive membrane properties of mGCs. A, GABAARα6 (red) and mCitrine (cyan) double-labeling in a fixed tissue to show the identity of recorded cells. Whole-cell current-clamp recordings were made from rGC– (mCitrine-nonexpressing rGC), rGC+ (mCitrine-expressing rGC), and mGC+ (mCitrine-expressing mGC). mGC– (mCitrine-nonexpressing mGC) is invisible in living tissues, thus not recorded. Scale bar: 20 μm. B, Hyperpolarizing current steps (1-pA increment) injected into the cells (top, left) and the resultant membrane hyperpolarization in a rGC– (bottom, left), rGC+ (top, right), and mGC+ (bottom, right). C, A representative current–voltage (I–V) relationship (gray dots) and the linear regression line (dashed line). The input resistance of each cell was obtained as the slope of this linear regression line. D–F, The I–V relationship of rGC– (D), rGC+ (E), and mGC+ (F). Gray lines represent individual cells, and the colored lines represent the population average. G, The population averages of rGC– (red), rGC+ (green), and mGC+ (blue) are overlayed. H, I, The input resistance (H) and resting membrane potential (I) of rGC– (red; n = 11), rGC+ (green; n = 7), and mGC+ (blue; n = 12) were shown, and the mean differences between rGC+ versus rGC– and rGC+ versus mGC+ were estimated by bootstrap resampling. In the top panels, the closed circles indicate individual cells. The open circles and vertical lines indicate the mean and SD, respectively. In the bottom panels, the gray curves indicate the resampled distribution of the mean difference between rGC+ versus rGC– (rGC– minus rGC+) and rGC+ versus mGC+ (mGC+ minus rGC+). The closed black circles and vertical lines indicate the observed mean difference and 95% confidence interval, respectively. The horizontal dashed line is the line of zero mean difference.
Figure 6.
Figure 6.
Excitability of mGCs. A, Depolarizing current steps (5-pA increment) injected into the cells. B, The action potential discharge in a rGC– (top), rGC+ (middle), and mGC+ (bottom) on current injection. The amplitude of the injected current is shown above each trace. C–E, The frequency of action potential discharge as a function of injected current in rGC– (C), rGC+ (D), and mGC+ (E). Gray lines represent individual cells, and the colored lines represent the population average. F, The population averages of rGC– (red), rGC+ (green), and mGC+ (blue) are overlayed. G, A representative current-frequency relationship (gray dots) and the linear regression line (dashed line). The linear fit was performed between the maximum current that did not evoke action potential (10 pA in this cell) and the current that elicited the highest frequency of action potentials (35 pA in this cell). The input threshold is the minimum current that evoked action potentials (15 pA in this cell). H–J, The input threshold (H), the slope of the linear regression line (I), and action potential threshold (J) of rGC– (red; n = 8), rGC+ (green; n = 8), and mGC+ (blue; n = 8) were shown, and the mean differences between rGC+ versus rGC– and rGC+ versus mGC+ were estimated by bootstrap resampling. In the top panels, the closed circles indicate individual cells. The open circles and vertical lines indicate the mean and SD, respectively. In the bottom panels, the gray curves indicate the resampled distribution of the mean difference between rGC+ versus rGC– (rGC– minus rGC+) and rGC+ versus mGC+ (mGC+ minus rGC+). The closed black circles and vertical lines indicate the observed mean difference and 95% confidence interval, respectively. The horizontal dashed line is the line of zero mean difference.

References

    1. Altman J (1972) Postnatal development of the cerebellar cortex in the rat. 3. Maturation of the components of the granular layer. J Comp Neurol 145:465–513. 10.1002/cne.901450403 - DOI - PubMed
    1. Altman J, Bayer SA (1996) Development of the cerebellar system: in relation to its evolution, structure, and functions, Ed 1. Boca Raton: CRC-Press.
    1. Apps R, Hawkes R (2009) Cerebellar cortical organization: a one-map hypothesis. Nat Rev Neurosci 10:670–681. 10.1038/nrn2698 - DOI - PubMed
    1. Apps R, Hawkes R, Aoki S, Bengtsson F, Brown AM, Chen G, Ebner TJ, Isope P, Jörntell H, Lackey EP, Lawrenson C, Lumb B, Schonewille M, Sillitoe RV, Spaeth L, Sugihara I, Valera A, Voogd J, Wylie DR, Ruigrok TJH (2018) Cerebellar modules and their role as operational cerebellar processing units. Cerebellum 17:654–682. 10.1007/s12311-018-0952-3 - DOI - PMC - PubMed
    1. Bastianelli E (2003) Distribution of calcium-binding proteins in the cerebellum. Cerebellum 2:242–262. 10.1080/14734220310022289 - DOI - PubMed

Publication types

LinkOut - more resources