. 2022 May 18;13(1):2750.
doi: 10.1038/s41467-022-30394-5.

Tempo and drivers of plant diversification in the European mountain system

Collaborators, Affiliations

Tempo and drivers of plant diversification in the European mountain system

Jan Smyčka et al. Nat Commun. .

Abstract

There is still limited consensus on the evolutionary history of species-rich temperate alpine floras due to a lack of comparable and high-quality phylogenetic data covering multiple plant lineages. Here we reconstructed when and how European alpine plant lineages diversified, i.e., the tempo and drivers of speciation events. We performed full-plastome phylogenomics and used multi-clade comparative models applied to six representative angiosperm lineages that have diversified in European mountains (212 sampled species, 251 ingroup species total). Diversification rates remained surprisingly steady for most clades, even during the Pleistocene, with speciation events being mostly driven by geographic divergence and bedrock shifts. Interestingly, we inferred asymmetrical historical migration rates from siliceous to calcareous bedrocks, and from higher to lower elevations, likely due to repeated shrinkage and expansion of high elevation habitats during the Pleistocene. This may have buffered climate-related extinctions, but prevented speciation along elevation gradients as often documented for tropical alpine floras.


Conflict of interest statement

The authors declare no competing interests.

Figures
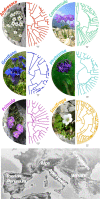
Fig. 1
Fig. 1. Map of the European mountain system depicting the five major geographic regions and the six mountain plant lineages that notably diversified in European mountains.
84% of all species from these lineages was sampled in this study and we sampled across all five mountain regions. The colors used for the six different phylogenies are used accordingly throughout following figures. The timescale unit of phylogenetic branch lengths is Ma. The background map is adapted from maps-for-free.com.
Fig. 2
Fig. 2. Tempo of species diversification for the six study lineages.
a Lineage-through-time curves of each lineage. The thick lines represent maximum credibility phylogenetic reconstructions, while the semi-transparent lines represent 100 trees sampled from Bayesian posterior distributions. The dashed line marks the onset of the Pleistocene at 2.6 Ma before present. The number of lineages is plotted in logarithmic scale, i.e. the exponential growth expected under pure birth model would appear linear here. b Parameter estimates indicating the effect size of the temperature control on speciation rates in temperature-dependent models of species diversification (Δ speciation rate). The black dots represent the estimates from the multi-clade model with shared parameters among lineages. Higher values above the dashed line indicate lower speciation in colder geological periods. Thick dots correspond to estimates based on the maximum credibility phylogenetic trees, and semi-transparent dots on the 100 trees sampled from the posterior distribution. Source data are provided as a Source Data file.
Fig. 3
Fig. 3. Evolutionary assembly across bedrocks and elevational belts based on ClaSSE models.
a, c The differences between siliceous and calcareous habitats in constant-state speciation and migration rates, respectively. b, d The differences between high and mid-elevation habitats in constant-state speciation and migration rates, respectively. The dots represent mean parameter estimates and the bars indicate 95% credibility intervals, based on 5000 MCMC samples from the ClaSSE model posterior. Black dots and bars represent the shared parameter estimates from the multi-clade model, where each of the 6 phylogenies is regarded as an independent realization of the same diversification process. e The proportions of species inhabiting siliceous, calcareous or both types of habitats (light, dark and middle gray, respectively), and f the proportion of species inhabiting high elevation, mid-elevation or both types of habitats (light, dark and middle gray, respectively). Source data are provided as a Source Data file.
Fig. 4
Fig. 4. Sister-species overlap in geographic and ecological space.
Violin plots show distribution of Schoener’s D index of overlap of sister species pairs across 87 operational geographic units (fine geo), five European mountain regions (coarse geo), bedrock types (calcareous vs. siliceous) and elevational belts (high vs. mid-elevations). The point within each plot represents median overlap value. Low overlap between sister pairs is considered as an indication of frequent speciation along the respective geographic or ecological dimension. Source data are provided as a Source Data file.

References

    1. Hughes CE, Atchinson GW. The ubiquity of alpine plant radiations: from the Andes to the Hengduan Mountains. N. Phytol. 2015;207:275–282. doi: 10.1111/nph.13230. - DOI - PubMed
    1. Rahbek C, et al. Humboldt’s enigma: what causes global patterns of mountain biodiversity? Science. 2019;365:1108–1113. doi: 10.1126/science.aax0149. - DOI - PubMed
    1. Antonelli A, et al. Geological and climatic influences on mountain biodiversity. Nat. Geosci. 2018;11:718–725. doi: 10.1038/s41561-018-0236-z. - DOI
    1. Quintero I, Jetz W. Global elevational diversity and diversification of birds. Nature. 2018;555:246–250. doi: 10.1038/nature25794. - DOI - PubMed
    1. Merckx VSFT, et al. Evolution of endemism on a young tropical mountain. Nature. 2015;524:347–350. doi: 10.1038/nature14949. - DOI - PubMed

Publication types