. 2022 May 18;13(1):2743.
doi: 10.1038/s41467-022-30187-w.

Large-scale GWAS of food liking reveals genetic determinants and genetic correlations with distinct neurophysiological traits

Affiliations

Large-scale GWAS of food liking reveals genetic determinants and genetic correlations with distinct neurophysiological traits

Sebastian May-Wilson et al. Nat Commun. .

Abstract

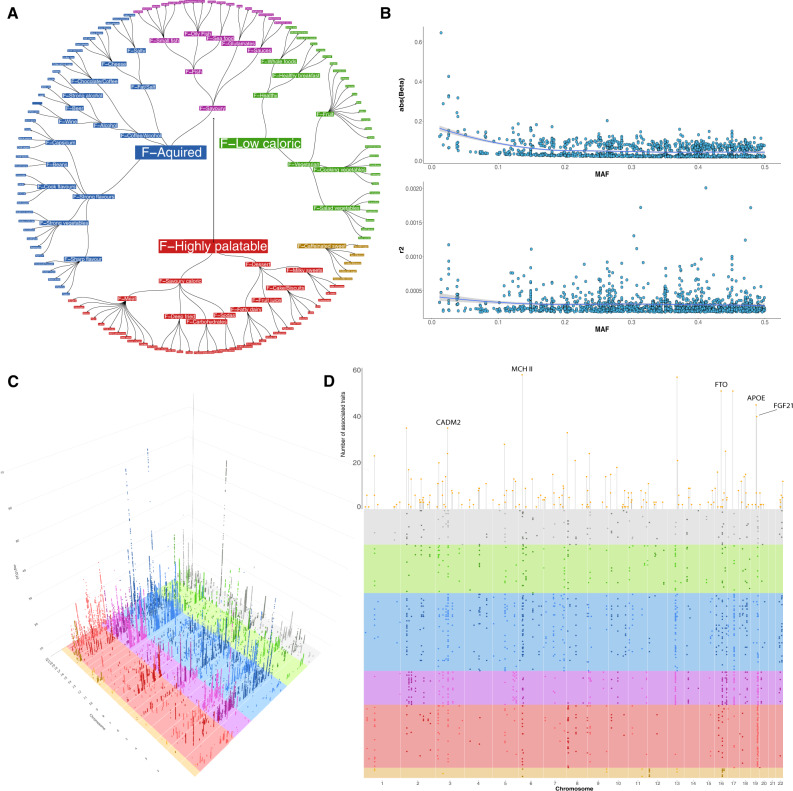
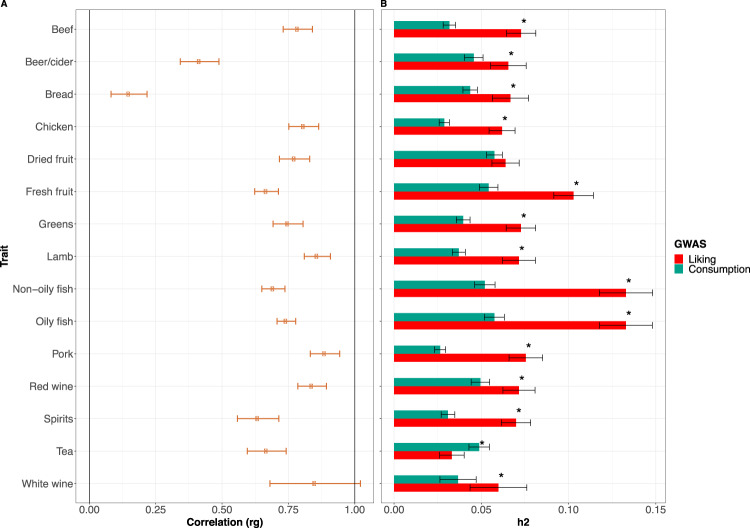
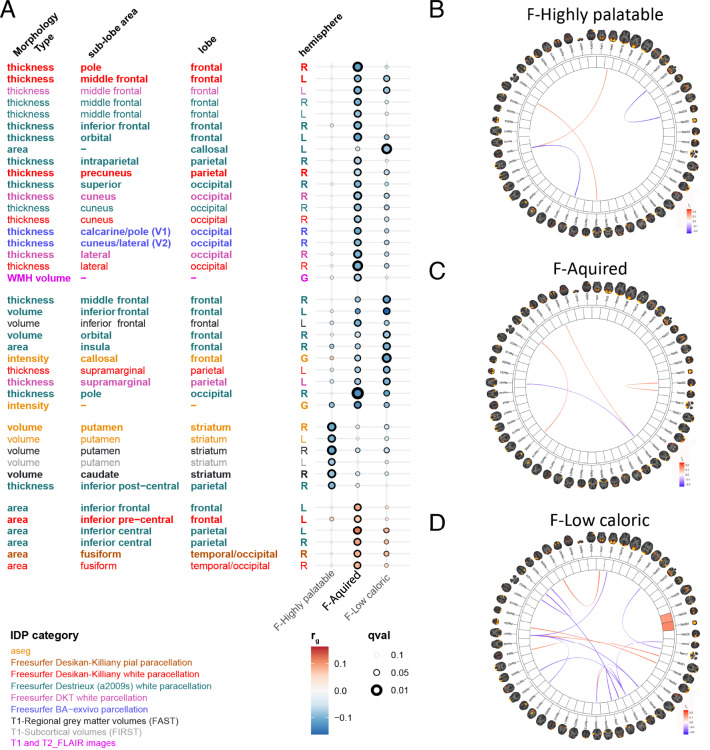
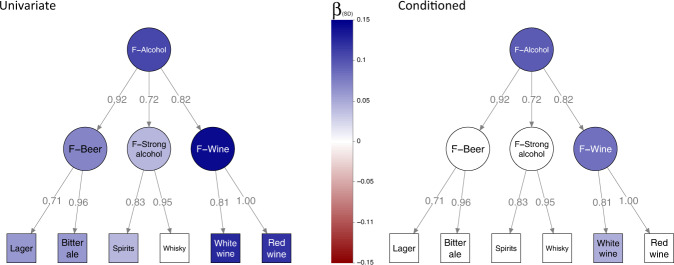
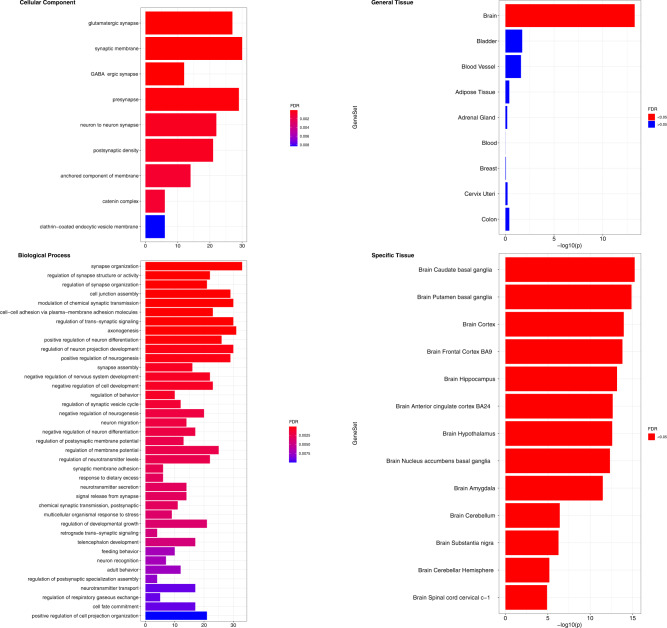
We present the results of a GWAS of food liking conducted on 161,625 participants from the UK-Biobank. Liking was assessed over 139 specific foods using a 9-point scale. Genetic correlations coupled with structural equation modelling identified a multi-level hierarchical map of food-liking with three main dimensions: "Highly-palatable", "Acquired" and "Low-caloric". The Highly-palatable dimension is genetically uncorrelated from the other two, suggesting that independent processes underlie liking high reward foods. This is confirmed by genetic correlations with MRI brain traits which show with distinct associations. Comparison with the corresponding food consumption traits shows a high genetic correlation, while liking exhibits twice the heritability. GWAS analysis identified 1,401 significant food-liking associations which showed substantial agreement in the direction of effects with 11 independent cohorts. In conclusion, we created a comprehensive map of the genetic determinants and associated neurophysiological factors of food-liking.


Conflict of interest statement

The authors declare no competing interests.

Figures

Fig. 1
Fig. 1. Food-liking map and genome-wide association results.
Panel A displays the hierarchical model of relationships between liking of different foods. The outermost branches represent the original food-liking traits which were measured with the questionnaire. Colours reflect the membership in one of the four independent dimensions: Red: F-Highly palatable; Blue: F-Acquired; Green: F-Low Caloric; Light brown: F-Caffeinated sweet drinks. F-Savoury foods are coloured purple as they contribute to both F-Highly palatable and F-Acquired Foods. The upper half of panel B represents the relationship between the minor allele frequency and effect size. As in most complex traits, there is an inverse relationship between MAF and effect size. The lower panel represents the same SNPs but r2 is reported on the y-axis, showing no relationship between the two measures. The lines represent the trend line with 95% CI. Panel C is a 3D Manhattan plot, reporting only SNPs with p < 5 × 10−8. Colours reflect those used in panel A. Panel D shows a bird’s-eye view of the Manhattan plot. Each dot represents the top SNP from each of the sub-loci. The lollipop heights are proportional to the number of traits each locus is associated with.
Fig. 2
Fig. 2. Genetic comparison between food-liking and food-consumption traits.
Panel A reports the genetic correlations between consumption and liking of the same food for those foods for which both measurements were available, bars represent 95% CI. Panel B displays a comparison between SNP heritability of food consumption (green) and liking (red). Bonferroni-corrected significant differences are indicated with a star. Bars represent 95% CI.
Fig. 3
Fig. 3. Genetic correlation between the three main food-liking factors and other selected complex traits.
X indicates FDR > 0.05. “Qualifications: None of the above” refers to the educational attainment level achieved by the participant and in particular it reflects the lowest qualification possible.
Fig. 4
Fig. 4. Genetic correlations between three main food-liking dimensions and brain MRI traits.
Only traits with q-value < 0.05 have been reported. Panel A reports the genetic correlations between the three main liking dimensions and brain MRI morphological traits. Colour reflects the atlas used while size of the dots size is proportional to q-values. Panels BD genetic correlations with the ICA100 network traits.
Fig. 5
Fig. 5. Example of univariable vs conditioned analysis of rs1229984 in ADH1B.
The path graph represents the hierarchical model up to the alcohol trait. Numbers over the edges report the standardized loadings. Colour is proportional to effect size. Effect sizes with p < 1.4 × 10−3 (0.05/34 independent traits) have been shrunk to 0.
Fig. 6
Fig. 6. Enrichment analysis of food-liking genes.
Associated biological functions from Gene Ontology (GO) terms and tissue up-regulated genes using the prioritized genes from all loci with p < 5 ×10⁻⁸ are shown. The left panels show the summarized significant GO Terms (FDR < 0.05) for cellular component and biological processes, while the right ones report the tissue enrichment using the general tissues (upper panel) and the specific ones (bottom panel).
Fig. 7
Fig. 7. Strategy to map loci to specific traits.
Panels AC shows how we fit the SNP effect simultaneously on all food-liking traits in the model. We started with the SNP effect on each observed trait participating in the model (A). We then used GenomicSEM to estimate the effect of the SNP on the latent variable, L1, based on the observed ones (B). We finally used the SNP estimate on L1 as though it were directly observed and created a new dummy latent variable (DV) strongly correlated to L1 (0.99) and fit the SNP effect on LD and all participating food-liking traits at the same time (C). Panels DF shows the strategy used to fit the multi-order model. The full model (D) is split into levels composed of 1 latent variable and its observable.

Similar articles

Cited by

References

    1. GBD 2019 Risk Factors Collaborators. Global burden of 87 risk factors in 204 countries and territories, 1990-2019: a systematic analysis for the Global Burden of Disease Study 2019. Lancet. 2020;396:1223–1249. doi: 10.1016/S0140-6736(20)30752-2. - DOI - PMC - PubMed
    1. Berridge KC, Robinson TE, Aldridge JW. Dissecting components of reward: “liking”, “wanting”, and learning. Curr. Opin. Pharmacol. 2009;9:65–73. doi: 10.1016/j.coph.2008.12.014. - DOI - PMC - PubMed
    1. Costell E, Tárrega A, Bayarri S. Food acceptance: the role of consumer perception and attitudes. Chemosens. Percept. 2010;3:42–50. doi: 10.1007/s12078-009-9057-1. - DOI
    1. Pilgrim FJ. The components of food acceptance and their measurement. Am. J. Clin. Nutr. 1957;5:171–175. doi: 10.1093/ajcn/5.2.171. - DOI - PubMed
    1. Hayes, J. E. In Handbook of Eating and Drinking 131–155 (Springer International Publishing, 2020).

Publication types