. 2022 May 18;13(1):2736.
doi: 10.1038/s41467-022-30376-7.

Deubiquitinating enzymes and the proteasome regulate preferential sets of ubiquitin substrates

Affiliations

Deubiquitinating enzymes and the proteasome regulate preferential sets of ubiquitin substrates

Fredrik Trulsson et al. Nat Commun. .

Abstract

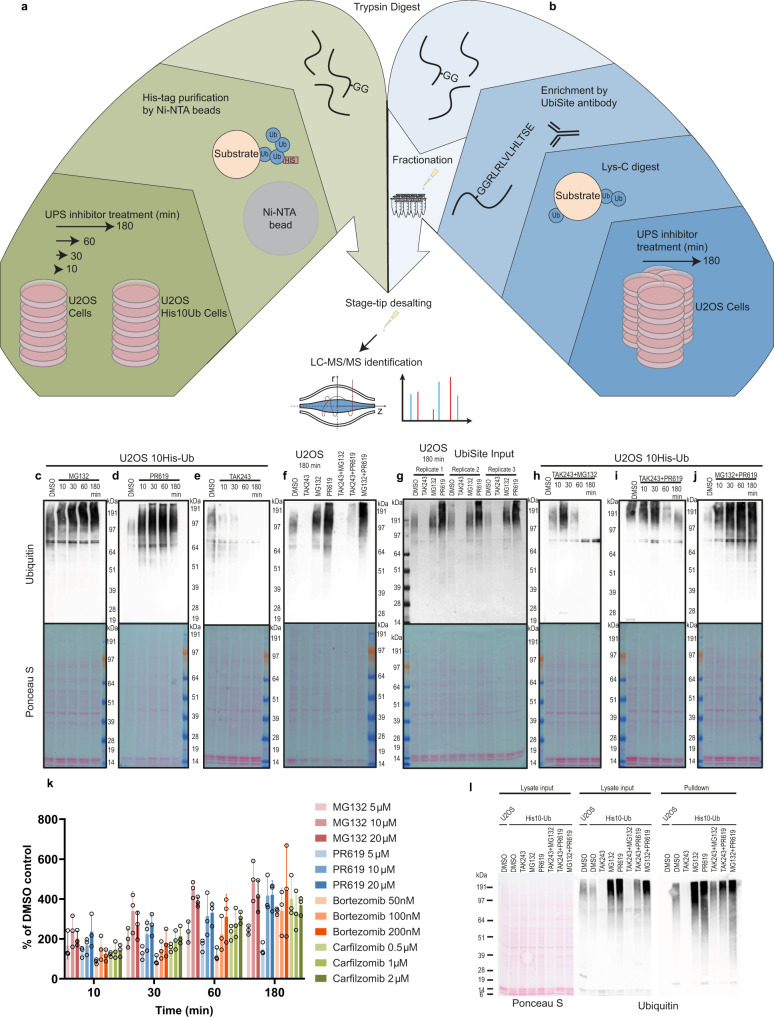
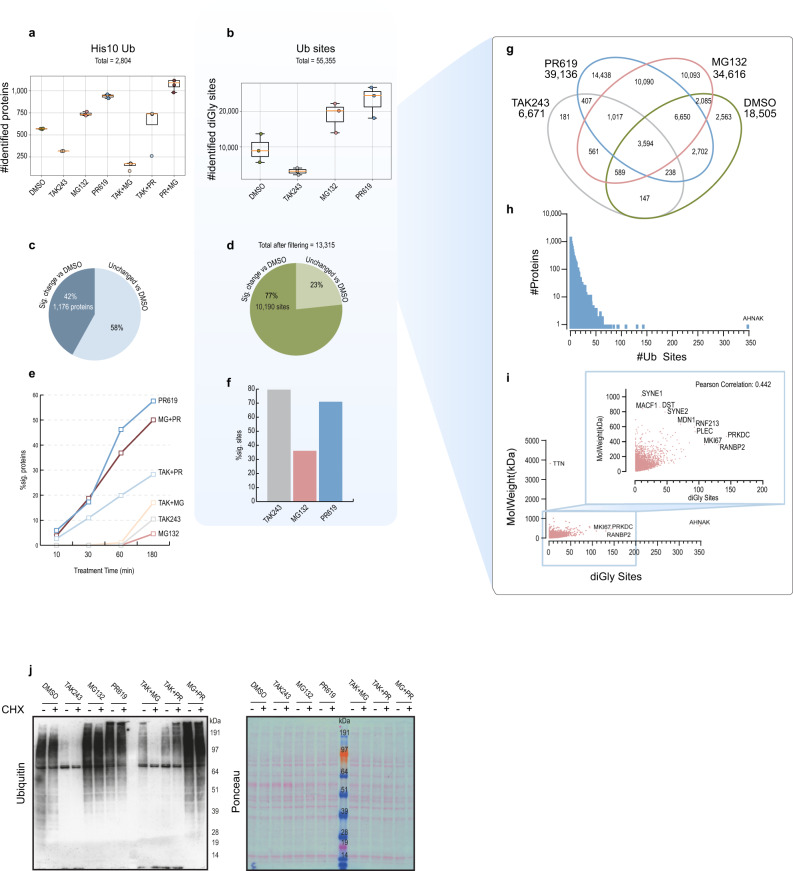
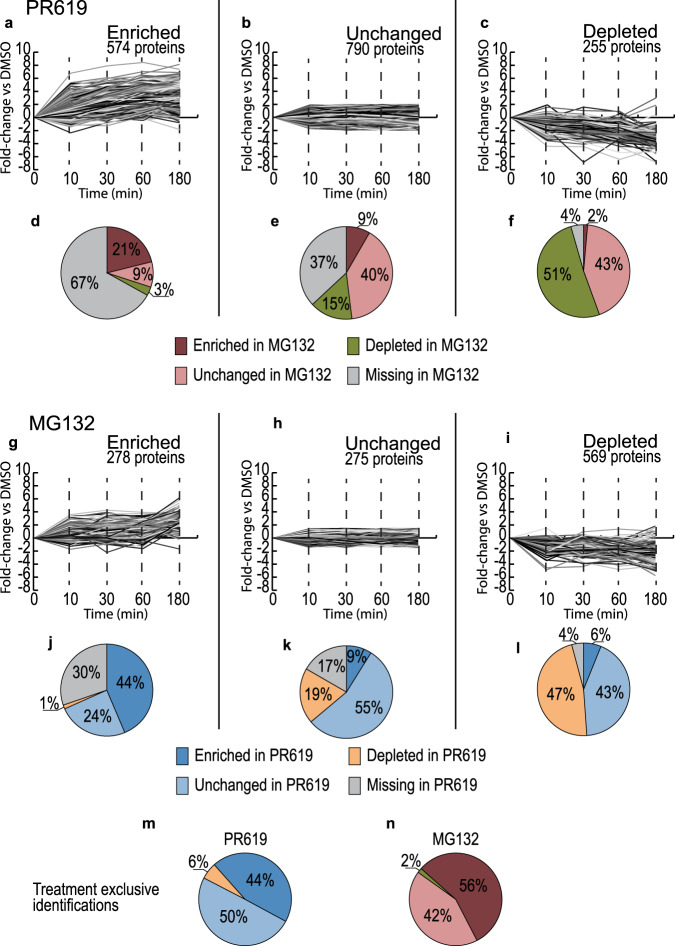
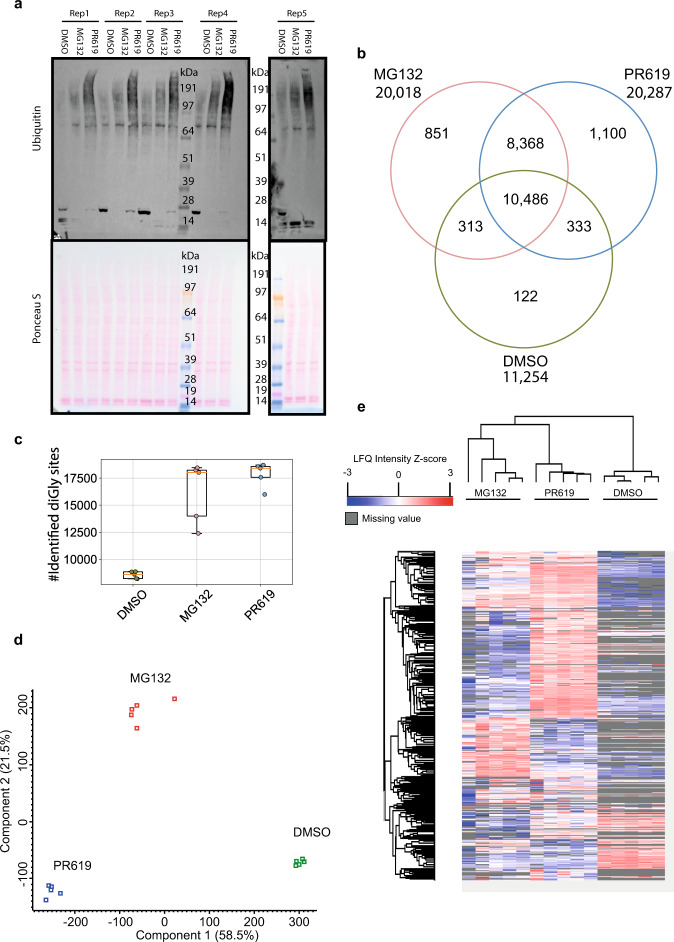
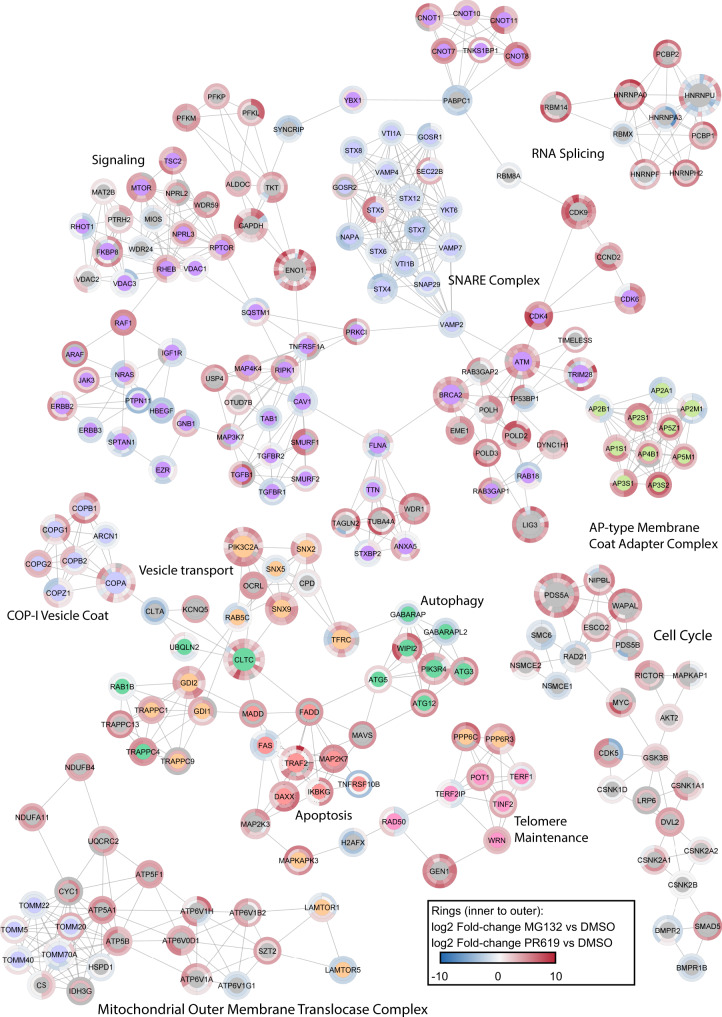
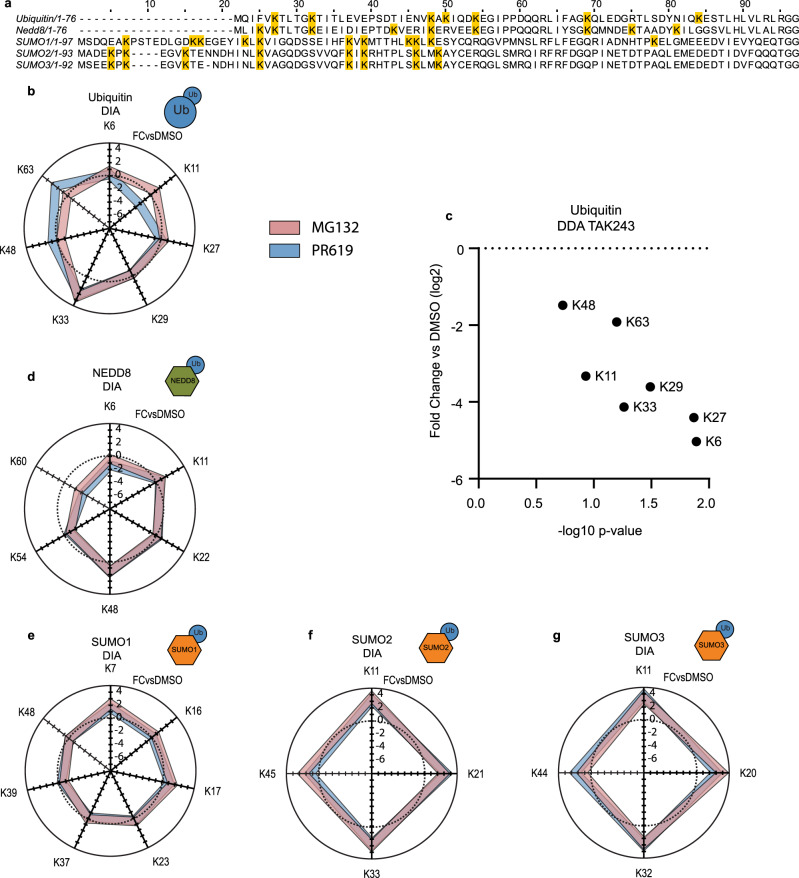
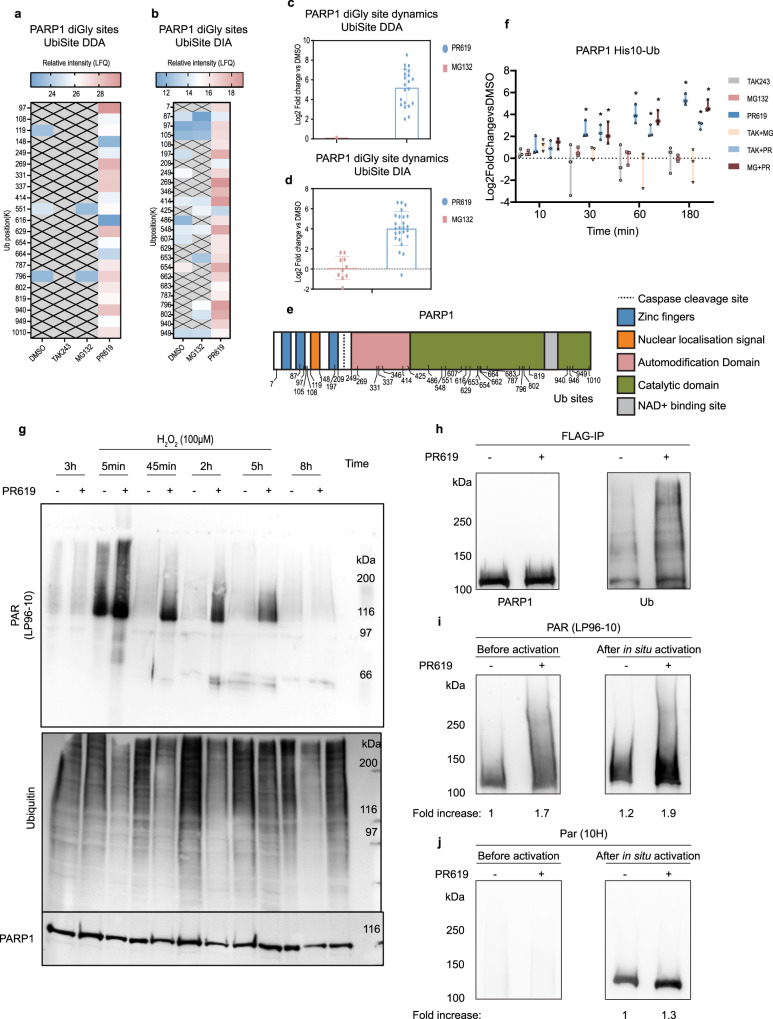
The ubiquitin-proteasome axis has been extensively explored at a system-wide level, but the impact of deubiquitinating enzymes (DUBs) on the ubiquitinome remains largely unknown. Here, we compare the contributions of the proteasome and DUBs on the global ubiquitinome, using UbiSite technology, inhibitors and mass spectrometry. We uncover large dynamic ubiquitin signalling networks with substrates and sites preferentially regulated by DUBs or by the proteasome, highlighting the role of DUBs in degradation-independent ubiquitination. DUBs regulate substrates via at least 40,000 unique sites. Regulated networks of ubiquitin substrates are involved in autophagy, apoptosis, genome integrity, telomere integrity, cell cycle progression, mitochondrial function, vesicle transport, signal transduction, transcription, pre-mRNA splicing and many other cellular processes. Moreover, we show that ubiquitin conjugated to SUMO2/3 forms a strong proteasomal degradation signal. Interestingly, PARP1 is hyper-ubiquitinated in response to DUB inhibition, which increases its enzymatic activity. Our study uncovers key regulatory roles of DUBs and provides a resource of endogenous ubiquitination sites to aid the analysis of substrate specific ubiquitin signalling.


Conflict of interest statement

The authors declare no competing interests. UbiSite is patented by the University of Southern Denmark (patent number US9476888B2).

Figures

Fig. 1
Fig. 1. Dynamic ubiquitinomes in response to E1, proteasome and DUB inhibition.
a Graphical overview of the methodology used for UPS inhibitor time course and purification of His10 tagged Ub substrates by Ni-NTA beads, tryptic digestion and MS identification. b Graphical overview of the methodology used for UPS inhibitor treatments and purification of endogenous Ub sites by IP of Lys-C fragment of Ub, tryptic digest, fractionation and MS identification. ce Ponceau S and immunoblot staining with anti-Ub (P4D1) of input samples from U2OS-His10-Ub treated with a proteasome inhibitor (10 µM MG132) (c), DUB inhibitor (20 µM PR619) (d) or Ub E1 inhibitor (1 µM TAK243) (e) for indicated timepoints, n = 3 biologically independent samples. f Input samples from U2OS parental cells treated with UPS inhibitors for 3 h, stained with anti-Ub (P4D1), n = 3 biologically independent samples. g Replicates of U2OS input samples treated with UPS inhibitors for 3 h and used for purification of endogenous Ub sites, stained with anti-Ub (P4D1), n = 3 independent biological samples. hj Input samples from U2OS-His10-Ub treated with combination treatments Ub E1 inhibitor and proteasome inhibitor (h), Ub E1 inhibitor and DUB inhibitor (i) or proteasome inhibitor and DUB inhibitor (j) with anti-Ub staining (P4D1), n = 4 biologically independent samples. k Quantification of immunoblot Ub smear (P4D1) intensity adjusted based on β-actin (A5441) intensity (Supplementary Fig. 2). Data represent % of DMSO controls mean intensity (timepoints 10, 30, 60 and 180 min), the whiskers represent the SD and circles indicates each individual value. The inhibitor concentration range was selected based on common use in the field for the proteasome inhibitors MG132, Bortezomib, Carfilzomib and the DUB inhibitor PR619, n = 3 biologically independent samples. I His10-Ub substrates purified with Ni-NTA beads from cells treated for 3 h with UPS inhibitor(s), stained for Ub (P4D1), n = 3 biologically independent samples. Source data are provided as a Source Data file.
Fig. 2
Fig. 2. Identification of Ub sites and substrates by mass spectrometry.
a Identified His10-Ub substrates purified from cells treated for 3 h with indicated UPS inhibitors after removing proteins identified in parental U2OS samples were filtered out (all treatments) (right-sided student’s t test p value=0.05, S0 = 0.1), n = 3 biologically independent samples. Each data point is represented by a coloured circle; the box contains the 25–75th percentile and the orange line denotes the mean and the error bars represents the SD. b Identified Ub sites purified with UbiSite antibody from U2OS cells treated with the indicated UPS inhibitors for 3 h, n = 3 biologically independent samples. Each data point is represented by a coloured circle, the box contains the 25–75th percentile and the orange line denotes the mean and the error bars represents the SD. c Percentage of proteins in His10-Ub samples that changed significantly in any of the UPS inhibitor treatments and timepoints in comparison to DMSO control (student’s t test FDR = 0.05, S0 = 0.1). d Percentage of Ub sites that changed significantly in any of the UPS inhibitor treatments in comparison to DMSO control (student’s t test FDR = 0.05, S0 = 0.1). e, f Percentage of significantly altered proteins in response to the indicated treatment at the indicated timepoints in His10-Ub samples (e) and Ub sites at 3 h (f). g Venn diagram of Ub sites identified per treatment from UbiSite DDA data, where sites identified in at least one replicate in multiple treatments were considered as intersections. h Histogram of number of Ub sites identified per protein. i Scatter plot of number of Ub sites compared to the molecular weight of the protein, with Pearson correlation analysis. j UPS inhibitor treatments, and combinations of UPS inhibitors with or without addition of 50 µg/ml translation inhibitor Cycloheximide (CHX) at 3 h; samples were immunoblotted for Ub (P4D1), n = 3 biologically independent samples. Source data are provided as a Source Data file.
Fig. 3
Fig. 3. Large pools of His10-Ub substrates exclusively identified in DUB or proteasome-inhibited samples.
ac Dynamics of His10-Ub substrates identified in PR619-treated samples grouped based on their fold-change vs DMSO (log2), “Enriched” (>twofold enrichment) (a), “Unchanged” (<twofold enrichment and <twofold depletion) (b) and “Depleted” (>twofold depletion) (c). df The His10-Ub groups in PR619-treated samples compared to their grouping in MG132 treated samples with PR619 “Enriched” group distribution in d, “Unchanged” group distribution in e and “Depleted” group distribution in f. gi Dynamics of His10-Ub substrates identified in MG132 treated samples grouped according to the same criteria with groups “Enriched” (g), “Unchanged” (h) and “Depleted” (i). jl The His10-Ub groups in MG132 treated samples compared to their grouping in PR619-treated samples with MG132 “Enriched” group distribution in j, “Unchanged” group distribution in k and “Depleted” group distribution in l. m, n Group distributions of proteins exclusively identified in Dub inhibited samples (m) or proteasome-inhibited samples (n). Source data are provided as a Source Data file.
Fig. 4
Fig. 4. Data-independent acquisition of Ub sites.
a Immunoblots of U2OS input samples treated for 3 h with DMSO, MG132 (10 µM) or PR619 (20 µM) and stained for Ub (P4D1), n = 5 biologically independent samples. b DiGly sites were identified using UbiSite technology in data-independent acquisition (DIA) mode. Data were filtered as described in the methods section. Venn diagram of Ub sites identified per treatment, where sites identified in at least one replicate in multiple treatments was considered as intersections, n = 5. c Number of diGly sites identified per treatment, where each data point is represented by a coloured circle, the box contains the 25–75th percentile and the orange line denotes the mean and the error bars represents the SD, n = 5 biologically independent samples. d Principal component analysis of UbiSite DIA data using components with the highest explained variance, n = 5. e Hierarchical clustering by Euclidean distance where each column in the heatmap is a sample and each row is a Ub site (pre-processed with k-means, 300 clusters, 1000 iterations). The Ub site intensity values were normalised by Z score (subtraction of the mean) and missing values are denoted by a grey colour, n = 5. Source data are provided as a Source Data file.
Fig. 5
Fig. 5. Ubiquitin signalling networks.
Network analysis of proteins and their Ub sites identified in all five UbiSite DIA replicates of MG132 or PR619-treated cells. Networks were generated using the STRING database of protein-protein interactions (confidence cutoff = 0.9) and subclustered into the most interconnected networks using MCODE (default settings). A functional enrichment was performed on each subcluster with the human genome as background. The most significant biological process or complex is displayed as a title for each subcluster, or colour coded in the node centre for larger subclusters. The dynamics of each Ub site in response to proteasome (MG132) or DUB inhibition (PR619) was colour coded according to the fold-change vs DMSO (log2), where a grey colour indicates that the Ub site was not identified in that treatment. The most N-terminal Ub site is visualised at 12 o’clock of the node, and progresses clockwise to the most C-terminal Ub site at 11 o’clock. The outer ring colour represents PR619 fold-change vs DMSO and the inner ring colour represents MG132 fold-change vs DMSO. The size of the node represents the number of Ub sites identified on that protein. Source data are provided as a Source Data file.
Fig. 6
Fig. 6. Signalling dynamics of Ub polymers and Ub/Ubl heteropolymers.
a Amino-acid sequence of Ub and other Ubls with internal lysines highlighted. b Radar plot of Ub sites identified using UbiSite DIA acquisition methodology, where each segment represents a lysine position (K) on Ub. Data are plotted as fold-change vs DMSO (log2) of indicated UPS inhibitor treatment at 3 h. The dotted line represents 0, n = 5. c diGly sites on Ub in UbiSite DDA data after 3 h TAK243 treatment, data are represented as log2 fold-change vs DMSO and −log10 p value (student’s t test, FDR = 0.05, S0 = 0.1), n = 3. dg Additional radar plots with diGly sites identified on NEDD8 (d), SUMO1 (e), SUMO2 (f) and SUMO3 (g) in UbiSite DIA data, n = 5. Source data are provided as a Source Data file.
Fig. 7
Fig. 7. Activation of PARP1 by hyper-ubiquitination.
a, b Heatmap of average relative intensity (LFQ, log2) of PARP1 Ub sites (minimum 2 valid values) per treatment in UbiSite DDA (a) or UbiSite DIA (b) data. Missing values are represented by a grey crossed out box at lysine position (K). c, d Comparison between Ub sites identified on PARP1 after MG132 or PR619 treatment represented as fold-change vs DMSO (log2) in UbiSite DDA (n = 3 biologically independent samples) (c) or UbiSite DIA (n = 5 biologically independent samples) (d) where the error bars represent the SD. e Schematic overview of PARP1 domains with identified Ub acceptor lysines indicated. f PARP1 identified in His10-Ub samples as fold-change vs DMSO for each treatment and timepoint. Error bars represent the standard deviation and an asterisk denotes a significant difference vs DMSO (two-sided student’s t test FDR < 0.05 S0 = 0.1). Boxes include the maximum and minimum value of each condition and each data point is depicted as a black symbol, n = 3 biologically independent samples. g Immunoblot of U2OS cells treated with 20 µM PR619 or DMSO for 3 h and subsequent treatment with 100 µM H2O2 for the indicated timepoints. The membrane was probed for PARylated proteins (LP-96-10), ubiquitin (FK2) and PARP1 (Alx-210-302), n = 4 biologically independent samples. h Immunoblot of PARP1 enriched by FLAG-IP from GMRSiP cells expressing FLAG-tagged PARP1 treated with DMSO or 20 µM PR619 for 3 h. The membrane was probed with polyclonal PARP1 antibody (Alx-210-302) and Ub (FK2), n = 3 biologically independent samples. i, j Purified PARP1 from FLAG-IP was immunoblotted in duplicate on the same membrane and divided to leave one set without further processing to reflect the native status of PARylation in the cells (left panel), whereas the other set was subjected to in situ PARylation assay on the nitrocellulose membrane by adding nicked DNA and NAD to assess PARylation in response to additional DNA damage (right panel). Both sets of membranes were probed for long and short PAR chains (LP-96-10) (i) or long PAR chains (10H) (j), n = 3 biologically independent samples. Source data are provided as a Source Data file.

Similar articles

Cited by

References

    1. McDowell GS, Philpott A. New insights into the role of ubiquitylation of proteins. Int. Rev. Cell Mol. Biol. 2016;325:35–88. doi: 10.1016/bs.ircmb.2016.02.002. - DOI - PubMed
    1. Swatek KN, Komander D. Ubiquitin modifications. Cell Res. 2016;26:399–422. doi: 10.1038/cr.2016.39. - DOI - PMC - PubMed
    1. Stewart MD, Ritterhoff T, Klevit RE, Brzovic PS. E2 enzymes: more than just middle men. Cell Res. 2016;26:423–440. doi: 10.1038/cr.2016.35. - DOI - PMC - PubMed
    1. Harrigan JA, Jacq X, Martin NM, Jackson SP. Deubiquitylating enzymes and drug discovery: emerging opportunities. Nat. Rev. Drug Discov. 2018;17:57–78. doi: 10.1038/nrd.2017.152. - DOI - PMC - PubMed
    1. Varshavsky A. The N-end rule pathway and regulation by proteolysis. Protein Sci. 2011;20:1298–1345. doi: 10.1002/pro.666. - DOI - PMC - PubMed

Publication types

MeSH terms