. 2022 May 18;13(1):2746.
doi: 10.1038/s41467-022-30443-z.

Novel role of the synaptic scaffold protein Dlgap4 in ventricular surface integrity and neuronal migration during cortical development

Affiliations

Novel role of the synaptic scaffold protein Dlgap4 in ventricular surface integrity and neuronal migration during cortical development

Delfina M Romero et al. Nat Commun. .

Abstract

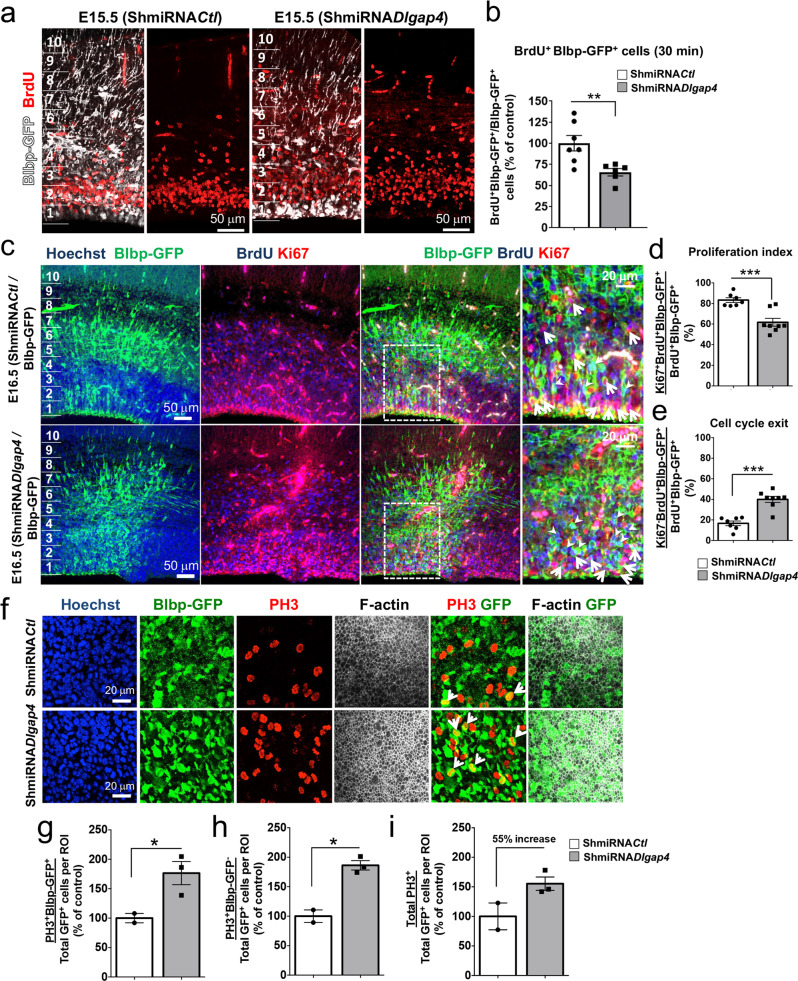
Subcortical heterotopias are malformations associated with epilepsy and intellectual disability, characterized by the presence of ectopic neurons in the white matter. Mouse and human heterotopia mutations were identified in the microtubule-binding protein Echinoderm microtubule-associated protein-like 1, EML1. Further exploring pathological mechanisms, we identified a patient with an EML1-like phenotype and a novel genetic variation in DLGAP4. The protein belongs to a membrane-associated guanylate kinase family known to function in glutamate synapses. We showed that DLGAP4 is strongly expressed in the mouse ventricular zone (VZ) from early corticogenesis, and interacts with key VZ proteins including EML1. In utero electroporation of Dlgap4 knockdown (KD) and overexpression constructs revealed a ventricular surface phenotype including changes in progenitor cell dynamics, morphology, proliferation and neuronal migration defects. The Dlgap4 KD phenotype was rescued by wild-type but not mutant DLGAP4. Dlgap4 is required for the organization of radial glial cell adherens junction components and actin cytoskeleton dynamics at the apical domain, as well as during neuronal migration. Finally, Dlgap4 heterozygous knockout (KO) mice also show developmental defects in the dorsal telencephalon. We hence identify a synapse-related scaffold protein with pleiotropic functions, influencing the integrity of the developing cerebral cortex.


Conflict of interest statement

The authors declare no competing interests.

Figures

Fig. 1
Fig. 1. DLGAP4 mutation is associated with human cortical malformations.
a Representative T2-coronal brain MRIs of heterotopia patient (P616-3) were performed at the age of 10 years old, compared to an aged-matched control. The arrow indicates the region of the heterotopia in axial and sagittal sections. b Confirmation of a 7-nucleotide insertion (CAGCTGG, three repeats instead of two) using Sanger’s sequencing method. The mutation is absent from the parents (P616-1 and 2) and identified as de novo in P616-3. c Conservation of the mutated region during evolution. The “% Ident” refers to the complete primary structure compared to the canonical human sequence. The region of the repeats starts at aminoacid (aa) N905, an extra repeat leads to aa changes from aa L909. d Structure and domains of DLGAP4 protein. A star indicates the region of the mutation. e Comparison of the WT and mutant C-terminal regions showing new aa from L909.
Fig. 2
Fig. 2. Dlgap4 is highly expressed in the developing cortex.
a In situ hybridization (ISH) at E14.5 shows mRNA expression of Dlgap4 throughout the mouse cortical wall. Coronal sections are shown. Representative immunofluorescence images showing, Dlgap4 (red) and Hoechst staining (blue) coronal sections at E14.5, at lower (b) and higher (c) magnification. Images correspond to 10 μm stack projections. LV: lateral ventricle, VZ: ventricular zone, SVZ: sub-ventricular zone, IZ: intermediate zone, CP: cortical plate, MZ: marginal zone, GE: ganglionic eminence. d Co-labeling between Dlgap4 and class III beta tubulin (TuJ1) in E16.5 mouse brain (low magnification). e Immunolabelings of Dlgap4 (red), TuJ1 (green), and Hoechst staining (blue) show little overlap in expression in the axons, although high co-labeling in the cell bodies (higher magnification). Arrowheads indicate individual neurons (f) Co-labeling between Dlgap4 (red) and the intermediate progenitor marker Tbr2 (blue) shows Dlgap4 expression in the soma at E14.5 mouse brain. Z-stack 1 μm thickness and single confocal plane with higher magnification in far-right panel (f1). Arrows indicate individual cells with Tbr2 and Dlgap4 double labeling.
Fig. 3
Fig. 3. Dlgap4 KD reveals a progenitor phenotype during mouse cortical development.
a Representative coronal section after IUE E14.5 for control (ShmiRNACtl, upper panel) and Dlgap4 KD (ShmiRNADlgap4, lower panel) constructs one day later. Arrows show disorganized Nestin+ RG fibers (red). Blbp-GFP+ (green); IUE: in utero electroporation; Ctl: control; KD: knock down; RG: radial glia. b Blbp-GFP+ cell distribution along the cortical wall divided into 10 bins. Two-way ANOVA: Interaction Bin × ShmiRNA condition: F9, 280 = 4.79, p < 0.0001; * p = 0.042, ** p < 0.003 by Sidak’s multiple comparison test. c Quantification of total Blbp-GFP+ cells at E15.5 (ShmiRNACtl and ShmiRNADlgap4, n = 15 embryos from at least 4 litters per condition). Means and individual values ± SEM are shown, two-sided unpaired t-test, p = 0.60. d A ventricular surface phenotype was observed in a large proportion of KD brains. Arrows show Blbp-GFP+ (white) cells misplaced towards the lateral ventricle. F-actin (red); VZ: ventricular zone; SVZ: subventricular zone; IZ: intermediate zone; CP: cortical plate; MZ: marginal zone. e Representative images of F-actin staining in ShmiRNACtl and ShmiRNADlgap4 KD brains, 48 h after IUE (n = 2 Ctl and n = 3 KD brains from 2 litters per condition). Images correspond to 10 μm stack projections. f Quantification of the relative pixel intensity of F-actin in the VZ per condition. Data represent the mean ± SEM (two-sided paired t-test, ****p < 0.0001). g Representative images showing β-catenin and N-cadherin (both in red) expression and localization patterns in ShmiRNACtl and ShmiRNADlgap4 brains, 48 h after IUE. Arrows show altered patterns. h, i Co-immunoprecipitation (co-IP) analyses performed from Neuro2A cells co-transfected with tagged β-catenin and WT or MUT DLGAP4 vectors. Total extracts were either loaded directly on the gel (Input) or subjected to IP with anti-Flag or anti-GFP antibodies. Representative blots are shown for all conditions. j Quantification data represent the relativized individual values, means ± SEM (n = 3 WT and n = 2 MUT DLGAP4 independent experiments per condition). Statistical analysis was performed using two-sided unpaired t-test with Welch’s correction for unequal variances (*p = 0.045). WT: wild type; MUT: mutant. Images correspond to 10 μm stack projections.
Fig. 4
Fig. 4. A change in progenitor cell dynamics and morphology is observed upon Dlgap4 KD.
a, b Representative images and quantifications of Pax6+ (red) and Blbp-GFP+ (white) cells in E15.5 brains (n = 7 embryos from 3 litters per condition). Means and relativized individual values ± SEM are shown. *p = 0.027 by two-sided unpaired t test. c Pax6+-Blbp-GFP+ cell distribution along the cortical wall divided into 10 bins. Two-way ANOVA: Interaction Bin × ShmiRNA condition: F9,160 = 2.76, p = 0.0049; **p < 0.008 by Sidak’s multiple comparison test. d, e Representative images and quantifications of Tbr2+ (red) and Blbp-GFP+ (white) cells in E15.5 brains (n = 6 embryos from 3 litters per condition). Means and relativized individual values ± SEM are shown. Two-sided unpaired t-test, * p = 0.041. f Quantification of Tbr2+Blbp-GFP cells along the cortical wall. Analysis was performed by two-way ANOVA followed by Sidak’s multiple comparisons test. Interaction Bin x ShmiRNA, F9, 270 = 5.13, p < 0.0001; * p < 0.04, *** p = 0.0003. g Analysis of cellular shape and morphology of Tbr2+Blbp-GFP+ cells in ShmiRNACtl and ShmiRNADlgap4 KD conditions. Arrows indicate examples of double-labeled Tbr2+Blbp-GFP+ cells in IUE experiments. h The number of primary processes, i process length, and j soma surface, were analyzed in Tbr2+Blbp-GFP+ cells in both ShmiRNACtl and ShmiRNADlgap4 KD conditions (n = 57 ShmiRNACtl and n = 68 ShmiRNADlgap4 KD cells from n = 5 embryos per condition). Means and individual values ± SEM are shown. *p < 0.05 by two-sided unpaired t-test. Images correspond to 10 μm stack projections.
Fig. 5
Fig. 5. Cortical Dlgap4 KD leads to reduced proliferation, increased cell cycle exit, and increased proportion of PH3+ cells at the ventricular surface.
a, b Representative images and quantifications of BrdU+ (red) and Blbp-GFP+ (white) cells after a 30 min pulse of BrdU at E15.5 (n = 7 ShmiRNACtl and n = 6 ShmiRNADlgap4 KD embryos from 3 litters per condition). Mean and relativized individual values ± SEM are shown. **p = 0.0084 by two-sided unpaired t-test. c Representative images showing BrdU (blue), Ki67 (red) and Blbp-GFP (green) immunostainings in ShmiRNACtl and ShmiRNADlgap4 KD conditions. Arrows: triple labeled Ki67+BrdU+Blbp-GFP+ cells, arrowheads: double-labeled BrdU+Blbp-GFP+ cells. d, e Quantification of the proliferation index and cell cycle exit, 48 h after IUE. Proliferation index was evaluated as the ratio of Ki67+BrdU+ and BrdU+Blbp-GFP+ immunolabelings. Cell cycle exit was analyzed as the ratio of Ki67BrdU+ and BrdU+Blbp-GFP+ immunolabelings (n = 7 ShmiRNACtl and n = 8 ShmiRNADlgap4 embryos from 3 litters per condition). Quantification data represent the individual values expressed as raw %, means ± SEM, ***p < 0.0005 by two-sided unpaired t-test. f Representative en face confocal imaging of ShmiRNACtl and ShmiRNADlgap4 electroporated brains (E16.5, 48 h after IUE). Arrows indicate PH3+ (red) and Blbp-GFP+ (green) double-labeled cells. g Quantification of PH3+Blbp-GFP+/Total Blbp-GFP+ per ROI, h PH3+Blbp-GFP/Total Blbp-GFP+ per ROI localized <10 μm distance from a PH3+Blbp-GFP+ cell and i total PH3+/Total Blbp-GFP+ cells per ROI expressed as % of control. ROI: 246.27 μm × 246.27 μm. Data are represented as relativized individual values, mean ± SEM. Two-sided unpaired t test with Welch’s correction was performed (gi), *p < 0.05; n.s: p = 0.11. No obvious ventricular surface damage was observed. ROI: Region Of Interest; n.s: not significant.
Fig. 6
Fig. 6. Restoration of normal corticogenesis after OE of WT and mutant DLGAP4 concomitantly with Dlgap4 KD.
a Representative ventricular surface images showing F-actin (red) staining 24 h after electroporation. Mutant DLGAP4 does not prevent the ventricular phenotype. Blbp-GFP: green; Hoechst: blue. b Representative images of OE experiments in Dlgap4 KD mice showing Blbp-GFP+ cell distribution and the ventricular surface phenotype (dashed lines and arrows). OE: overexpression. c Quantification of Blbp-GFP+ cells among conditions (n = 7 control, n = 10 ShmiRNADlgap4, n = 9 OE WT DLGAP4 and n = 11 OE MUT DLGAP4, from 3 litters per condition). Quantification data represent the relativized individual values, mean ± SEM. One-way ANOVA: F3,33 = 9.35, p = 0.0001; *p = 0.033, ***p < 0.0001 by post hoc Tukey’s test. d Blbp-GFP+ cell distribution is restored only by OE of DLGAP4 WT in bins 1 and 2. Two-way ANOVA: Interaction Bin x Experimental condition: F27,450 = 5.67, p < 0.0001; *p = 0.0049, **p < 0.009, ***p < 0.001 by post hoc Sidak’s test. e Representative images of OE experiments in Dlgap4 KD mice showing Blbp-GFP (white) and Pax6 (red) labeling. f Quantification of double Pax6+Blbp-GFP+ cells among conditions (n = 10 control, n = 7 ShmiRNADlgap4, n = 7 OE WT DLGAP4 and n = 7 OE MUT DLGAP4, from at least 3 litters per condition). Mean and relativized individual values ± SEM are shown. One-way ANOVA: F3,29 = 17.77, p < 0.0001; *p = 0.014, **p = 0.0015, ***p = 0.0009, ****p < 0.0001 with post hoc Tukey’s test. g Representative images of OE experiments in Dlgap4 KD mice showing Blbp-GFP and Tbr2 labeling. h Quantification of double Tbr2+ (red) and Blbp-GFP+ (white) cells among conditions (n = 14 control, n = 15 ShmiRNADlgap4, n = 5 OE WT DLGAP4 and n = 7 OE MUT DLGAP4, from at least 3 litters per condition). Mean and relativized individual values ± SEM are shown. One-way ANOVA: F3,37 = 10.06, p < 0.0001; *p = 0.022, ***p < 0.001 with post hoc Tukey’s test. In e and g, arrows show basal Pax6+ or Tbr2+ cells; arrowheads show abnormal basal RG processes labeled with Blbp-GFP+.
Fig. 7
Fig. 7. DLGAP4 OE impacts actin cytoskeleton dynamics in vitro and may influence the downstream mTOR pathway.
a Representative RPE1 cell images showing reduced lamellipodia morphology and increased filopodia elongation (white arrows) after WT or mutant DLGAP4 transfections. Yellow arrows: F-actin. b Quantifications of cell percentages with lamellipodia morphology, c filopodia elongation (µm) and d organized stress fibers. Quantification data (bd) represents the individual values, mean ± SEM (~100 cells per condition, n = 3 independent experiments). One-way ANOVA with post hoc Tukey’s test was performed. b F2, 6 = 88.8, p < 0.0001; **p = 0.0029, ***p = 0.0007, ****p < 0.0001. (c) F2, 6 = 7.21, p = 0.025; Ctl vs WT DLGAP4: *p = 0.036 and Ctl vs MUT DLGAP4: *p = 0.041. d F2, 6 = 1.25, p = 0.35. e IP performed from Neuro2A cells co-transfected with Flag-cortactin and GFP-DLGAP4 (WT or MUT). f Quantification data represent the relativized individual values, means ± SEM (n = 2 WT; n = 3 MUT), ** p = 0.0018, two-sided unpaired t-test with Welch’s correction. g Flag-cortactin was found in GFP-DLGAP4 IPs. h Western blot assays from RPE1 cell extracts transfected with WT or MUT GFP-DLGAP4. Endogenous levels of DLG1, p38, FLNA, Raptor and Rictor were detected and normalized to GAPDH. i Table summarizing results. Dashed arrows: trend. One-way ANOVA with post hoc Tukey and at least three independent experiments were performed. DLGAP4 (n = 5): F2, 12 = 6.51, p = 0.012; control vs WT, p = 0.011, control vs MUT, p = 0.079. DLG1 (n = 3): F2, 6 = 0.7, p = 0.53. p38 (n = 3): F2, 6 = 147.3, p < 0.0001; control vs WT and control vs MUT, p < 0.0001. FLNA (n = 4): F2, 9 = 5.25, p = 0.031; control vs WT, p = 0.26; control vs MUT, p = 0.025. Raptor (n = 3): F2, 6 = 25.18, p = 0.0012; control vs WT, p = 0.0028, control vs MUT, p = 0.0016. Rictor (n = 3): F2, 6 = 6.49, p = 0.032; control vs WT, p = 0.98, control vs MUT, p = 0.042. jl HA-Raptor and WT or MUT Flag-DLGAP4 co-IP in Neuro2A cells (n = 2).
Fig. 8
Fig. 8. Dlgap4 KD or OE leads to slowed neuronal migration.
a Left: Schematic representation of the electroporated ROI at P0. Right: Representative Cux1 (red) labeling and Blbp-GFP (white) in Ctl and Dlgap4 KD brains at P0. b Cux1 thickness relativized to cortical wall thickness (n = 3 Ctl, n = 4 Dlgap4 KD brains from 2 litters per condition). Quantification data represent relativized individual values, mean ± SEM (two-sided unpaired t-test, *p = 0.018). c Total Cux1+ cells per ROI (n = 5 Ctl, n = 8 Dlgap4 KD brains from 2 litters per condition). ROI: 135 μm height × 370 μm width. Quantification data represent individual values, mean ± SEM (two-sided unpaired t-test, **p = 0.0066). d GFP+ cells are still migrating below the CP in the KD at P0 (e.g., red arrows). e Schematic representation of the electroporated ROI at E18.5. A Dcx-GFP reporter promoter vector was co-electroporated with a pDcx-DLGAP4 WT-Flag-ires-GFP or pDcx-DLGAP4 MUT-Flag-ires-GFP construct. f Quantification of Dcx-GFP+ cells along the cortical wall divided in 10 bins. Two-way ANOVA followed by Sidak’s test was performed (n = 3 brains from 2 litters per condition). Relativized mean values ± SEM are shown. Two-way ANOVA, Interaction Bin x OE condition, F9, 60 = 16.11, p < 0.0001; *p = 0.014, **p < 0.005, ***p = 0.0004, ****p < 0.0001. g Representative images of OE experiments targeting specific neuronal migration after IUE showing Dcx-GFP+ (green) cell distribution and Hoechst staining. h Total Cux1+ Dcx-GFP+/ Dcx-GFP+ cells did not change along conditions. Relativized mean and individual values ± SEM are shown. One-way ANOVA followed by Tukey’s test, F2, 6 = 0.39, p = 0.70. i Representative images of OE experiments showing Cux1+ (magenta) and Dcx-GFP+ (green) cell distribution. j Quantification of Cux1+ Dcx-GFP+/Dcx-GFP+ cells along the cortical wall divided in 10 bins. Two-way ANOVA followed by Sidak’s test was performed (n = 3 from 2 litters per condition). Relativized mean values ± SEM are shown. Two-way ANOVA, Interaction Bin × OE condition, F9, 60 = 16.63, p < 0.0001; *p < 0.05, **p < 0.005, ***p < 0.001, ****p < 0.0001.

Similar articles

Cited by

References

    1. Noctor SC, Martínez-Cerdeño V, Ivic L, Kriegstein AR. Cortical neurons arise in symmetric and asymmetric division zones and migrate through specific phases. Nat. Neurosci. 2004;7:136–144. doi: 10.1038/nn1172. - DOI - PubMed
    1. Götz M, Huttner WB. The cell biology of neurogenesis. Nat. Rev. Mol. Cell Biol. 2005;6:777–788. doi: 10.1038/nrm1739. - DOI - PubMed
    1. Barkovich AJ, Guerrini R, Kuzniecky RI, Jackson GD, Dobyns WB. A developmental and genetic classification for malformations of cortical development: update 2012. Brain. 2012;135:1348–1369. doi: 10.1093/brain/aws019. - DOI - PMC - PubMed
    1. Guerrini R, Dobyns WB. Malformations of cortical development: clinical features and genetic causes. Lancet Neurol. 2014;13:710–726. doi: 10.1016/S1474-4422(14)70040-7. - DOI - PMC - PubMed
    1. Bizzotto S, Francis F. Morphological and functional aspects of progenitors perturbed in cortical malformations. Front. Cell Neurosci. 2015;9:30. doi: 10.3389/fncel.2015.00030. - DOI - PMC - PubMed

Publication types

MeSH terms

Substances