

Distance to public transit predicts spatial distribution of dengue virus incidence in Medellín, Colombia
- PMID: 35585133
- PMCID: PMC9117184
- DOI: 10.1038/s41598-022-12115-6
Distance to public transit predicts spatial distribution of dengue virus incidence in Medellín, Colombia
Erratum in
-
Author Correction: Distance to public transit predicts spatial distribution of dengue virus incidence in Medellín, Colombia.Sci Rep. 2022 Jun 28;12(1):10908. doi: 10.1038/s41598-022-15431-z. Sci Rep. 2022. PMID: 35764704 Free PMC article. No abstract available.
Abstract
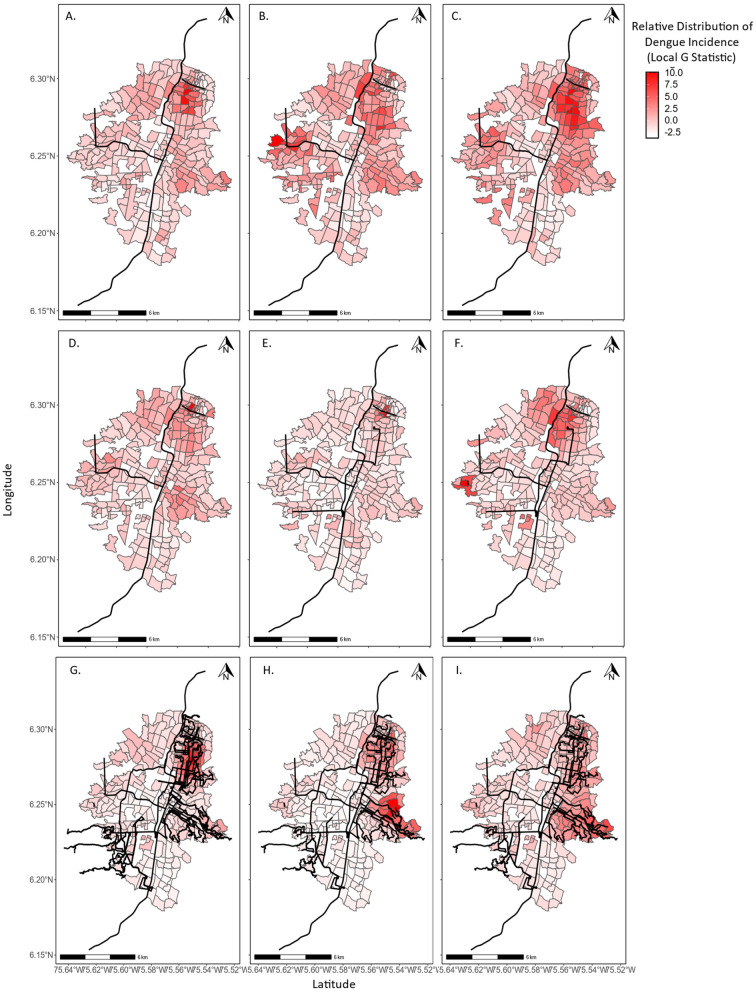
Dengue is a growing global threat in some of the world's most rapidly growing landscapes. Research shows that urbanization and human movement affect the spatial dynamics and magnitude of dengue outbreaks; however, precise effects of urban growth on dengue are not well understood because of a lack of sufficiently fine-scaled data. We analyzed nine years of address-level dengue case data in Medellin, Colombia during a period of public transit expansion. We correlate changes in the spread and magnitude of localized outbreaks to changes in accessibility and usage of public transit. Locations closer to and with a greater utilization of public transit had greater dengue incidence. This relationship was modulated by socioeconomic status; lower socioeconomic status locations experienced stronger effects of public transit accessibility and usage on dengue incidence. Public transit is a vital urban resource, particularly among low socioeconomic populations. These results highlight the importance of public health services concurrent with urban growth.
© 2022. The Author(s).
Conflict of interest statement
The authors declare no competing interests.
Figures

References
-
- Organization WH, Research SPf, Diseases TiT, Diseases WHODoCoNT, Epidemic WHO, Alert P. Dengue: guidelines for diagnosis, treatment, prevention and control. World Health Organization (2009). - PubMed
-
- Hussain-Alkhateeb L, Rivera Ramírez T, Kroeger A, Gozzer E, Runge-Ranzinger S. Early warning systems (EWSs) for chikungunya, dengue, malaria, yellow fever, and Zika outbreaks: What is the evidence? A scoping review. PLoS Negl. Trop. Dis. 2021;15:e0009686. doi: 10.1371/journal.pntd.0009686. - DOI - PMC - PubMed
Publication types
MeSH terms
Grants and funding
LinkOut - more resources
Full Text Sources
Medical
