

Modeling the systemic risks of COVID-19 on the wildland firefighting workforce
- PMID: 35585149
- PMCID: PMC9116702
- DOI: 10.1038/s41598-022-12253-x
Modeling the systemic risks of COVID-19 on the wildland firefighting workforce
Abstract
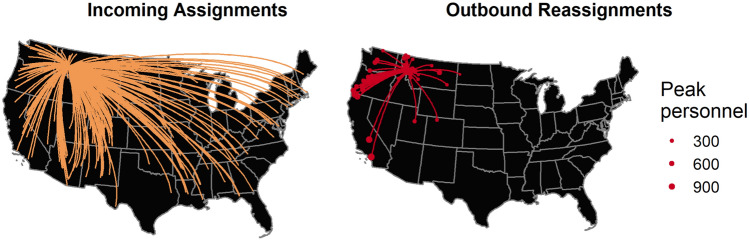
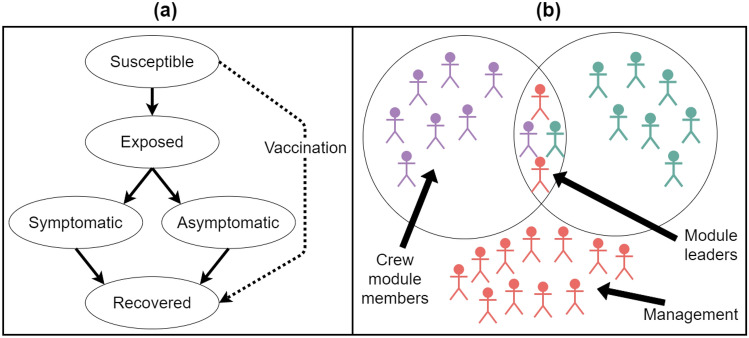
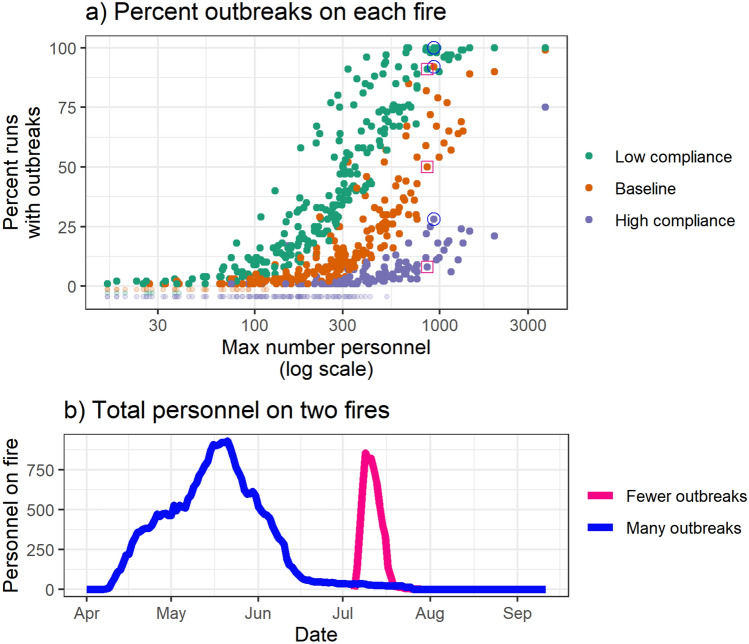
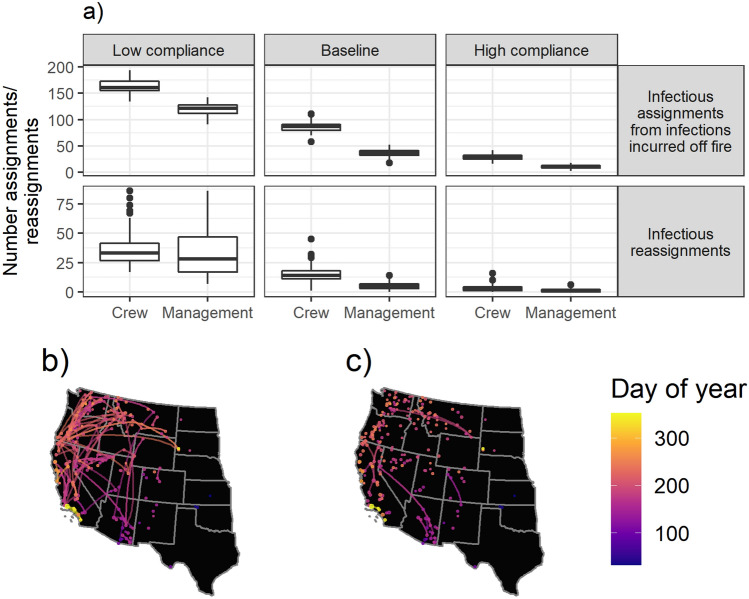
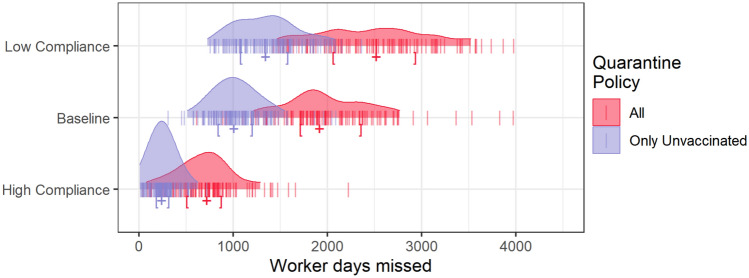
Wildfire management in the US relies on a complex nationwide network of shared resources that are allocated based on regional need. While this network bolsters firefighting capacity, it may also provide pathways for transmission of infectious diseases between fire sites. In this manuscript, we review a first attempt at building an epidemiological model adapted to the interconnected fire system, with the aims of supporting prevention and mitigation efforts along with understanding potential impacts to workforce capacity. Specifically, we developed an agent-based model of COVID-19 built on historical wildland fire assignments using detailed dispatch data from 2016-2018, which form a network of firefighters dispersed spatially and temporally across the US. We used this model to simulate SARS-CoV-2 transmission under several intervention scenarios including vaccination and social distancing. We found vaccination and social distancing are effective at reducing transmission at fire incidents. Under a scenario assuming High Compliance with recommended mitigations (including vaccination), infection rates, number of outbreaks, and worker days missed are effectively negligible, suggesting the recommended interventions could successfully mitigate the risk of cascading infections between fires. Under a contrasting Low Compliance scenario, it is possible for cascading outbreaks to emerge leading to relatively high numbers of worker days missed. As the model was built in 2021 before the emergence of the Delta and Omicron variants, the modeled viral parameters and isolation/quarantine policies may have less relevance to 2022, but nevertheless underscore the importance of following basic prevention and mitigation guidance. This work could set the foundation for future modeling efforts focused on mitigating spread of infectious disease at wildland fire incidents to manage both the health of fire personnel and system capacity.
© 2022. The Author(s).
Conflict of interest statement
The authors declare no competing interests. The findings and conclusions in this paper are those of the author(s) and should not be construed to represent any official USDA or U.S. Government determination or policy.
Figures

References
-
- Moore P, et al. Wildland fire management under COVID-19. Brief 1, review of materials. Strateg. Commun. 2020 doi: 10.18174/521344. - DOI
-
- Stoof CR, et al. Preview Brief 2: Wildland fire management under COVID-19, survey results. Wageningen University, Wageningen, Soil Geography and Landscape. Strateg. Commun. 2020 doi: 10.18174/522586. - DOI
-
- Thompson MP, Bayham J, Belval E. Potential COVID-19 outbreak in fire camp: Modeling scenarios and interventions. Fire. 2020;3(3):38. doi: 10.3390/fire3030038. - DOI
-
- National Wildfire Coordinating Group. Infectious Disease Guidance for Wildland Fire Incidents, Emergency Medical Committee. Mar 20, 2020. https://www.nwcg.gov/committees/emergency-medical-committee/infectious-d... (accessed Apr. 16, 2020).
-
- National Wildfire Coordinating Group. Guidance for Prevention and Management of COVID-19 During Wildland Fire. 2021. https://www.nwcg.gov/partners/fmb/guidance-prevention-management (accessed Apr. 20, 2021).
Publication types
MeSH terms
Supplementary concepts
LinkOut - more resources
Full Text Sources
Medical
Research Materials
Miscellaneous
