. 2022 May;605(7911):747-753.
doi: 10.1038/s41586-022-04758-2. Epub 2022 May 18.

PHGDH heterogeneity potentiates cancer cell dissemination and metastasis

Affiliations

PHGDH heterogeneity potentiates cancer cell dissemination and metastasis

Matteo Rossi et al. Nature. 2022 May.

Erratum in

  • Author Correction: PHGDH heterogeneity potentiates cancer cell dissemination and metastasis.
    Rossi M, Altea-Manzano P, Demicco M, Doglioni G, Bornes L, Fukano M, Vandekeere A, Cuadros AM, Fernández-García J, Riera-Domingo C, Jauset C, Planque M, Alkan HF, Nittner D, Zuo D, Broadfield LA, Parik S, Pane AA, Rizzollo F, Rinaldi G, Zhang T, Teoh ST, Aurora AB, Karras P, Vermeire I, Broekaert D, Elsen JV, Knott MML, Orth MF, Demeyer S, Eelen G, Dobrolecki LE, Bassez A, Brussel TV, Sotlar K, Lewis MT, Bartsch H, Wuhrer M, Veelen PV, Carmeliet P, Cools J, Morrison SJ, Marine JC, Lambrechts D, Mazzone M, Hannon GJ, Lunt SY, Grünewald TGP, Park M, Rheenen JV, Fendt SM. Rossi M, et al. Nature. 2022 Sep;609(7927):E8. doi: 10.1038/s41586-022-05226-7. Nature. 2022. PMID: 36042336 Free PMC article. No abstract available.

Abstract

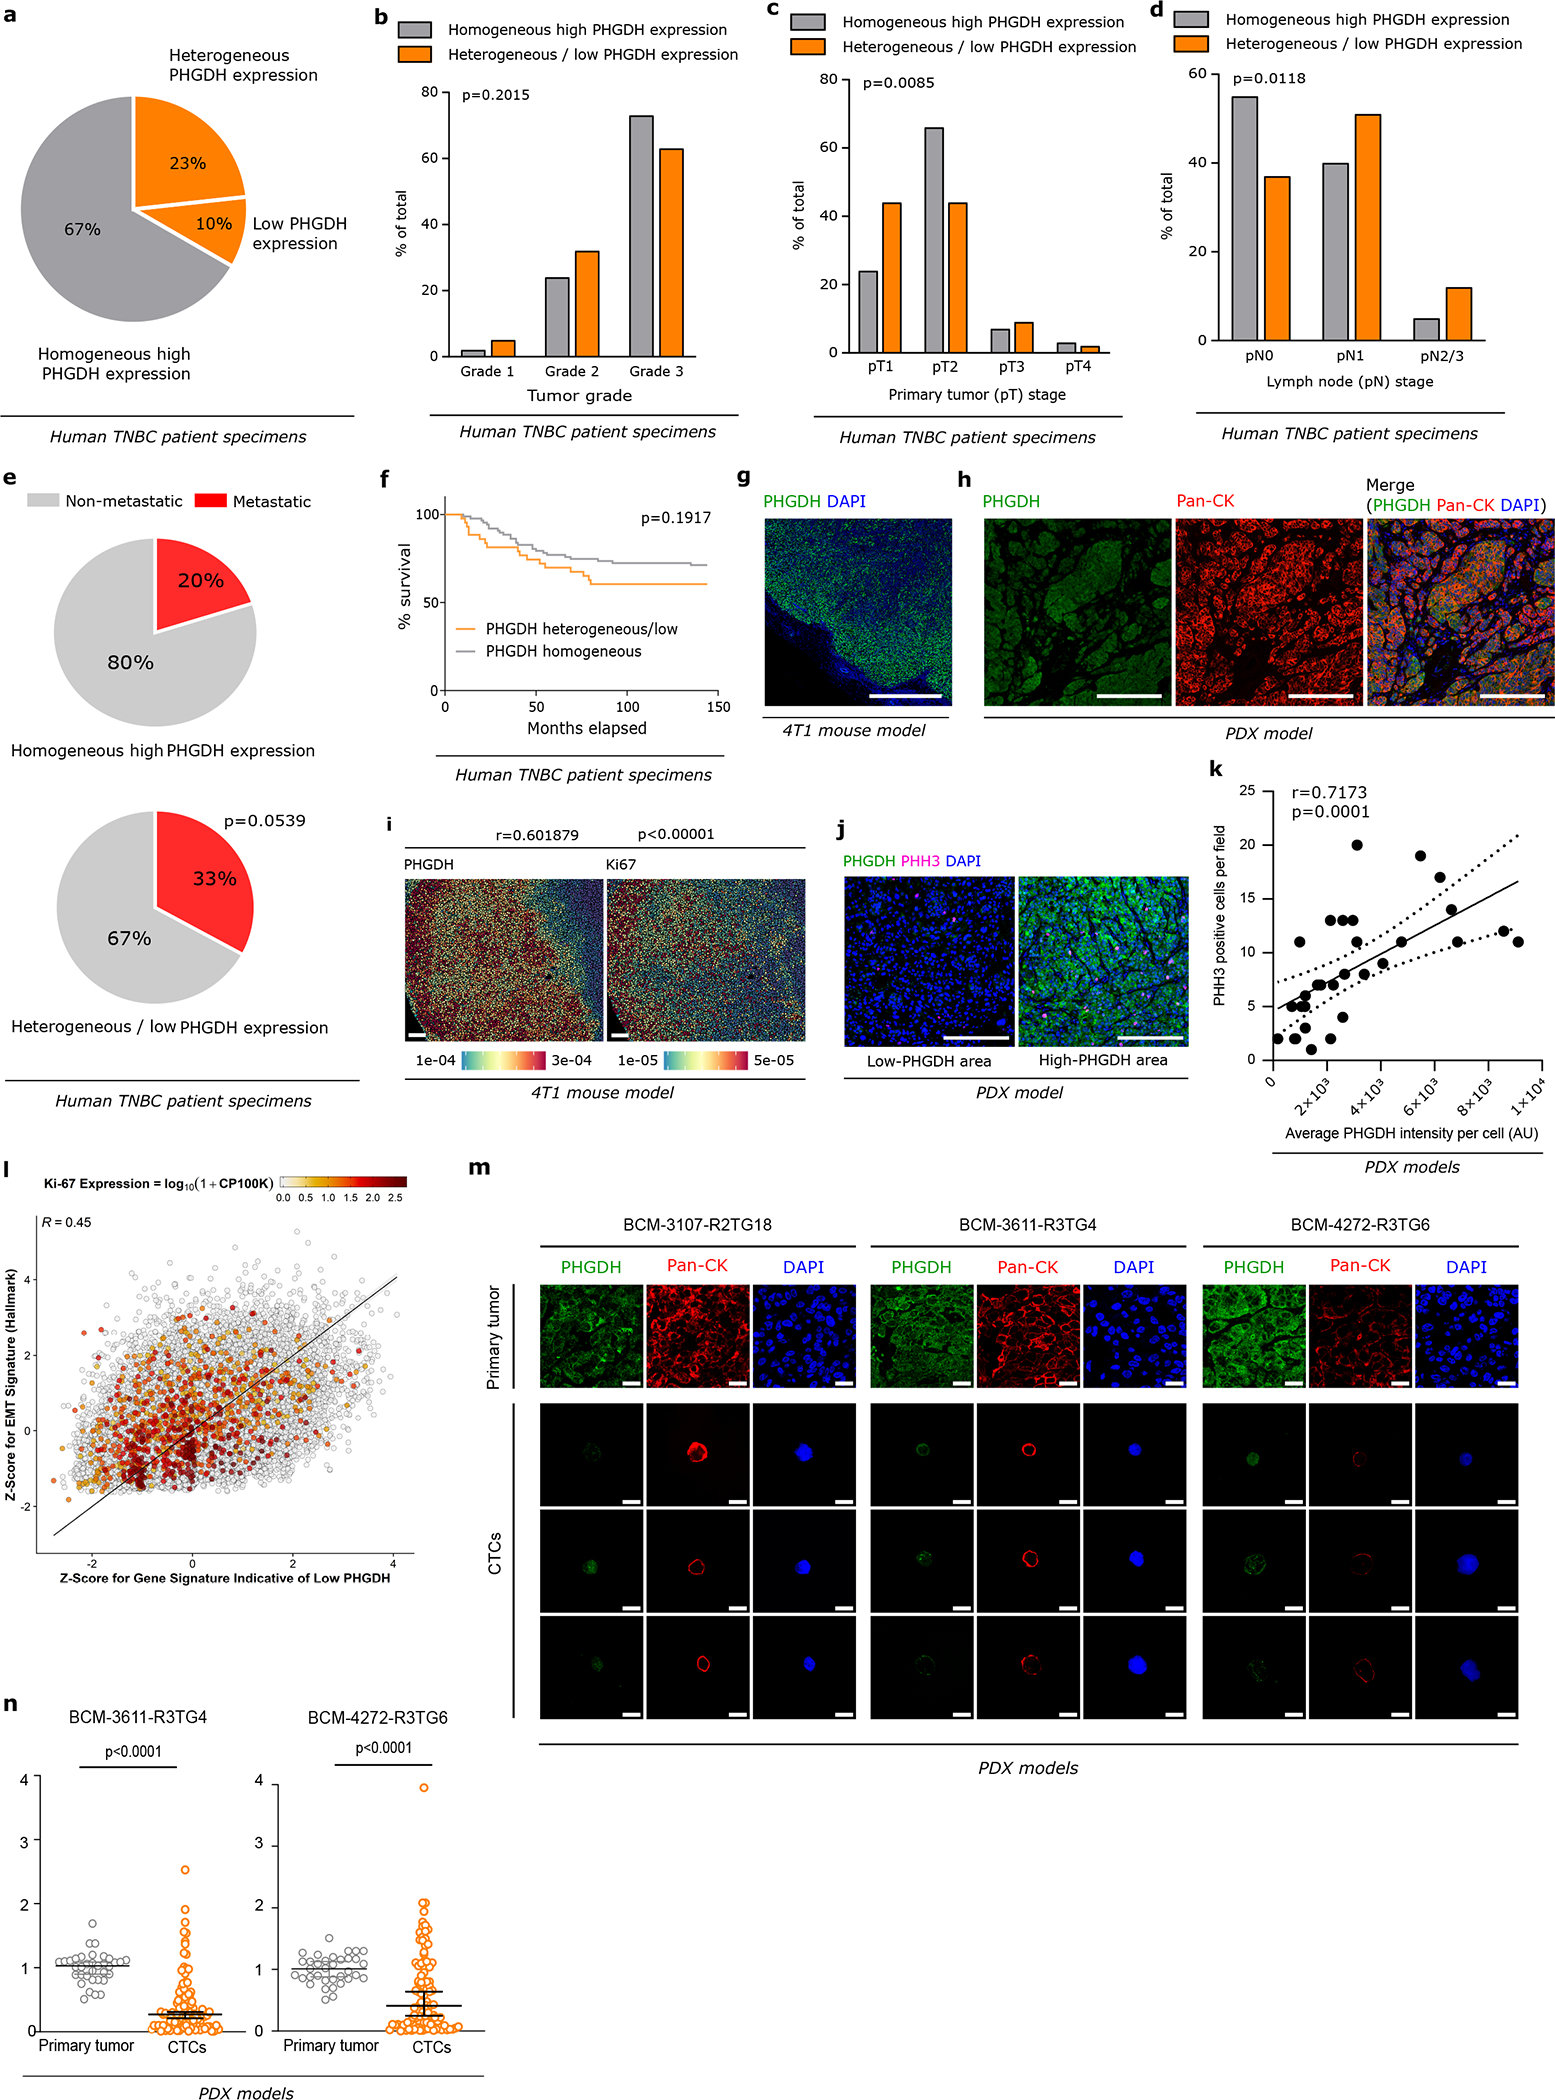
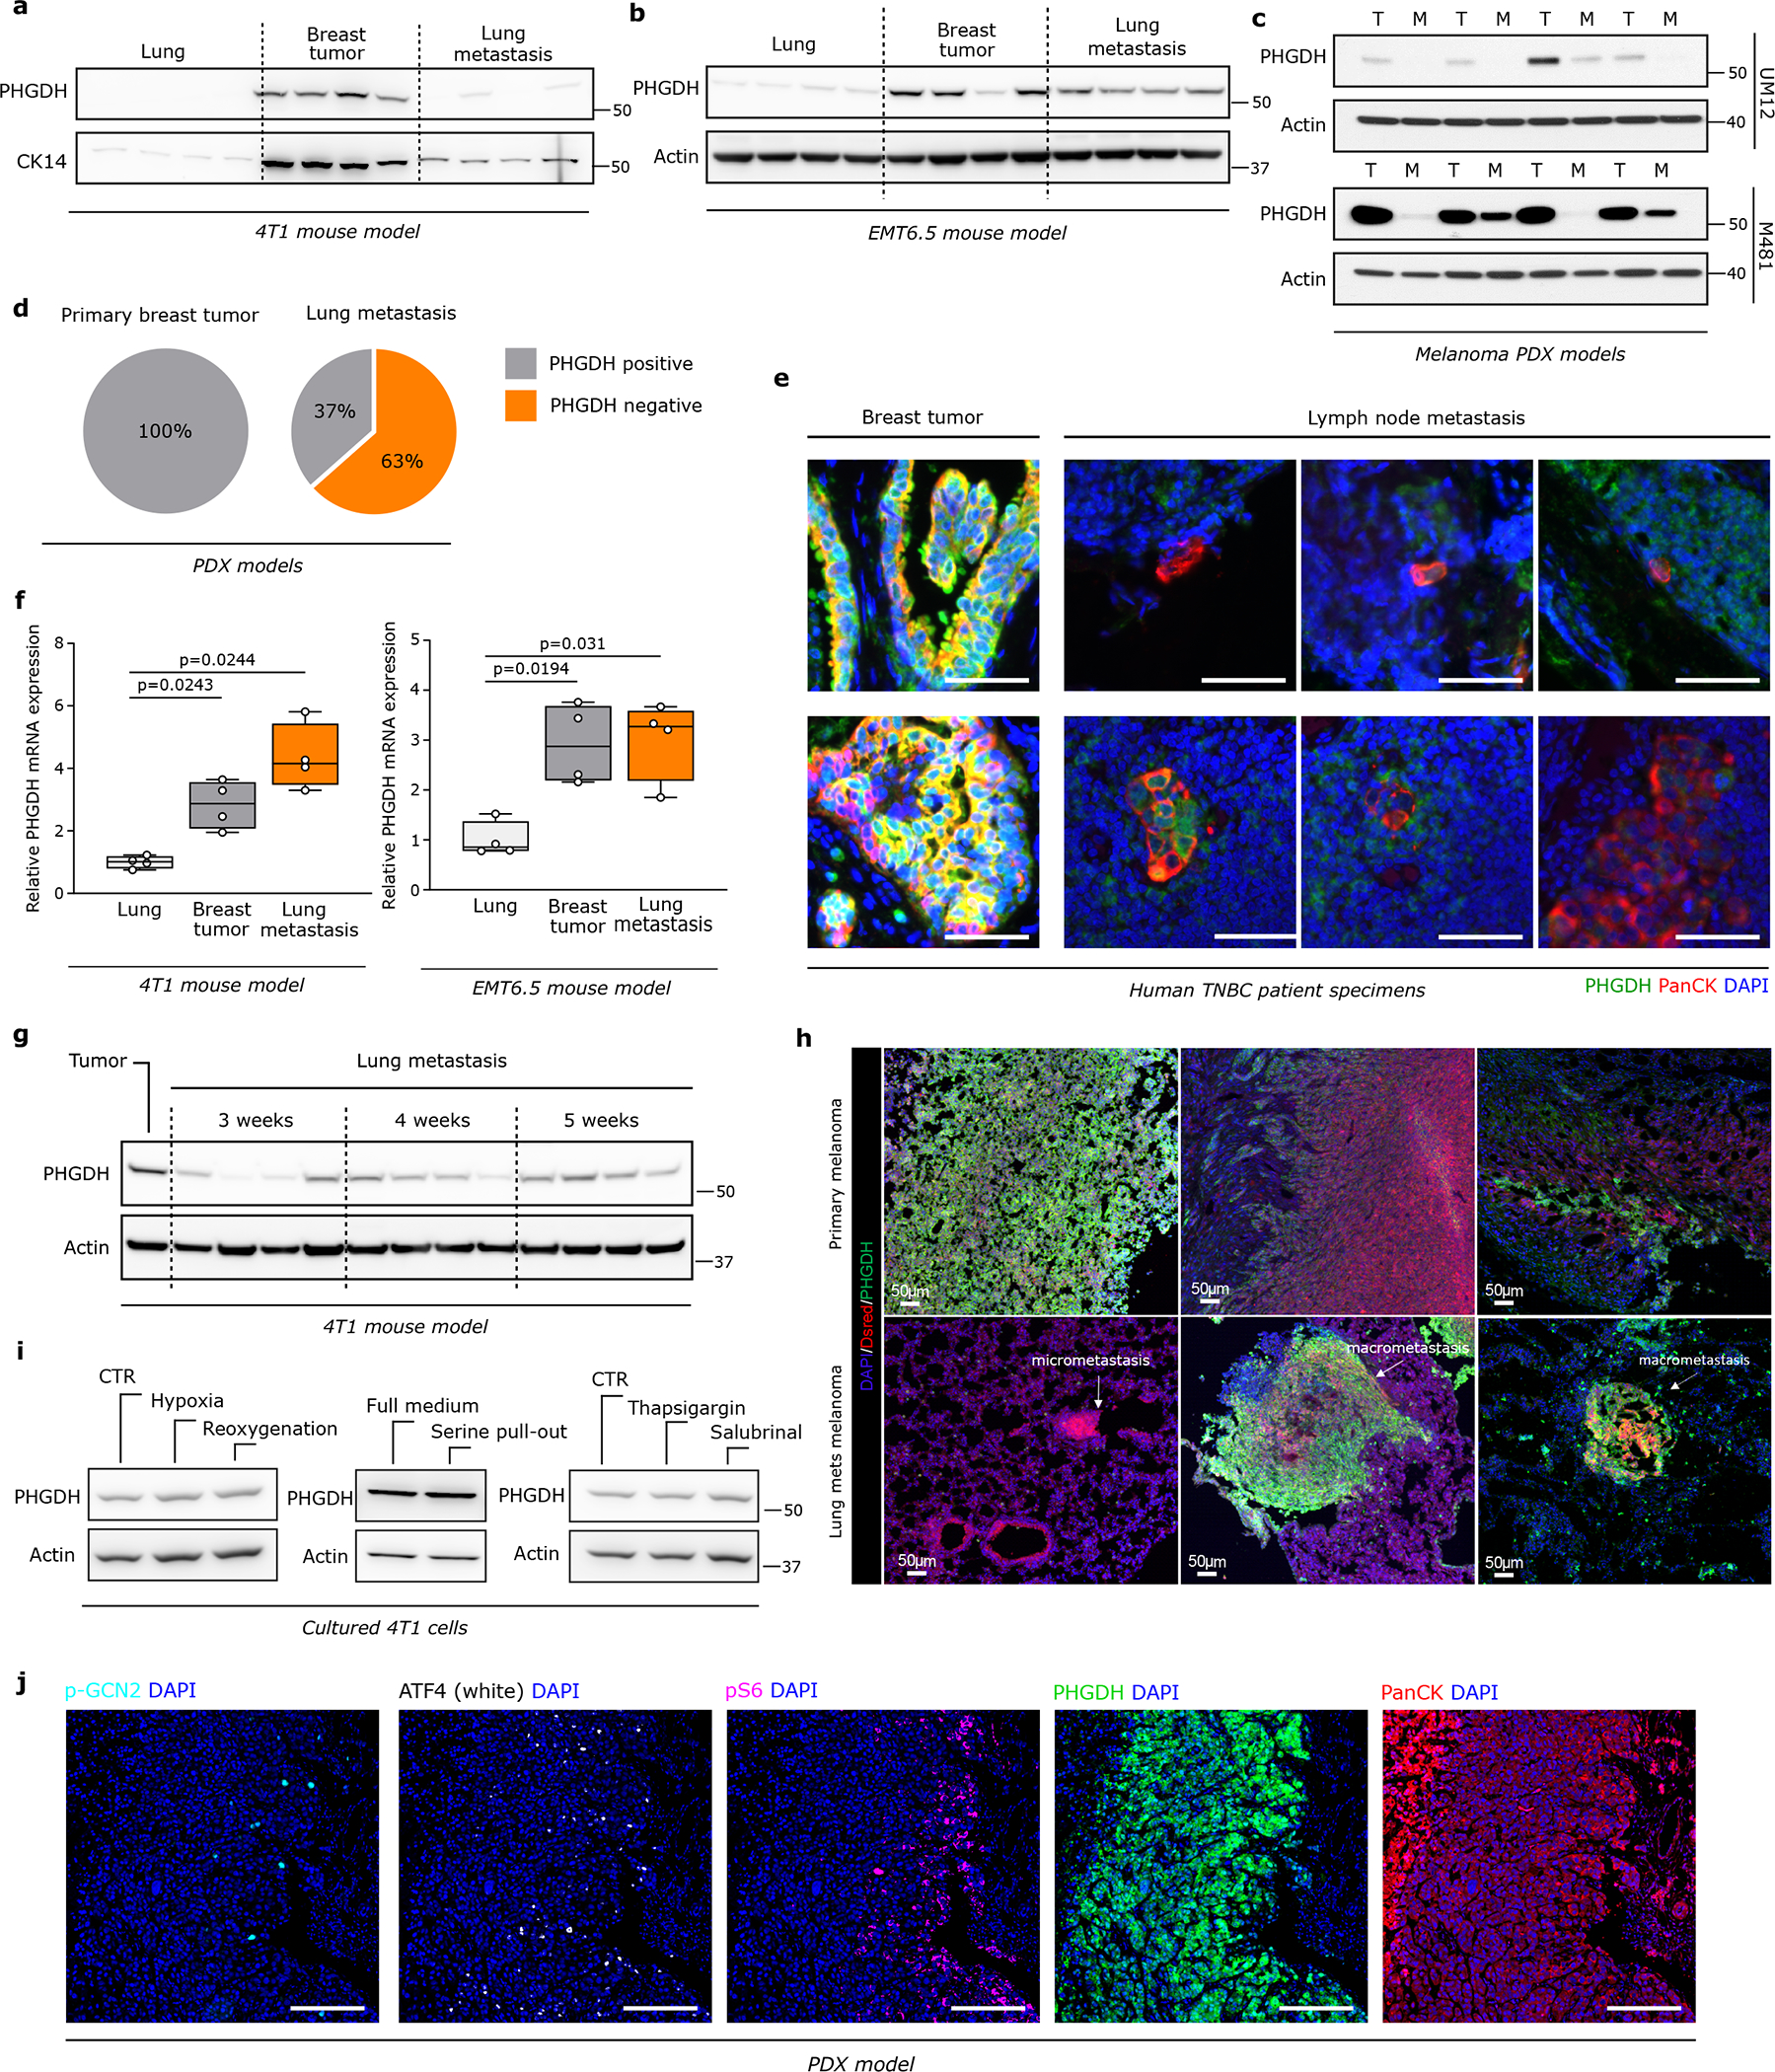
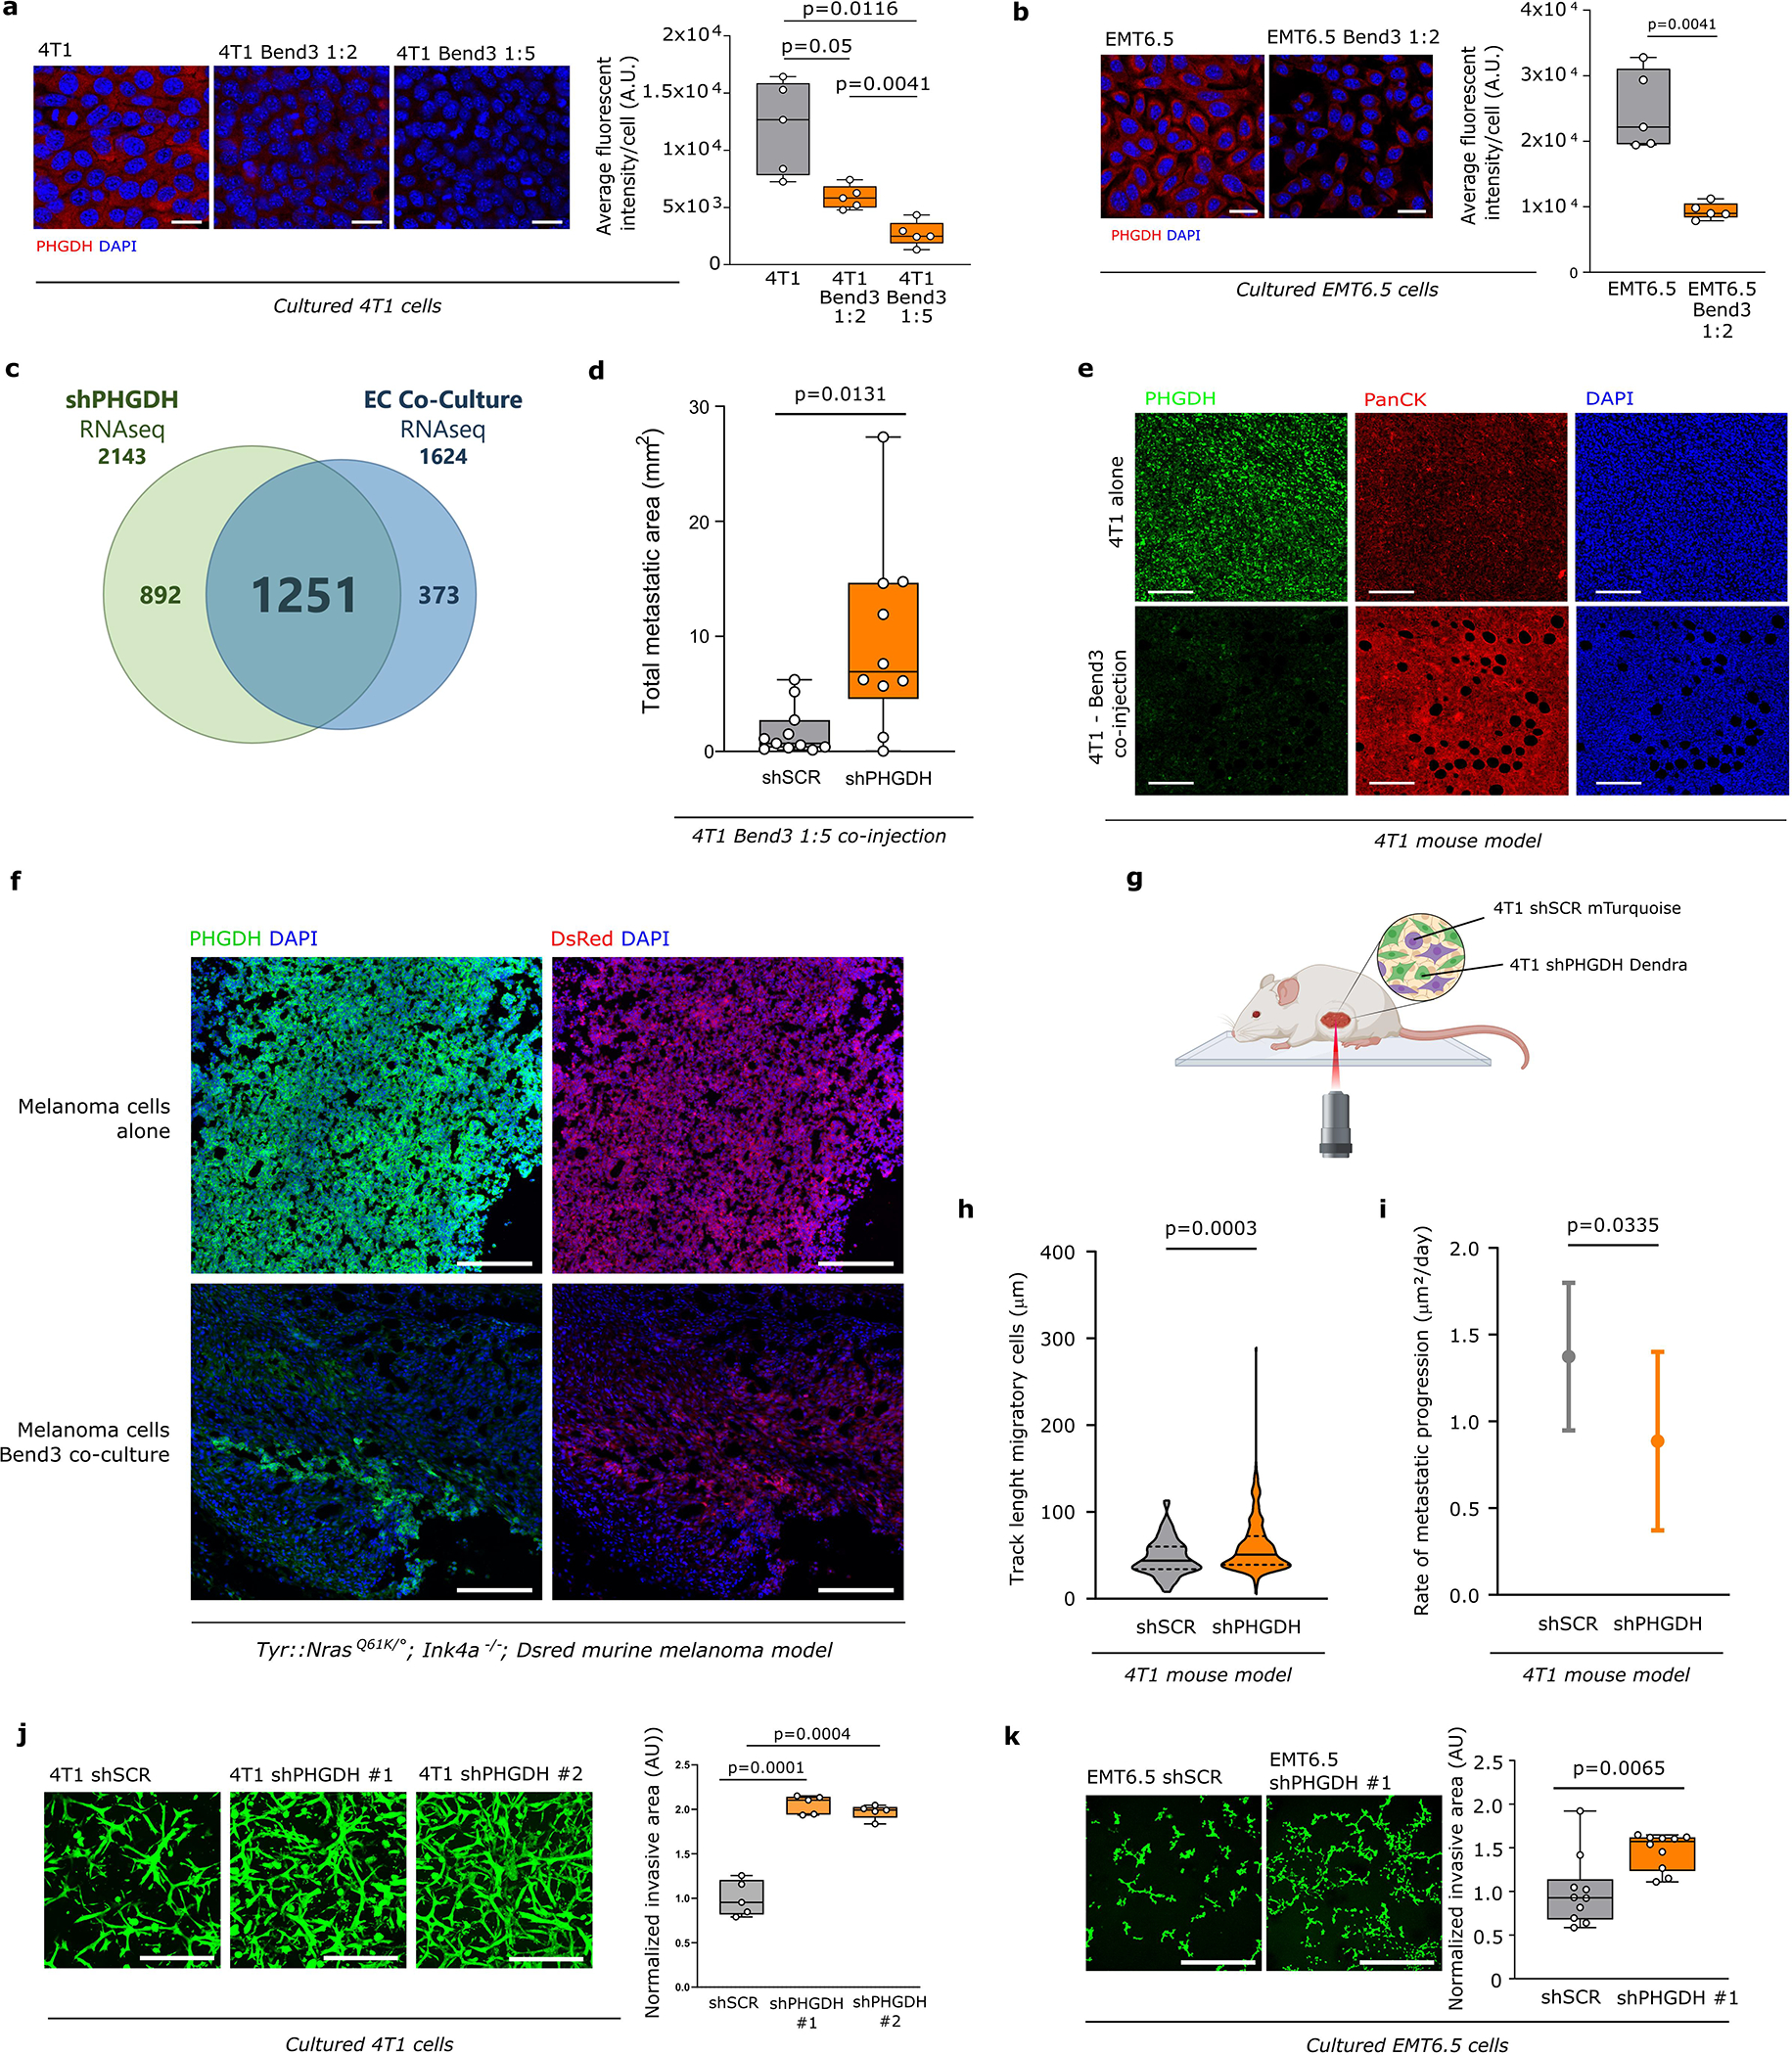
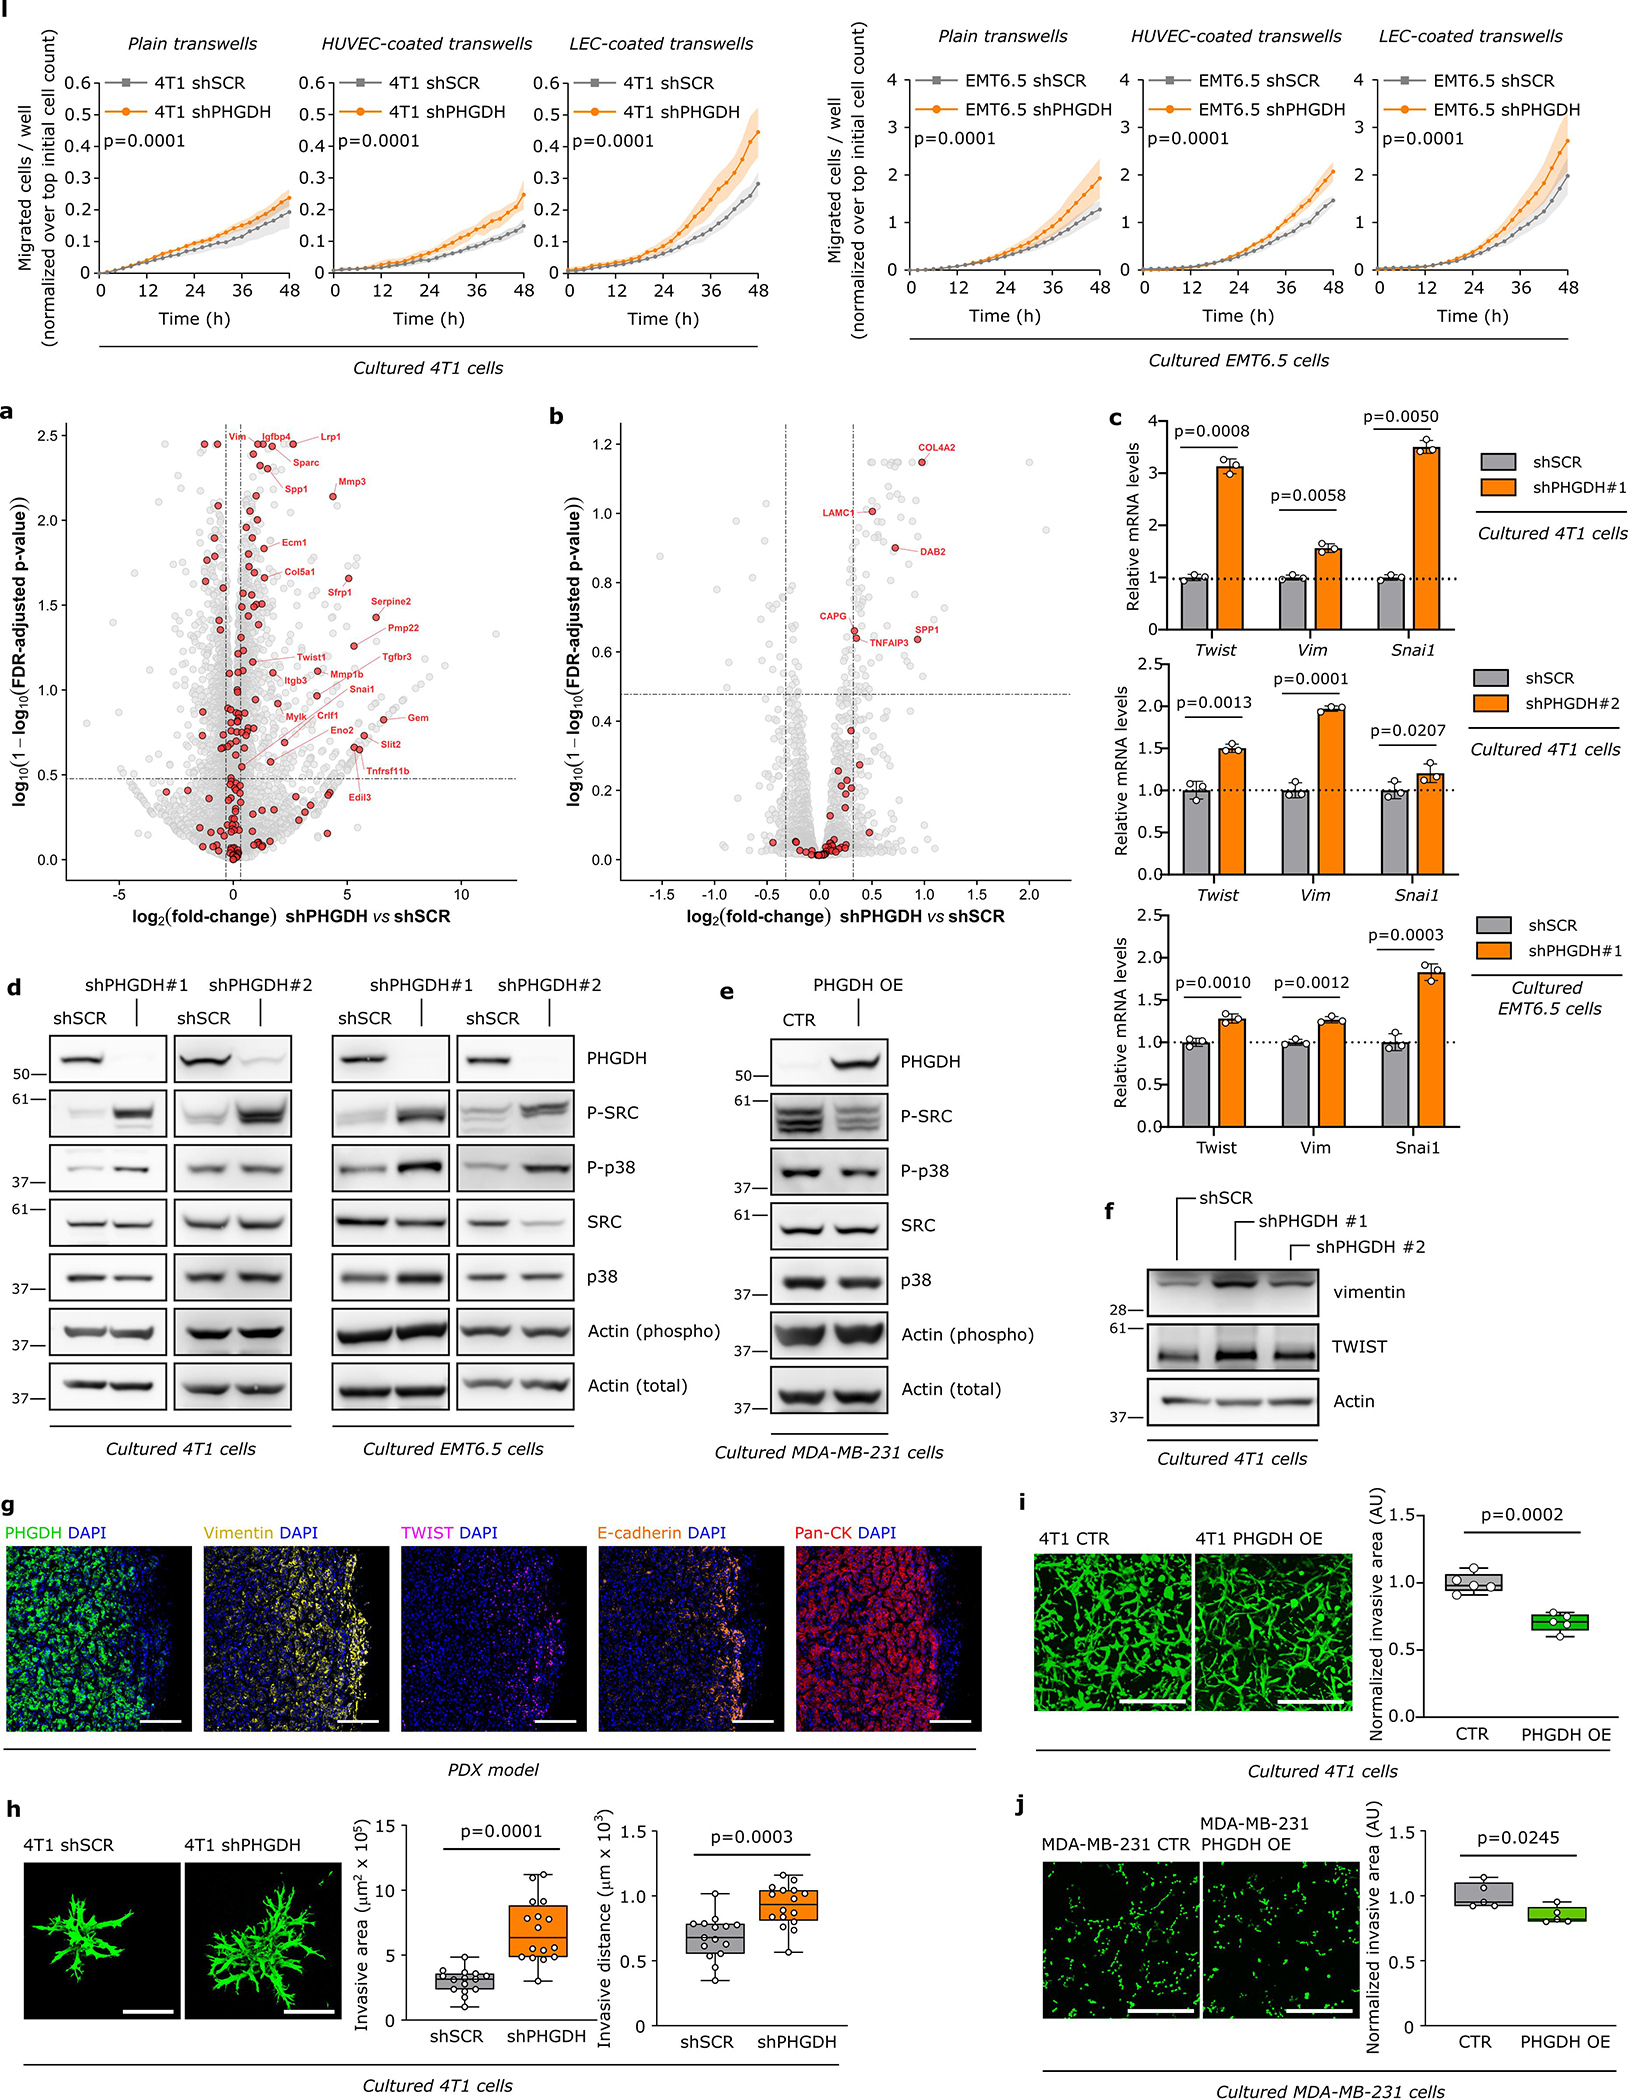
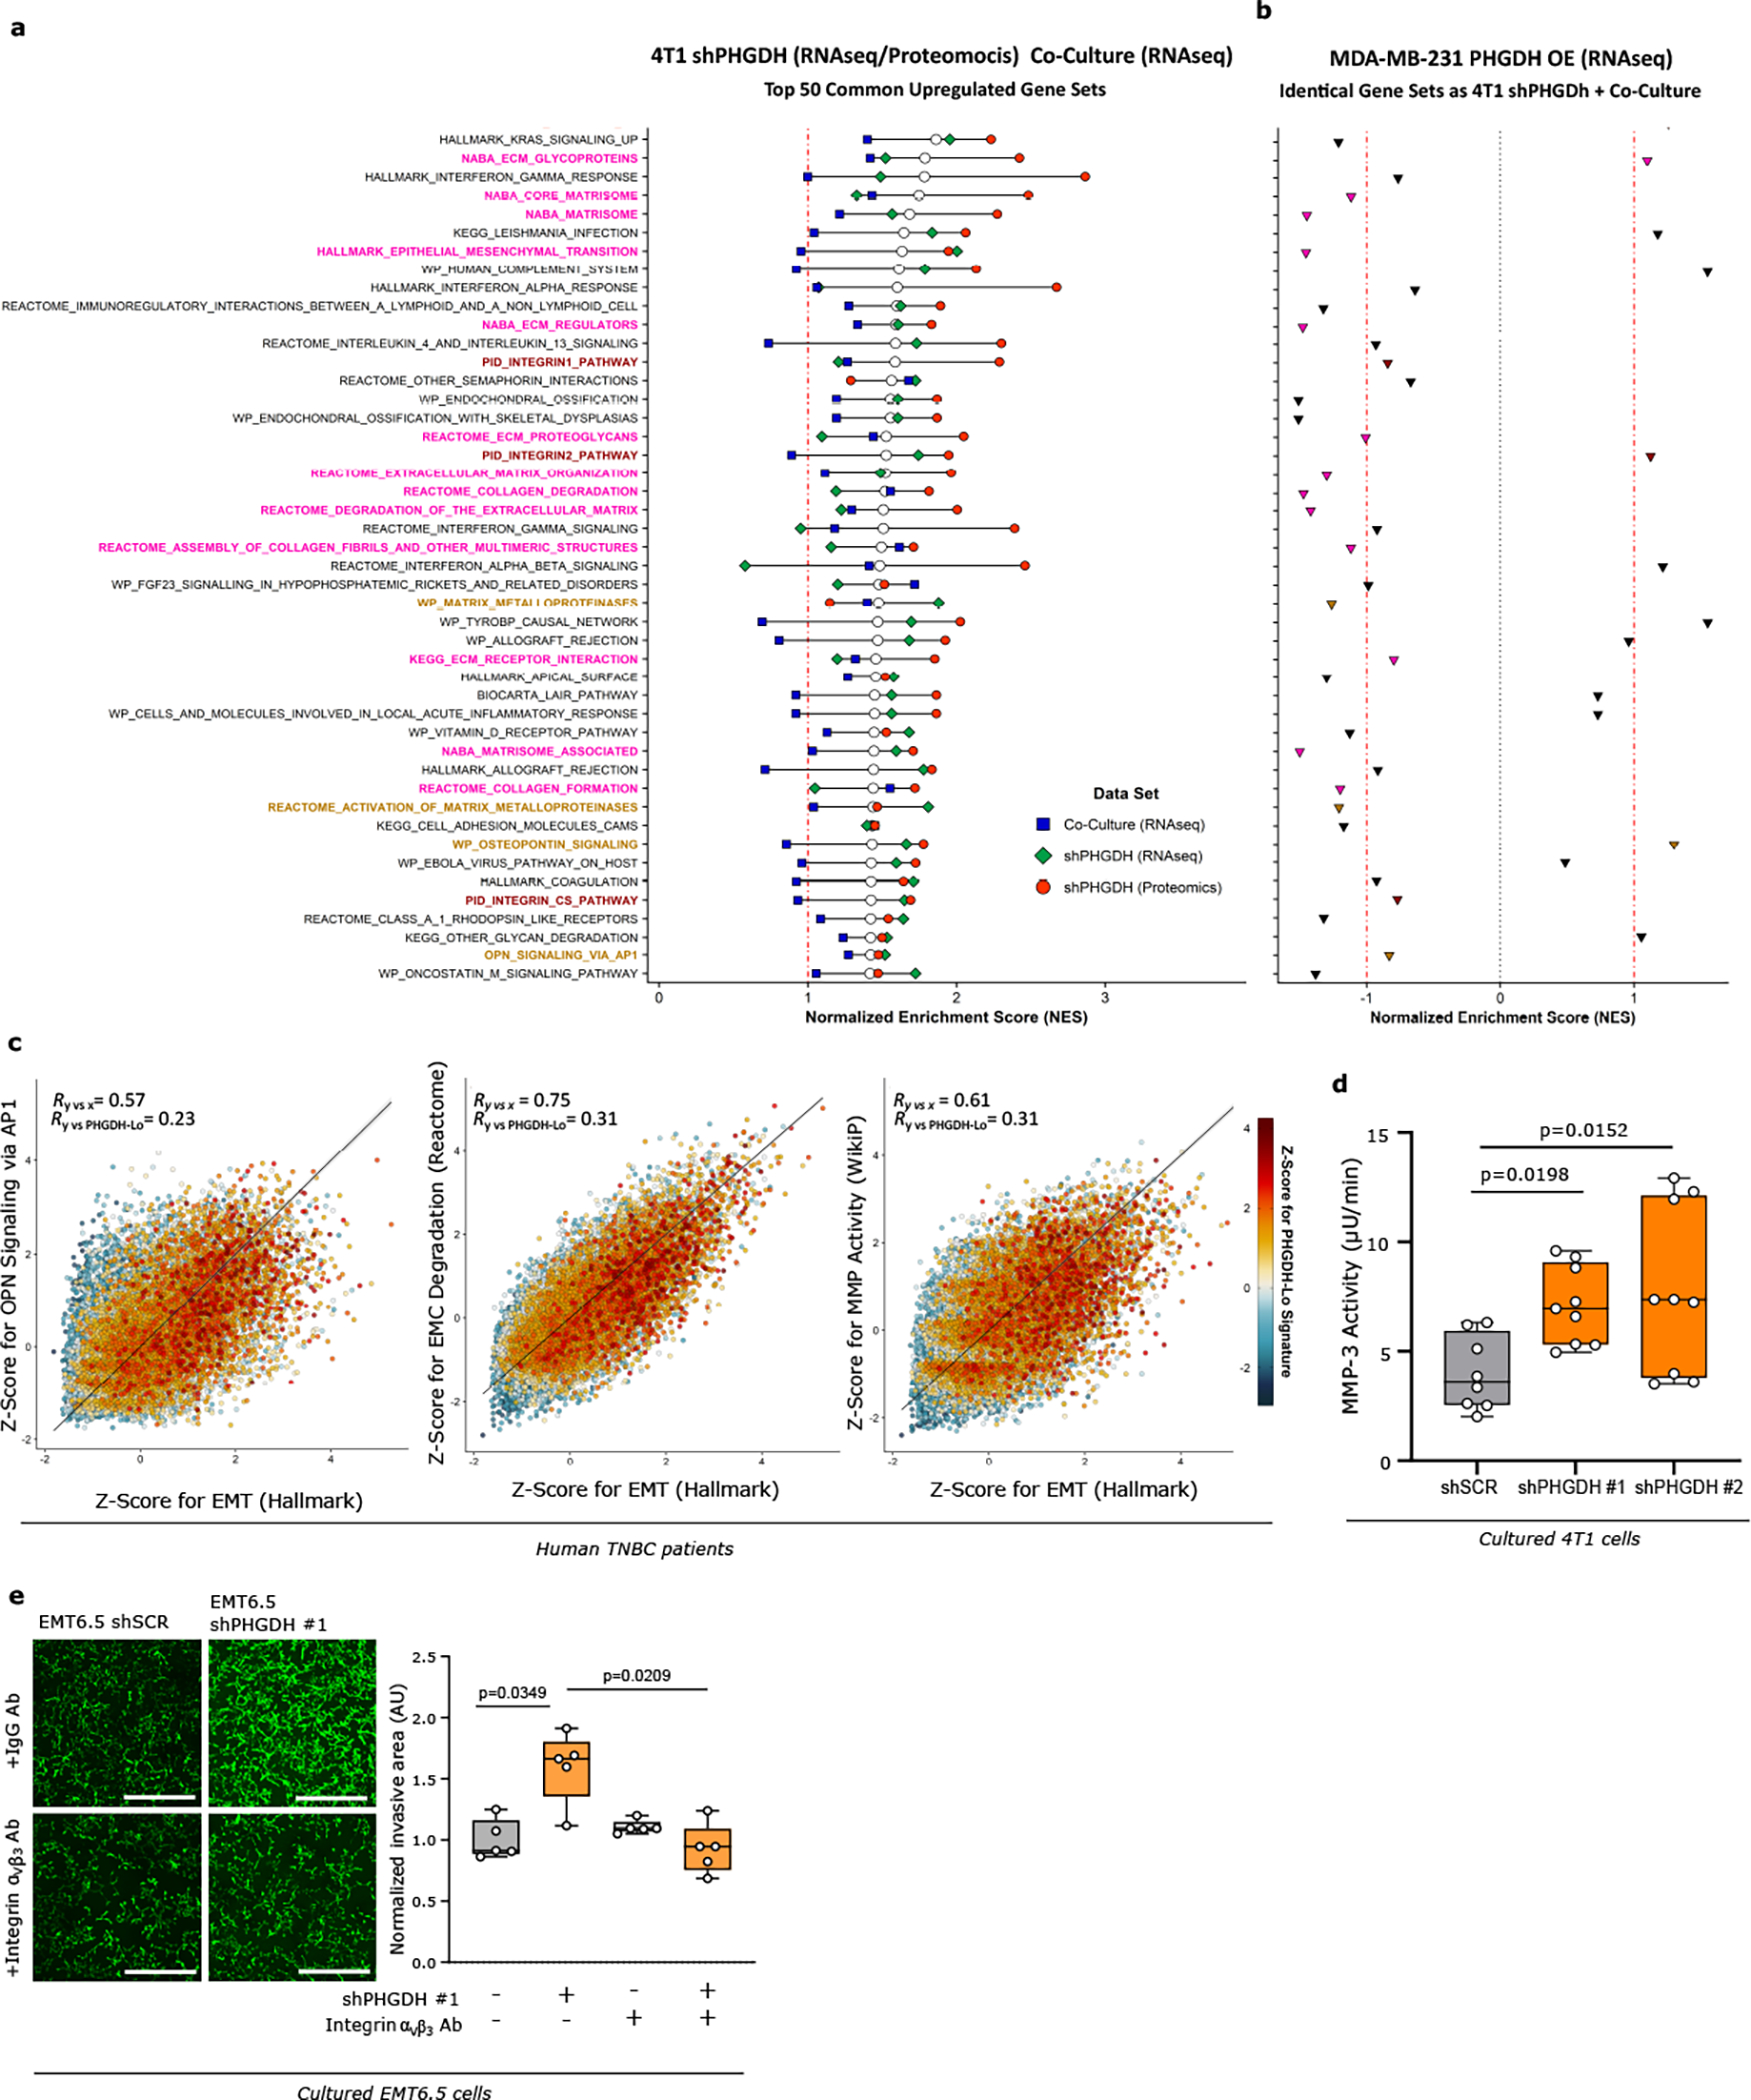
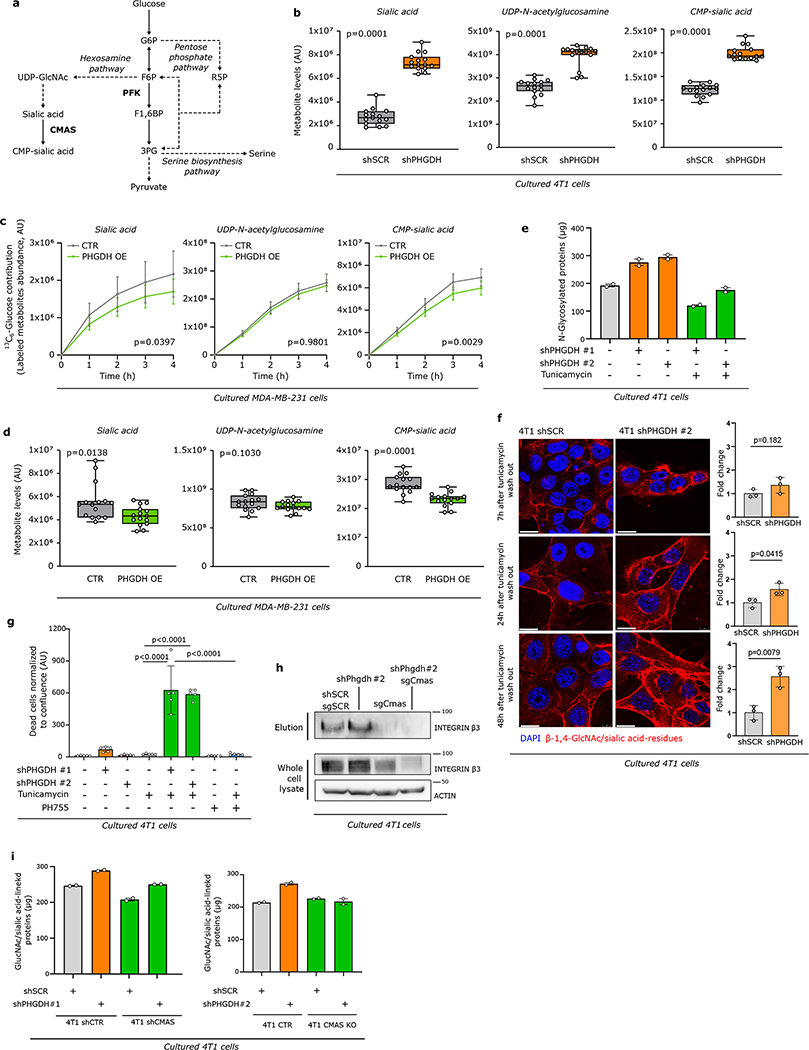
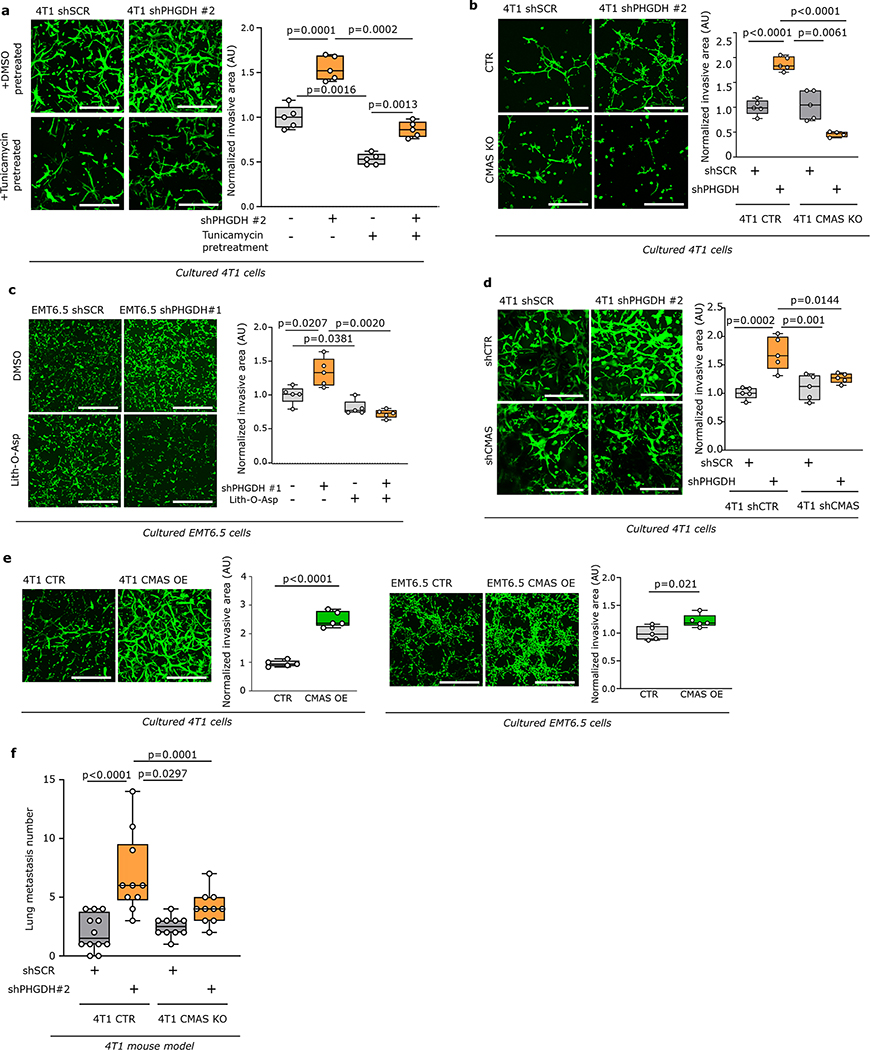
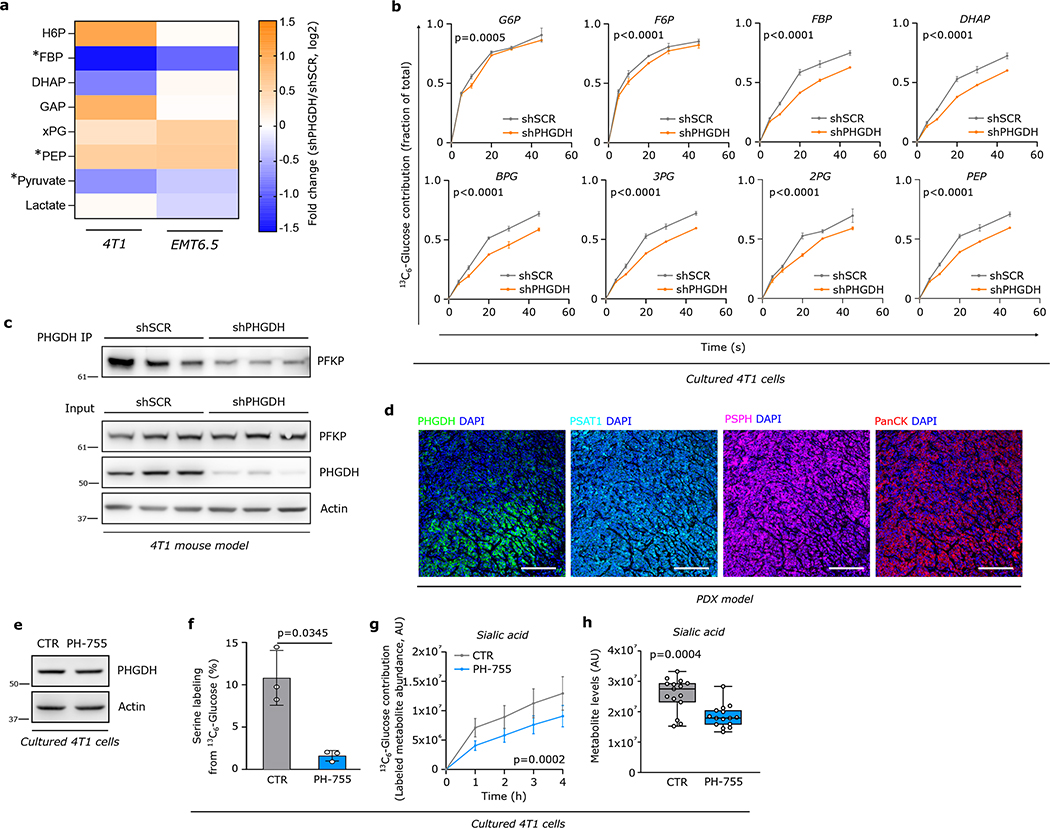
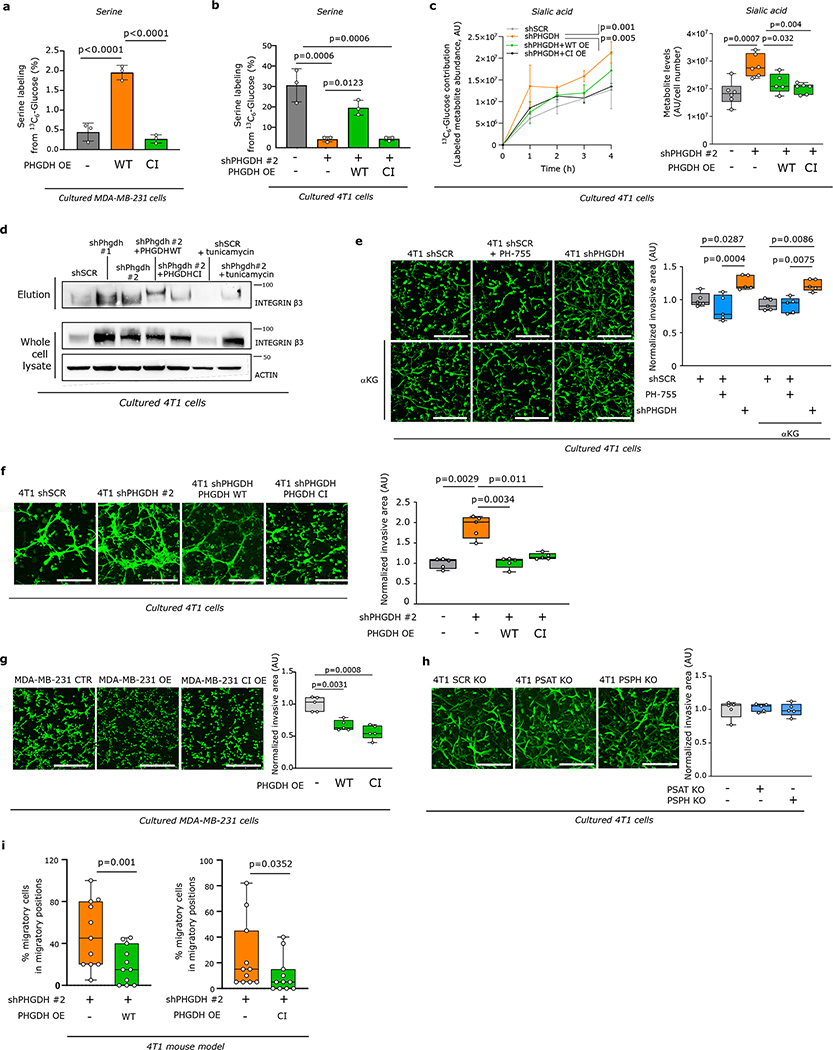
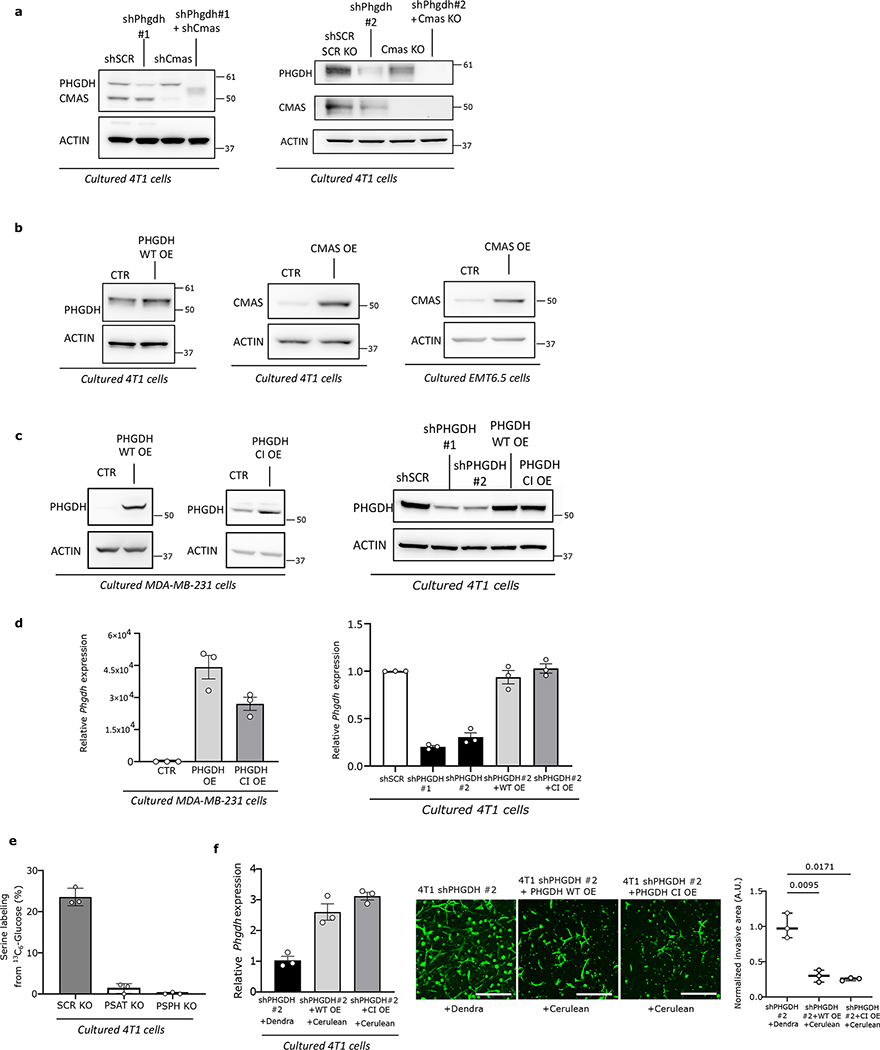
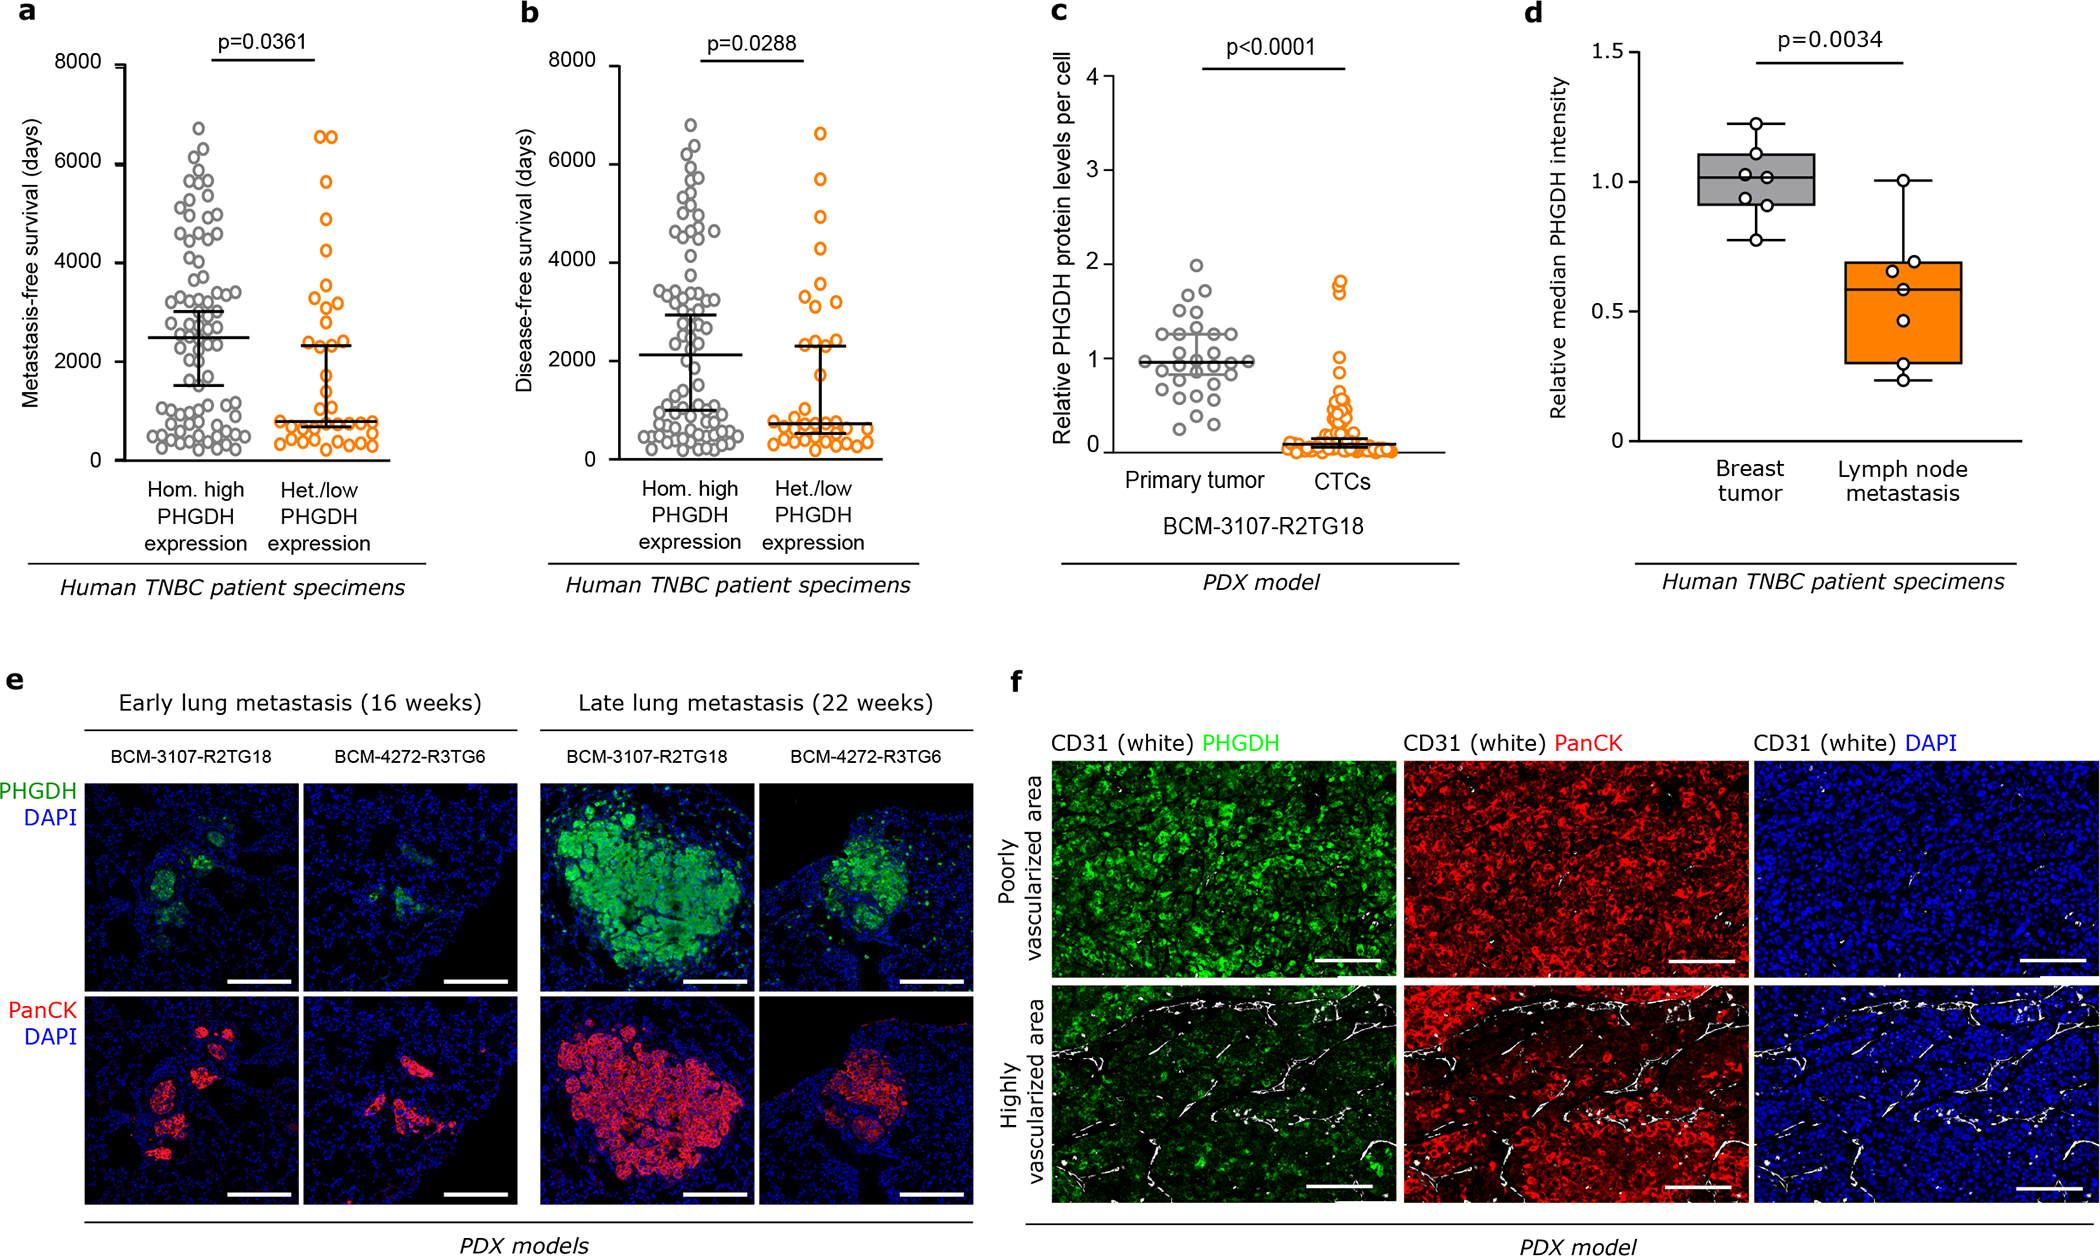
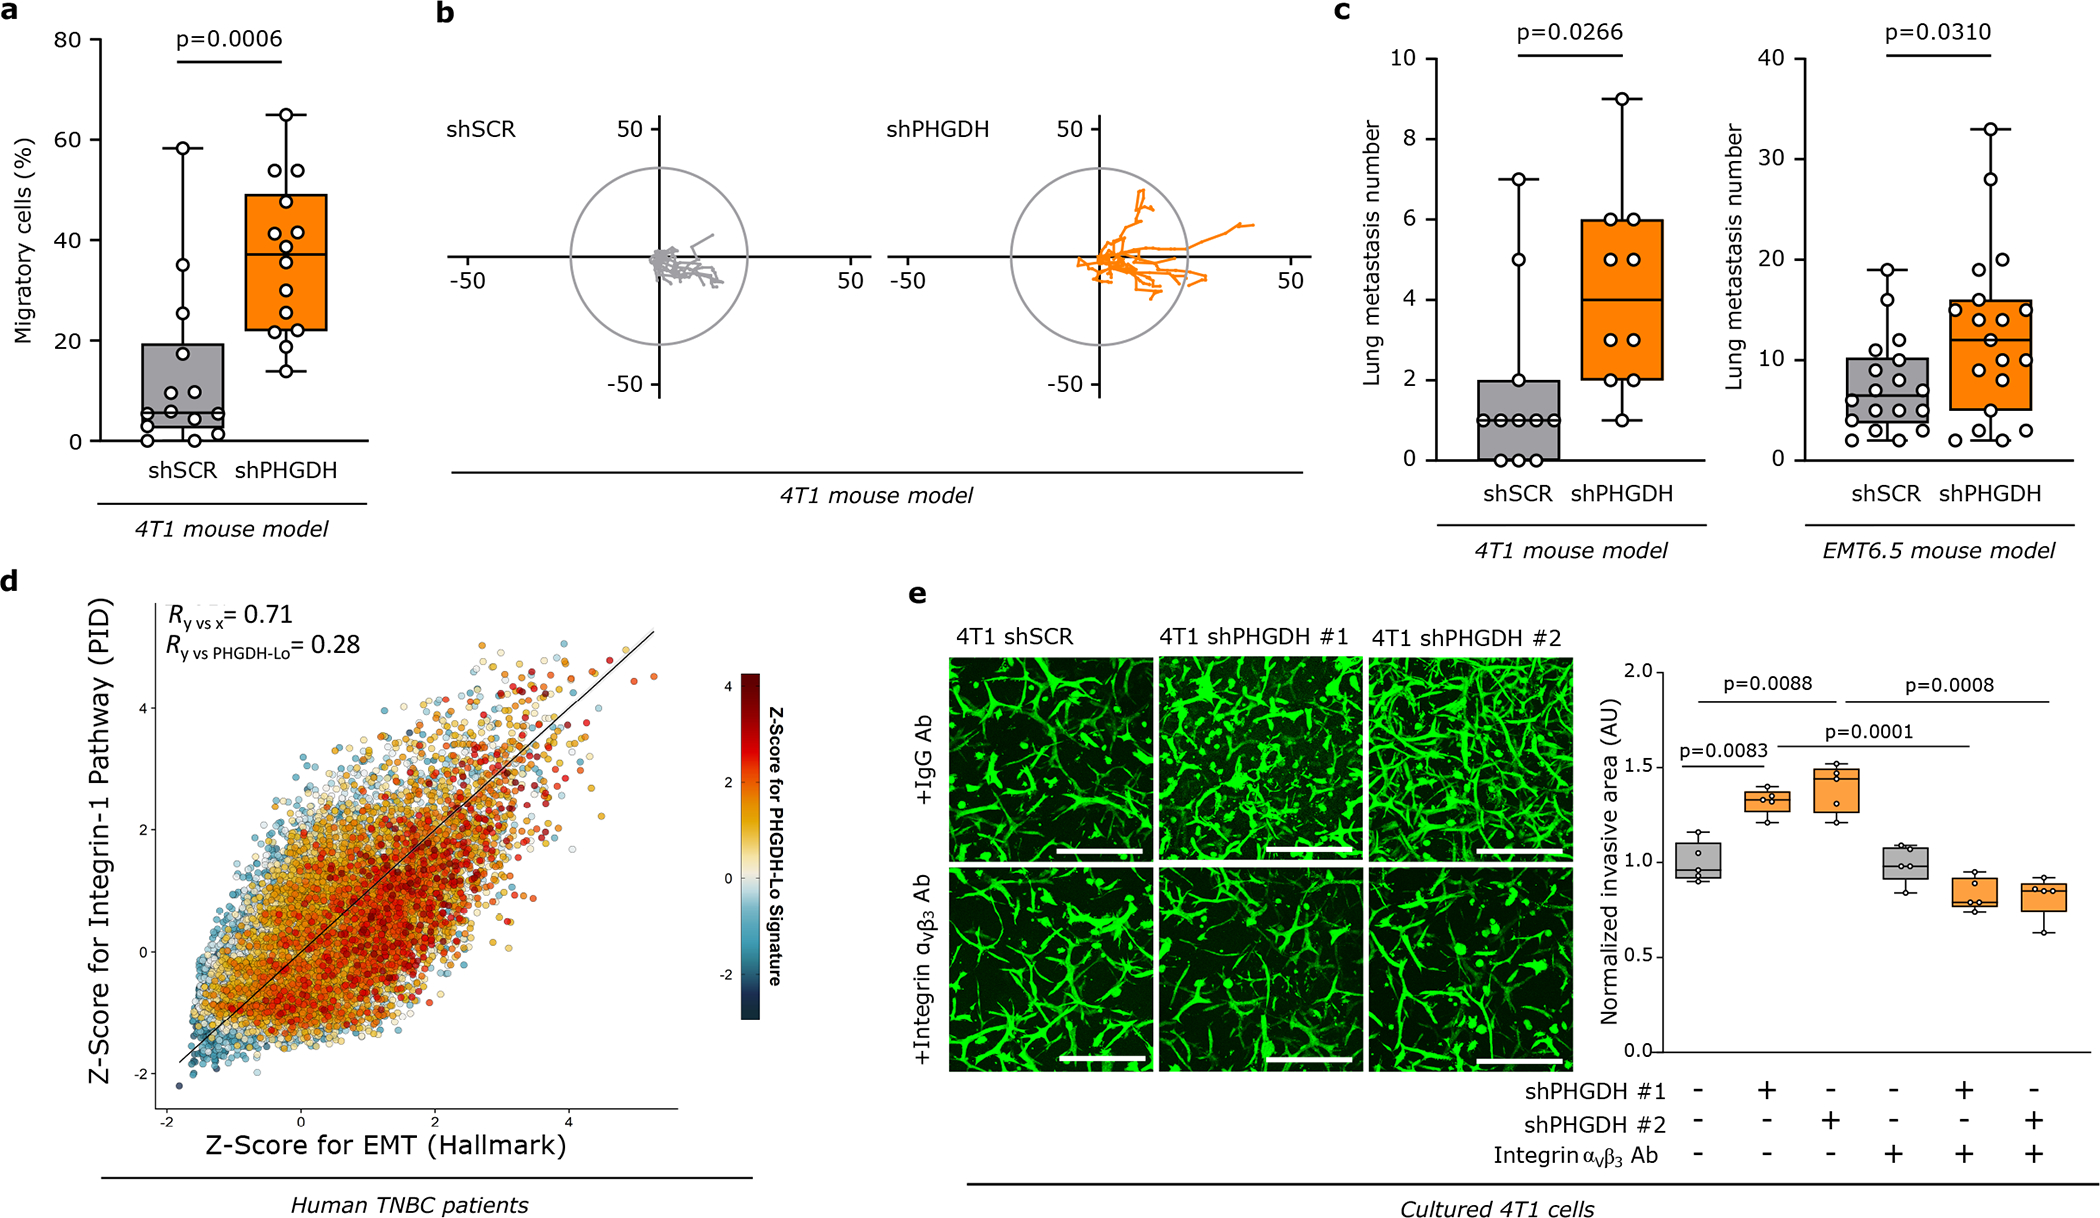
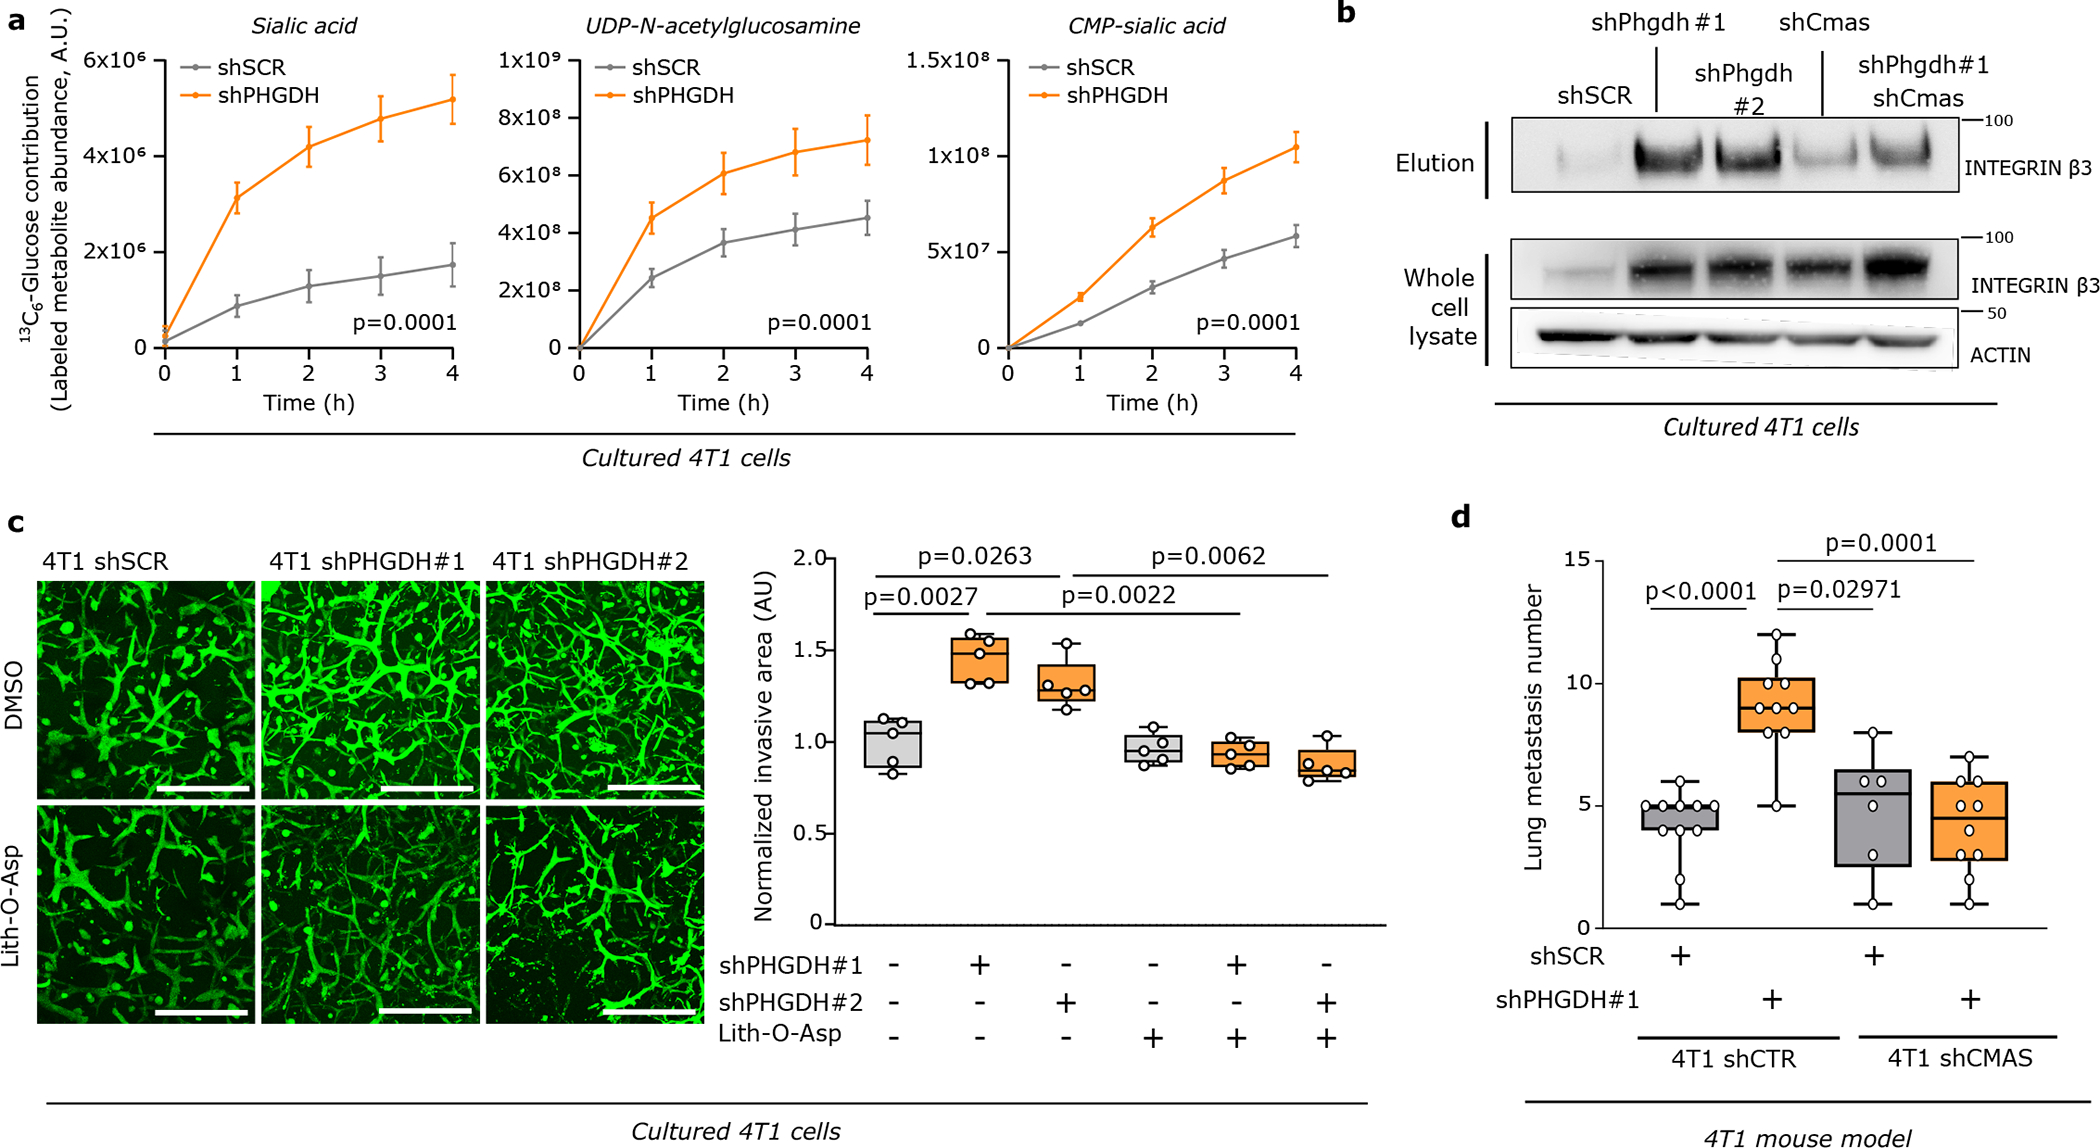
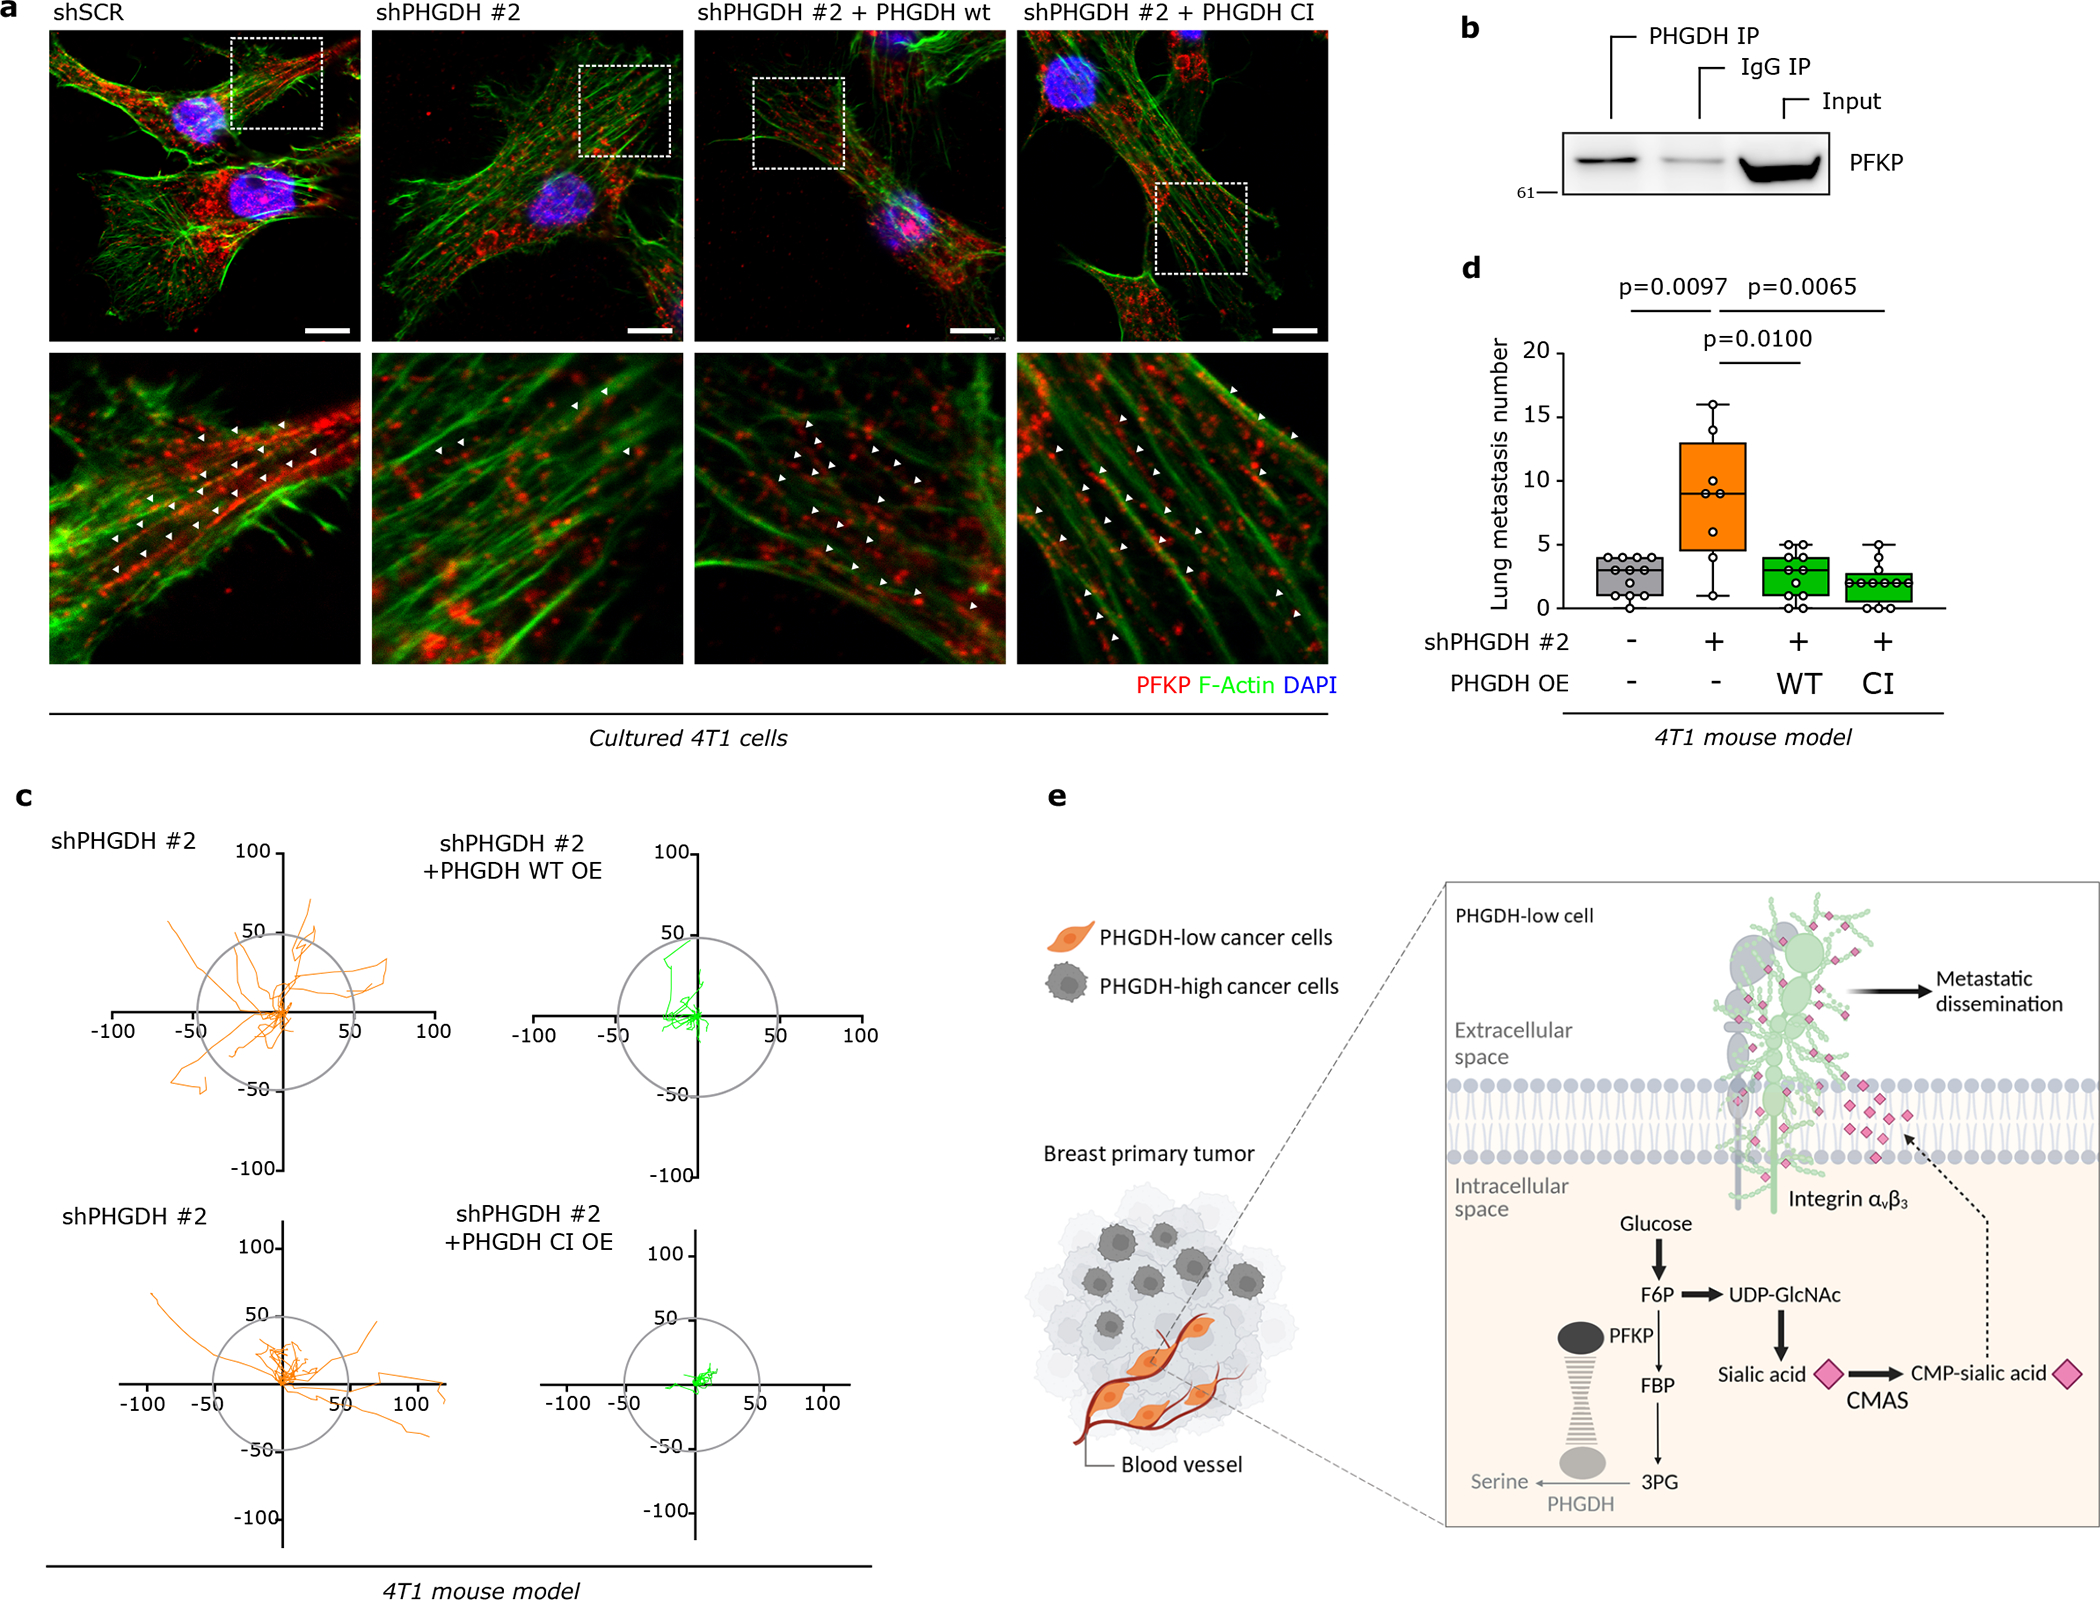
Cancer metastasis requires the transient activation of cellular programs enabling dissemination and seeding in distant organs1. Genetic, transcriptional and translational heterogeneity contributes to this dynamic process2,3. Metabolic heterogeneity has also been observed4, yet its role in cancer progression is less explored. Here we find that the loss of phosphoglycerate dehydrogenase (PHGDH) potentiates metastatic dissemination. Specifically, we find that heterogeneous or low PHGDH expression in primary tumours of patients with breast cancer is associated with decreased metastasis-free survival time. In mice, circulating tumour cells and early metastatic lesions are enriched with Phgdhlow cancer cells, and silencing Phgdh in primary tumours increases metastasis formation. Mechanistically, Phgdh interacts with the glycolytic enzyme phosphofructokinase, and the loss of this interaction activates the hexosamine-sialic acid pathway, which provides precursors for protein glycosylation. As a consequence, aberrant protein glycosylation occurs, including increased sialylation of integrin αvβ3, which potentiates cell migration and invasion. Inhibition of sialylation counteracts the metastatic ability of Phgdhlow cancer cells. In conclusion, although the catalytic activity of PHGDH supports cancer cell proliferation, low PHGDH protein expression non-catalytically potentiates cancer dissemination and metastasis formation. Thus, the presence of PHDGH heterogeneity in primary tumours could be considered a sign of tumour aggressiveness.


Conflict of interest statement

DECLARATION OF INTERESTS

S-MF has received funding from Bayer AG, Merck and Black Belt Therapeutics, has consulted for Fund+ and is in the advisory board of Alesta Therapeutics. TGPG has consulted for Boehringer Ingelheim. MTL is an uncompensated President, CEO, and Limited Partner of StemMed Ltd. and an uncompensated Manager in StemMed Holdings LP, its General Partner. He is a founder and equity holder in Tvardi Therapeutics Inc., and a faculty member at Baylor College of Medicine. LED is a compensated employee at Baylor College of Medicine. All other authors declare no competing interests.

Figures

Extended Data Figure 1:
Extended Data Figure 1:. Circulating tumor cells and early metastatic lesions exhibit low PHGDH expression
a. Distribution of PHGDH expression in human TNBC primary tumor specimens. PHGDH expression was assessed by immunohistochemistry (n=129). b. Comparison of the tumor grade in human TNBC primary tumors with homogeneous high and heterogeneous/low PHGDH expression (n=126). Chi-squared test. c. Comparison of the tumor stage (pT) in human TNBC primary tumors with homogeneous high and heterogeneous/low PHGDH expression (n=129). Chi-squared test. d. Comparison of the lymph node stage (pN) in human TNBC primary tumors with homogeneous high and heterogeneous/low PHGDH expression (n=128). Chi-squared test. e. Metastasis occurrence in TNBC patients bearing primary tumors with homogeneous high (17 out of 87) or heterogeneous/low (14 out of 42) PHGDH expression (n=129). Fisher’s exact test, two-sided. f. Kaplan-Mayer curve comparing the % of survival of TNBC patients with heterogeneous/low and homogeneous PHGDH protein expression in the primary tumor (n=129). Mantel-Cox test. g. Representative picture of PHGDH protein heterogeneity in the primary tumor from orthotopic (mammary fat pad, m.f.p.) 4T1 mouse model, assessed by immunohistochemistry. Green, PHGDH; blue, DAPI nuclear staining. Scale bar 1 mm. h. Representative picture of PHGDH protein heterogeneity in the primary tumor from orthotopic (m.f.p.) TNBC PDX model, assessed by immunohistochemistry. Green, PHGDH; red, pan-cytokeratin tumor marker; blue, DAPI nuclear staining. Scale bar 200 μm. i. Distribution and correlation of PHGDH and Ki67 protein expression in the primary tumor from orthotopic (m.f.p.) 4T1 mouse model assessed by imaging mass cytometry. Nonparametric Spearman rank correlation, two-tailed. Scale bar 400 μm. j-k. Correlation of PHGDH and phospho-histone H3 (PHH3) protein expression in the primary tumor from orthotopic (m.f.p.) TNBC PDX model assessed by immunohistochemistry (j). The pooled analysis of 3 different PDX models, on 9 randomly chosen microscopy fields for each model, is shown in (k). Nonparametric Spearman rank correlation, two-tailed. l. Correlation plot between GSVA-based Z-scores for a gene expression signature indicative of low PHGDH and one indicative of EMT, with the color code indicating Ki67 normalized expression levels (CP100k = counts per 100k reads), based on single cell RNA sequencing data for primary tumors of 13 TNBC patients. m. Representative images of the expression levels of PHGDH protein in circulating tumor cells (CTCs) compared to the respective primary tumors from TNBC PDX models, assessed by immunohistochemistry. Green, PHGDH; red, pan-cytokeratin tumor marker; blue, DAPI nuclear staining. Scale bar 25 μm. n. Expression levels of PHGDH protein in circulating tumor cells (CTCs) compared to the corresponding primary tumors from TNBC PDX models, assessed by immunohistochemistry (complementary to Figure 1c). Analysis performed on PDX models BCM-3611-R3TG4 (7 mice, 35 randomly chosen microscopy fields for the primary tumors, 5 per mouse, 104 single CTCs) and BCM-4272-R3TG6 (7 mice, 35 randomly chosen microscopy fields for the primary tumors, 5 per mouse, 101 single CTCs). The solid lines indicate the median, the whiskers indicate the 95% confidence interval. Unpaired t test with Welch’s correction, two-tailed.
Extended Data Figure 2.
Extended Data Figure 2.. PHGDH protein levels but not mRNA expression is low in early metastatic lesions compared to primary tumors and advanced metastatic lesions
a-b. Western blot of PHGDH in lungs, primary breast tumors and lung metastases from orthotopic (m.f.p.) 4T1 (n=4) (a) and EMT6.5 (n=4) (b) mouse models. c. Western blot analysis of PHGDH in primary tumors and liver metastases from two different orthotopic (subcutaneous) melanoma PDX models (n=4). d. Positivity to PHGDH in primary breast tumors (n=9) and early lung metastases (~16 weeks after primary tumor initiation; n=52) from TNBC PDX models assessed by immunohistochemistry. e. Representative images of PHGDH protein expression in lymph node metastases and matching primary breast tumors from TNBC patients assessed by immunohistochemistry. Green, PHGDH; red, pan-cytokeratin tumor marker; blue, DAPI nuclear staining. Scale bar 50 μm. f. Relative change in Phgdh gene expression in lungs, primary breast tumors and lung metastases from orthotopic (m.f.p.) 4T1 and EMT6.5 mouse models (n=4). The solid lines indicate the median, the boxes extend to the 25th and 75th percentiles, the whiskers span the minimum and maximum values. Welch and Brown-Forsythe ANOVA with Dunnett’s multiple comparison. g. Western blot of PHGDH in lung metastases from orthotopic (m.f.p.) 4T1 mouse model (n=4), at 3, 4 and 5 weeks after injection of the cancer cells. h. Representative pictures of PHGDH protein expression in primary and metastatic melanoma mouse model (Tyr::N-Ras+/Q61K;Ink4a−/−). Green, PHGDH; red, dsRed tumor cell marker; blue, DAPI nuclear staining. i. Western blot of PHGDH levels in 4T1 cells upon hypoxia and reoxygenation, serine pull-out compared to full medium, and treatment with salubrinal (ATF4 activation) or thapsigargin (ER stress induction). One representative experiment is shown (n=3). j. Representative pictures of expression levels of PHGDH and ATF4 activation markers in TNBC PDX model, assessed by multiplex immunofluorescence. Turquoise, p-GCN2; White, ATF4; Pink, pS6; Green, PHGDH; red, pan-cytokeratin tumor marker; blue, DAPI nuclear staining. Scale bar 200 μm.
Extended Data Figure 3.
Extended Data Figure 3.. Proximity to endothelial cells induces loss of PHGDH in cancer cells
a-b. PHGDH expression in 4T1 (1:2 and 1:5 ratio) and EMT6.5 cells (1:2 ratio) co-cultured with Bend3 immortalized mouse endothelial cells based on immunofluorescence. Left panel, representative pictures (scale bar 50 μm), red, PHGDH; blue, DAPI nuclear staining. The image represented was selected to show only 4T1/EMT6.5 cells based on pan-cytokeratin expression in cancer cells and GFP expression in Bend3 cells. Right panel, fluorescent intensity quantification (n=4 independent samples). Solid lines indicate the median, the boxes extend to the 25th and 75th percentiles, the whiskers span the minimum and maximum values. Welch and Brown-Forsythe ANOVA with Dunnett’s multiple comparison (a) and unpaired t test with Welch’s correction, two-tailed (b). c. Venn diagram depicting the number of overlapping enriched gene sets, based on Gene Set Enrichment Analysis (GSEA) in RNAseq data from 4T1 Phgdh knock-down (shPHGDH) compared to control cells (left), versus enriched gene sets in 4T1 and EMT6.5 cells co-cultured (1:2 ratio) with Bend3 immortalized mouse endothelial cells (EC Co-Culture) compared to mono-cultured 4T1 or EMT6.5 cells (right). The numbers at the top represent the total enriched gene-sets found in the corresponding data set. d. Lung metastatic area in mice co-injected with 4T1 cancer cells and Bend3 endothelial cells (ratio 1:2) or 4T1 cells alone in the mammary fat pad (n≥10). The solid lines indicate the median, the boxes extend to the 25th and 75th percentiles, the whiskers span the minimum and maximum values. Unpaired t test with Welch’s correction, two-tailed. e. PHGDH protein expression in 4T1 primary tumor of mice injected with cancer cells alone or co-injected with Bend3 immortalized mouse endothelial cells assessed by immunohistochemistry. Green, Phgdh; red, pan-cytokeratin tumor marker; blue, DAPI nuclear staining. Scale bar 200 μm. f. Representative pictures of PHGDH protein expression in primary melanoma model (Tyr::N-Ras+/Q61K;Ink4a−/−) from mice injected with melanoma cells alone or co-injected with melanoma and Bend 3 endothelial cells (ratio 1:2). Green, PHGDH; red, dsRed tumor cell marker; blue, DAPI nuclear staining. Scale bar 200 μm. g. Schematic representation of the time-lapse intravital imaging experiment setup. h. Track length of migratory 4T1 shSCR-mTurquoise and 4T1 shPHGDH-Dendra in primary tumors from orthotopic (m.f.p.) 4T1 mouse model assessed by time-lapse intravital imaging. The solid lines indicate the median, the dashed lines indicate the 25th and 75th percentiles. Unpaired t test with Welch’s correction, two-tailed. i. Rate of metastatic progression of lung metastases from mice injected with either 4T1 shSCR (n=10 per time point) or 4T1 shPHGDH cells (n=10 per time point). Error bars represent standard deviation (s.d.) from mean. Unpaired t test with Welch’s correction, two-tailed. j-k. Invasive capacity of 4T1 and EMT6.5 cells upon Phgdh knock-down (shPHGDH) compared to control (shSCR) cells in a 3D matrix. Invasion was assessed by measuring the invasive area of cancer cells stained with calcein green. Representative images are depicted in the left panel (scale bar 500 μm), quantification in the right panel. Each dot represents a different, randomly selected microscopy field (n=5 for (j), n=10 for (k)). The solid lines indicate the median, the boxes extend to the 25th and 75th percentiles, the whiskers span the minimum and maximum values. Welch and Brown-Forsythe ANOVA with Dunnett’s multiple comparison (j) and Unpaired t test with Welch’s correction, two-tailed (k).
Extended Data Figure 4.
Extended Data Figure 4.. Loss of PHGDH induces a partial EMT and the expression of markers indicating altered cell-cell or cell matrix interactions in cancer cells
a. Migratory ability of 4T1 and EMT6.5 cells upon Phgdh knockdown (shPHGDH) compared to control (shSCR) cells. Migration was assessed in plain transwells and in transwells coated with either vascular endothelial cells (HUVECs) or lymphatic endothelial cells (LECs) (n=3). Two-way ANOVA.b-c. Volcano plots showing genes (b) or proteins (c) upregulated or downregulated upon loss of PHGDH based on RNAseq (b) or proteomics (c) data for 4T1 cells with Phgdh knockdown (shPHGDH) relative to control cells (shSCR). The cutoffs represent p-values of 0.01 and absolute fold-changes of 1.25. Genes (b) or proteins (c) indicative of EMT are shown in red, with labels included for select genes/proteins above the respective p-value/fold-change cutoffs. c. Relative change in Twist, vimentin (Vim) and Snai1 gene expression upon PHGDH knockdown in 4T1 and EMT6.5 cells. Error bars represent standard deviation (s.d.) from mean (n=3). Unpaired t test with Welch’s correction, two-tailed. d. Western blot of phosphorylated proto-oncogene tyrosine-protein kinase Src (c-Src) and p38 mitogen-activated protein kinase upon Phgdh knockdown in 4T1 and EMT6.5 cells. One representative experiment is shown (n=3). e. Western blot of Vimentin and Twist in 4T1 cells upon Phgdh knockdown (shPHGDH) compared to control (shSCR). One representative experiment is shown (n=3). f. Western blot of phosphorylated proto-oncogene tyrosine-protein kinase Src (c-SRC) and p38 mitogen-activated protein kinase upon Phgdh overexpression in MDA-MB-231 cells. One representative experiment is shown (n=3). g. Representative pictures of PHGDH and EMT markers protein expression in TNBC PDX model assessed by multiplex immunofluorescence. Green, PHGDH; Yellow, VIMENTIN; Pink, TWIST; Orange, E-CADHERIN; red, pan-cytokeratin tumor marker; blue, DAPI nuclear staining. Scale bar 200 μm. h. Invasive area and distance of 4T1 cells upon Phgdh knockdown (shPHGDH) compared to control (shSCR) cells (n=15 independent samples). The solid lines indicate the median, the boxes extend to the 25th and 75th percentiles, the whiskers span the minimum and maximum values. Unpaired t test with Welch’s correction, two-tailed. i-j. Invasive capacity of 4T1 and MDA-MB-231 cells upon PHGDH overexpression (PHGDH OE) compared to control (CTR) cells in a 3D matrix. The invasive area of cancer cells was stained with calcein green. Representative images are depicted in the left panel (scale bar 500 μm), quantification in the right panel. Each dot represents a different microscopy field (n=5). The solid lines indicate the median, the boxes extend to the 25th and 75th percentiles, the whiskers span the minimum and maximum values. Unpaired t test with Welch’s correction, two-tailed.
Extended Data Figure 5.
Extended Data Figure 5.. Modulation of PHDGH expression alters gene expression signatures related to metastasis formation
a. GSEA showing the top 50 commonly upregulated gene sets upon integration of the RNAseq/Proteomics data sets for 4T1 cells upon Phgdh knockdown (shPHGDH) compared to control cells, and the RNAseq data set for 4T1 or EMT6.5 cells co-cultured with Bend 3 immortalized mouse endothelial cells, compared to mono-cultured 4T1 or EMT6.5 cells. Normalized enrichment scores (NES) for each data set are indicated by the colored symbols, as defined in the plot legend. Gene sets are ranked based on their average NES among all three data sets, indicated by the white dots, with those gene sets with the highest mean NES shown on top. The red dash-dotted line indicates a NES of 1. The gene-set entries on the y-axis include three single-sample signatures comprising the most differentially upregulated genes in each of the three data sets (color-coded identically to the plot legend), as well as a signature consisting in the intersection of those for the Phgdh knockdown and co-culture RNAseq data (color-coded in orange), indicative of low Phgdh protein expression. The remaining entries on the y-axis are color-coded based on their belonging to one of the following categories: EMT and ECM remodeling (pink), integrin signaling (burgundy), OPN/AP-1 signaling and MMP activity (light brown), or other (black). b. GSEA results based on RNAseq data for MDA-MB-231 cells upon PHGDH overexpression (PHGDH OE) compared to control cells for the identical gene sets as in a. The red dash-dotted lines indicate a NES of ±1, whereas the black dotted line indicates a NES of 0. Data points are color-coded according to the same color scheme used for the respective gene-set entries in a. c. Correlation plots of GSVA-derived Z-scores for 3 of the top 50 hits found upon integration of the RNAseq/Proteomics/Co-Culture data sets (see Extended Figure 5a) versus the scores for the Hallmark EMT gene signature (on the x-axis). Data were obtained from RNAseq of scRNA-seq data for primary tumors of 13 TNBC patients. The color code indicates the Z-Score for a gene expression signature indicative of low PHGDH protein expression. Total least-squares regression lines and confidence intervals are overlaid on top of each plot, with the corresponding Pearson correlation coefficient (R) values shown on the top-left corners. d. Activity of extracellularly secreted MMP-3 (μU/min) in cell culture media collected from invasion assays of 4T1 cells upon Phgdh knockdown (shPHGDH) or control (shSCR) cells after 72h of seeding (n=3 independent experiments). The solid lines indicate the median, the boxes extend to the 25th and 75th percentiles, the whiskers span the minimum and maximum values. One-way ANOVA with Dunn’s multiple comparison. e. Invasive capacity of EMT6.5 cells pre-treated (24h) with an antibody against integrin αvβ3 or control IgG (2.5 μg/ml) and upon Phgdh knockdown (shPHGDH) compared to control (shSCR) cells in a 3D matrix. The invasive area was stained with calcein green. Each dot represents a different microscopy field (n=5). The solid lines indicate the median, the boxes extend to the 25th and 75th percentiles, the whiskers span the minimum and maximum values. Welch and Brown-Forsythe ANOVA with Dunnett’s multiple comparison.
Extended Data Figure 6.
Extended Data Figure 6.. Low PHGDH protein expression increases sialic acid metabolism and promotes glycosylation
a. Schematic representation of glycolysis and its branching metabolic pathways. Enzymes are depicted in bold, pathway names in italics. Solid lines represent single reactions, dashed lines recapitulate multiple reactions. b. Metabolite abundances of sialic acid, UDP-N-acetylglucosamine (UDP-GlcNAc) and CMP-sialic acid upon Phgdh knock-down in 4T1 cells (n=15). The solid lines indicate the median, the boxes extend to the 25th and 75th percentiles, the whiskers span the minimum and the maximum values. Unpaired t test with Welch’s correction, two-tailed. c. Dynamic 13C6 glucose labeling of MDA-MB-231 cells showing 13C incorporation into sialic acid, UDP-N-acetylglucosamine and CMP-sialic acid upon PHGDH overexpression (PHGDH OE) (n=3). Error bars represent s.d. from mean. Two-way ANOVA. d. Metabolite abundances of sialic acid, UDP-N-acetylglucosamine and CMP-sialic acid upon PHGDH overexpression (PHGDH OE) in MDA-MB-231 cells (n=15). The solid lines indicate the median, the boxes extend to the 25th and 75th percentiles, the whiskers span the smallest and the largest values. Unpaired t test with Welch’s correction, two-tailed. e. Sialic acid/GlcNAc-containing-proteins isolated from whole cell lysate of 4T1 cells upon Phgdh knock-down (shPHGDH) or control (shSCR) cells treated with tunicamycin (0.05 μg/ml) or DMSO for 72h. Total isolated Sialic acid/GlcNAc-linked proteins were quantifying using Qubit Protein Assay Kit (n=2 independent experiments). Error bars represent s.d. from mean. f. Levels of β-1,4-GlcNAc- and sialic acid-linked residues in 4T1 Phgdh knockdown (shPHGDH) and control (shSCR) cells after 72h of tunicamycin pretreatment (0.05 μg/ml) measured at 7, 24 and 48h after tunicamycin removal using wheat germ agglutinin (WGA) staining (n=3). Red, WGA β-1,4-GlcNAc- and sialic acid-linked proteins; blue, DAPI nuclear staining. Error bars represent standard deviation (s.d.) from mean. Unpaired t test with Welch’s correction, two-tailed. Scale bar 20 μm. g. Cell viability upon tunicamycin (0.05 μg/ml) and PHGDH inhibitor (PH755, 1 μM) treatment (36h) in 4T1 cells upon Phgdh knock-down (shPHGDH) or control (shSCR) (n=5). Error bars represent s.d. from mean. One-way ANOVA with Turkey’s multiple comparison test. h. Protein expression levels of glycosylated integrin β3 (elution) after WGA-mediated isolation of β-1,4-GlcNAc- and sialic acid-linked proteins from total lysates of 4T1 cells upon Phgdh knock-down (4T1 shPHGDH), Cmas knockout, and double Phgdh and Cmas gene inactivation, compared to control cells (4T1 shSCR). Total levels of integrin β3 from the whole cell lysate and actin as loading control are shown. Experiments were performed in triplicate, and one representative experiment is shown. i. β-1,4-GlcNAc- and sialic acid-linked proteins isolated from whole cell lysate of 4T1 cells upon Phgdh and Cmas knockdown (shPHGDH, shCMAS), Cmas knockout (KO) or control (shSCR) cells treated with tunicamycin (0.05 μg/ml) or DMSO for 72h (n=2independent experiments). Error bars represent s.d. from mean.
Extended Data Figure 7.
Extended Data Figure 7.. Low PHGDH protein expression promotes invasion and metastasis via protein sialylation
a. Invasive capacity of 4T1 cells upon Phgdh knockdown (shPHGDH) compared to control (shSCR) cells pretreated with tunicamycin (0.05 μg/ml) for 72h prior seeding in a 3D matrix. The invasive area was stained with calcein green. Each dot represents a different microscopy field (n=5). The solid lines indicate the median, the boxes extend to the 25th and 75th percentiles, the whiskers span the minimum and maximum values. Welch and Brown-Forsythe ANOVA with Dunnett’s multiple comparison. b-e. Invasive ability of 4T1 cells with functional (CTR or shSCR) or inactive (Cmas KO or shCMAS) sialic acid pathway upon Phgdh knockdown (shPHGDH) compared to control (shSCR) cells(b, d); EMT6.5 cells upon Phgdh knock-down (shPHGDH) compared to control (shSCR) cells after 48h of pretreatment with the sialytransferase inhibitor Lith-O-Asp (30 μM) (c); and 4T1 and EMT6.5 cells upon CMAS overexpression (CMAS OE) compared to control (CTR) cells (e) in a 3D matrix. The invasive area was stained with calcein green. Representative images are depicted in the left panel (scale bar 500 μm), quantification in the right panel. Each dot represents a different microscopy field (n=5). The solid lines indicate the median, the boxes extend to the 25th and 75th percentiles, the whiskers span the smallest and the largest values. Welch and Brown-Forsythe ANOVA with Dunnett’s multiple comparison. f. Number of lung metastases per mouse in the orthotopically injected (m.f.p.) mice with 4T1 cells with either functional (CTR, n=12) or inactive (Cmas KO, n=10) sialic acid pathway, with (shPHGDH, n=10) or without (shSCR, n=10) concomitant Phgdh knockdown. The solid lines indicate the median, the boxes extend to the 25th and 75th percentiles, the whiskers span the smallest and the largest values. Welch and Brown-Forsythe ANOVA with Dunnett’s multiple comparison.
Extended Data Figure 8.
Extended Data Figure 8.. Loss of PHGDH protein decreases PKF activity and increases carbon flux into the sialic acid pathway
a. Changes in metabolite abundance upon Phgdh knockdown in 4T1 and EMT6.5 cells. Data represent fold changes compared to non-silenced cells (shSCR) (n=3). H6P, hexose-6-phosphate; FBP, fructose bisphosphate; DHAP, dihydroxyacetone phosphate; GAP, glyceraldehyde 3-phosphate; xPG, 2/3-phosphoglycerate; PEP, phosphoenolpyruvate. Unpaired t test two-tailed. *indicates statistically significant as follows: FBP, p=0.0042 (4T1), p=0.0012 (EMT6.5); PEP, p=0.0031 (4T1), p=0.034 (EMT6.5); Pyruvate, p=2.88e−11 (4T1). b. Fractional contribution of 13C6-glucose to glycolytic intermediates in 4T1 upon Phgdh knockdown (shPHGDH) compared to control (shSCR) cells (n=3). Error bars represent s.d. from mean. Two-way ANOVA. c. Interaction of PHGDH with PFKP in 4T1 control (shSCR) and Phgdh knockdown (shPHGDH) cells assessed by co-immunoprecipitation of PHGDH. A representative experiment is shown (n=3 independent experiments). d. Protein expression levels of PHGDH, PSAT and PSPH in TNBC PDX model (BCM-3107-R2TG18) assessed by multiplex immunofluorescence. Green, PHGDH; Turquoise, PSAT; Pink, PSPH; red, pan-cytokeratin tumor marker; blue, DAPI nuclear staining. Scale bar 200 μm. e. Protein expression levels of PHGDH upon treatment with the PHGDH catalytic inhibitor PH-775 (1 μM) for 72h. One representative experiment is shown (n=3). f. Inhibition of de novo serine biosynthesis assessed through measurement of serine m+3 labeling after incubation of 4T1 cells for 24h in culture medium containing 13C6-glucose upon treatment with the PHGDH catalytic inhibitor PH-775 (1 μM) for 72h. Error bars represent s.d. from mean. Unpaired t test with Welch’s correction, two-tailed. g. Dynamic labeling using 13C6-glucose of 4T1 cells showing 13C incorporation into sialic acid upon treatment with the PHGDH catalytic inhibitor PH-775 (1 μM) for 72h (n=3). Error bars represent s.d. from mean. Two-way ANOVA. h. Metabolite abundance of sialic acid upon treatment with the PHGDH catalytic inhibitor PH-775 (1 μM) for 72h in 4T1 cells. The solid lines indicate the median, the boxes extend to the 25th and 75th percentiles, the whiskers span the smallest and the largest values (n=15). Unpaired t test with Welch’s correction, two-tailed. G6P, glucose-6-phosphate; F6P, fructose-6-phosphate; H6P, hexose-6-phosphate; FBP, fructose bisphosphate; DHAP, dihydroxyacetone phosphate; xPG, 2/3-phosphoglycerate; PEP, phosphoenolpyruvate.
Extended Data Figure 9.
Extended Data Figure 9.. Low PHGDH protein expression, but not low catalytic activity, promotes sialic acid synthesis and drives metastatic dissemination
a-b. Measurement of serine m+3 labeling enrichment after incubation of (a) MDA-MB-231 control (CTR), PHGDH (PHGDH OE) overexpressing and catalytic inactive PHGDH (PHGDH CI OE) overexpressed cells or (b) 4T1 cells upon Phgdh knockdown (shPHGDH), Phgdh-silencing with wildtype (shPHGDH + wt OE) and catalytic inactive overexpression (shPHGDH + CI OE) for 24h in culture medium containing 13C6-glucose (n=3). Error bars represent s.d. from mean. One-way ANOVA with Holm-Sidak’s multiple comparison test. c. Dynamic labeling using 13C6-glucose and total abundance of sialic acid in 4T1 cells upon Phgdh knockdown (shPHGDH), Phgdh-silenced cells with wildtype (shPHGDH + wt OE) and catalytic inactive overexpression (shPHGDH + CI OE) cells. Left panel, p values refer to comparison of shSCR or shPHGDH + CI OE vs shPHGDH (n=3). For sialic acid abundance, the solid lines indicate the median, the boxes extend to the 25th and 75th percentiles, the whiskers span the minimum and maximum values (n=6). One-way ANOVA with Holm-Sidak’s multiple comparison test. d. Levels of glycosylated integrin β3 (elution) after WGA-mediated isolation of β-1,4-GlcNAc- and sialic acid-linked proteins from total lysates of 4T1 control (shSCR), Phgdh knockdown (shPHGDH) cells, and Phgdh-silenced 4T1 cells with wildtype (shPHGDH +wt OE) and catalytic inactive (shPHGDH + CI OE) overexpression. The last two samples correspond to tunicamycin treated (48h, 0.05 μg/ml) 4T1 control (shSCR) and Phgdh knockdown (shPHGDH). Total levels of integrin β3 from the whole cell lysate and actin as housekeeper are shown. One representative experiment is shown (n=3). e. Invasive capacityof 4T1 cells upon treatment with the PHGDH catalytic inhibitor PH-775 (1 μM) for 72h and rescue with cell-permeable α-ketoglutarate (αKG, 1 mM) in a 3D matrix. The invasive area was stained with calcein green. Representative images are depicted in the left panel (scale bar 500 μm), quantification in the right panel. Each dot represents a different, randomly selected microscopy field. The solid lines indicate the median, the boxes extend to the 25th and 75th percentiles, the whiskers span the smallest and the largest values (n=5). One-way ANOVA with Tukey’s multiple comparison test. f-h. Invasive ability of 4T1 control (shSCR), Phgdh knockdown (shPHGDH) cells and Phgdh-silenced 4T1 cells with wildtype (shPHGDH +wt OE) and catalytic inactive overexpression (shPHGDH + CI OE) (f); MDA-MB-231 control (CTR), PHGDH wildtype overexpression (OE) and catalytic inactive overexpression (CI OE) cells (g); 4T1 control (SCR KO), Psat (PSAT KO) and Psph knockout cells (PSPH KO) (h) in 3D matrix. The invasive area was stained with calcein green. Representative images are depicted in the left panel (scale bar 500 μm), quantification in the right panel. Each dot represents a different microscopy field (n=5). The solid lines indicate the median, the boxes extend to the 25th and 75th percentiles, the whiskers span the minimum and maximum values. Welch and Brown-Forsythe ANOVA with Dunnett’s multiple comparison. i. Percentage of migratory cells per migratory position (n=11) in the primary tumor of the orthotopic (m.f.p.) 4T1 mouse model assessed by time-lapse intravital imaging. Mice were injected with a mixture of 4T1 shPHGDH-Dendra and 4T1 shPHGDH with overexpression of wildtype (shPHGDH + wt OE) (n=8) or catalytic inactive (shPHGDH + wt CI) PHGDH-mTurquoise (n=8). The solid lines indicate the median, the boxes extend to the 25th and 75th percentiles, the whiskers span the minimum and the maximum values. Unpaired t test with Welch’s correction, two-tailed.
Extended Data Figure 10.
Extended Data Figure 10.. Validation of genetic modification of breast cancer cells.
a. Protein expression levels of PHGDH and CMAS in 4T1 cells used in Figures 2e, 3a, 3b, 3c, 3d, and Extended Data Figures 3j, 3l, 4a, 4b, 4c, 4d, 4e, 4h, 5a, 5b, 5e, 6b, 6e, 6f, 6g, 6h, 6i, 7a, 7b, 7d, 7f, 8b, 8c and 9e. b. Protein expression levels of PHGDH and CMAS in 4T1 and EMT6.5 cells used in Extended Data Figure Figures 2j, 4c c. Protein expression levels of PHGDH in MDA-MB-231 and 4T1 cells used in Figures 4c, 4c and Extended Data Figures 4f, 4j,6c, 6d, 9a–f and 9i. d. Relative Phgdh expression in MDA-MB-231 and 4T1 cells detailed in c (n=3 independent samples). Error bars represent standard deviation (s.d.) from mean. e. Psat and Psph gene inactivation measured by a decrease in 13C6-Glucose incorporation into serine in 4T1 cells used in Extended Data Figure 9g (n=3 independent samples). Error bars represent standard deviation (s.d.) from mean. f. Relative Phgdh expression and invasion ability in 4T1 cells used in Figures 2a, 2b, 4c, and Extended Data Figures 3h, 3i and 9i (n=3independent samples). Error bars represent standard deviation (s.d.) from mean.
Figure 1.
Figure 1.. The presence of PHGDH low cancer cells in primary tumors indicates poor prognosis and PHGDH expression decreases in CTCs and early metastasis
a-b. Metastasis-free (a) and disease-free (b) survival (days) of patients with TNBC divided by homogeneous high and heterogeneous/low PHGDH expression in primary tumors. The solid lines indicate the median, the whiskers indicate the 95% confidence interval. n=129; homogeneous high expression, n=87; heterogeneous expression, n=29; low expression, n=13. Unpaired nonparametric Mann-Whitney test, two-tailed. c. PHGDH protein expression in circulating tumor cells (CTCs) compared to the respective primary tumors from orthotopic (m.f.p.) TNBC BCM-3107-R2TG18 PDX model, assessed by immunohistochemistry (6 mice, 30 randomly chosen microscopy fields for the primary tumors, 5 per mouse, 87 single CTCs). The solid lines indicate the median, the whiskers indicate the 95% confidence interval. Unpaired t test with Welch’s correction, two-tailed. d. PHGDH protein expression in lymph node metastases and matched primary breast tumors from TNBC patients (n=7), assessed by immunohistochemistry. The solid lines indicate the median, the boxes extend to the 25th and 75th percentiles, the whiskers span the minimum and maximum values. Unpaired t test with Welch’s correction, two-tailed. e. Representative pictures of PHGDH protein expression in early (16 weeks) and late (22 weeks) lung metastases from orthotopic (m.f.p.) TNBC PDX models, assessed by immunohistochemistry. Green, PHGDH; red, pan-cytokeratin tumor marker; blue, DAPI nuclear staining. Scale bar 200 μm. f. PHGDH protein expression in TNBC BCM-3107-R2TG18 PDX model in low or high vascularized primary tumor areas (defined by CD31 staining), assessed by immunohistochemistry. Green, Phgdh; red, pan-cytokeratin tumor marker; blue, DAPI nuclear staining. Scale bar 200 μm.
Figure 2:
Figure 2:. Low PHGDH expression promotes integrin αvβ3-mediated invasion and migration
a. Percentage of migratory cells per migratory position (n=14) in primary tumors derived from orthotopically injected (m.f.p.) 4T1 (mixture of shSCR mTurquoise and shPHGDH Dendra) cells assessed by time-lapse intravital imaging (n=8). Unpaired t test with Welch’s correction, two-tailed. b. Representative track length of migratory shSCR-mTurquoise (n=9 within one position) and shPHGDH-Dendra (n=10 within one position) cells in primary tumors from the orthotopic (m.f.p.) 4T1 mouse model, assessed by time-lapse intravital imaging. c. Number of lung metastases per mouse in the orthotopic (m.f.p.) 4T1 (left panel) and EMT6.5 (right panel) mouse model, injected with either shSCR (n=11 and n=18) or shPHGDH cells (n=10 and n=19). Unpaired t test with Welch’s correction, two-tailed. d. Correlation plot of GSVA-derived Z-scores for the Integrin-1 pathway, versus the scores for the Hallmark EMT gene signature, based on scRNA-seq data from primary tumors of 13 TNBC patients. Color code indicates the Z-Score for a gene expression signature indicative of low PHGDH protein expression. Total least-squares regression line and confidence intervals are overlaid on top, and Pearson correlation coefficient (R) values are shown on the top-left corners. e. Invasive ability of 4T1 cells pre-treated (24h) with an antibody against integrin αvβ3 or control IgG (2.5 μg/ml) and upon Phgdh knockdown (shPHGDH) compared to control (shSCR) cells in a 3D matrix. The invasive area was stained with calcein green. Each dot represents a different microscopy field (n=5). Welch and Brown-Forsythe ANOVA with Dunnett’s multiple comparison. For panels a, c, and e, the solid lines indicate the median, the boxes extend to the 25th and 75th percentiles, the whiskers span the minimum and maximum values.
Figure 3:
Figure 3:. Low PHGDH expression promotes sialic acid metabolism and consequently protein sialylation
a. Dynamic labeling of 4T1 cells with 13C6-glucose showing 13C incorporation into sialic acid, UDP-N-acetylglucosamine and CMP-sialic acid upon Phgdh knockdown. Two-way ANOVA. Error bars represent standard deviation (s.d.) from mean (n=3 independent samples). b. Protein levels of glycosylated integrin β3 (elution) after WGA-mediated isolation of β-1,4-GlcNAc- and sialic acid-linked proteins from total lysates of 4T1 cells upon Phgdh (4T1 shPHGDH), Cmas, and double Phgdh and Cmas knockdown compared to control cells (4T1 shSCR). Total levels of integrin β3 from the whole cell lysate and actin as loading control are shown. A representative experiment is shown (n=3 independent experiments). c. Invasive Capacity of 4T1 cells upon Phgdh knockdown (shPHGDH) compared to control (shSCR) cells after 48h of pretreatment with the sialytransferase inhibitor Lith-O-Asp (30 μM) in a 3D matrix. The invasive area was stained with calcein green. Representative images are depicted in the left panel (scale bar 500 μm), quantification in the right panel. Each dot represents a different microscopy field (n=5). The solid lines indicate the median, the boxes extend to the 25th and 75th percentiles, the whiskers span the minimum and the maximum values. Welch and Brown-Forsythe ANOVA with Dunnett’s multiple comparison. d. Number of lung metastases per mouse injected (m.f.p.) with either 4T1 cells with functional (shSCR, n=11) or inactive (Cmas knockdown, n=6) sialic acid pathway, upon Phgdh knockdown (shPHGDH, n=10). The solid lines indicate the median, the boxes extend to the 25th and 75th percentiles, the whiskers span the smallest and the largest values. Welch and Brown-Forsythe ANOVA with Dunnett’s multiple comparison.
Figure 4:
Figure 4:. PHGDH interacts with PFKP and loss of this interaction non-catalytically drives metastatic dissemination
a. PFKP localization in 4T1 control (shSCR) and Phgdh knockdown (shPHGDH) cells and Phgdh-silenced 4T1 cells with wildtype (shPHGDH +wt OE) or catalytic inactive overexpression (shPHGDH + CI OE) assessed by immunofluorescence. Green, PHGDH; red, PFKP; blue, DAPI nuclear staining. A representative experiment is shown (n=3 independent experiments). b. Interaction of PHGDH with PFKP in 4T1 mouse model assessed by co-immunoprecipitation of PHGDH. A representative experiment is shown (n=3 independent experiments). c. Tracks in representative migratory position for 4T1 shPHGDH-Dendra and shPHGDH with overexpression of PHGDH-wildtype-mTurquoise or PHGDH-catalytic inactive-mTurquoise measured by time-lapse intravital imaging. d. Number of lung metastases per mouse injected (m.f.p.) with either 4T1 control cells (n=12), Phgdh knockdown (shPHGDH, n=8), and Phgdh knockdown cells with wildtype (shPHGDH WT, n=11) or catalytic inactive Phgdh overexpression (CI OE, n=12). The solid lines indicate the median, the boxes extend to the 25th and 75th percentiles, the whiskers span the minimum and maximum values. Unpaired t test with Welch’s correction, two-tailed. e. Schematic representation of the mechanism by which PHGDH-low cells increase metastatic dissemination from the primary tumor.

Comment in

References

REFERENCES MAIN TEXT

    1. Gupta PB, Pastushenko I, Skibinski A, Blanpain C & Kuperwasser C Phenotypic Plasticity: Driver of Cancer Initiation, Progression, and Therapy Resistance. Cell stem cell 24, 65–78, doi:10.1016/j.stem.2018.11.011 (2019). - DOI - PMC - PubMed
    1. Vitale I, Shema E, Loi S & Galluzzi L Intratumoral heterogeneity in cancer progression and response to immunotherapy. Nature medicine 27, 212–224, doi:10.1038/s41591-021-01233-9 (2021). - DOI - PubMed
    1. Lüönd F, Tiede S & Christofori G Breast cancer as an example of tumour heterogeneity and tumour cell plasticity during malignant progression. British journal of cancer 125, 164–175, doi:10.1038/s41416-021-01328-7 (2021). - DOI - PMC - PubMed
    1. Bergers G & Fendt SM The metabolism of cancer cells during metastasis. Nature reviews. Cancer 21, 162–180, doi:10.1038/s41568-020-00320-2 (2021). - DOI - PMC - PubMed
    1. Prasetyanti PR & Medema JP Intra-tumor heterogeneity from a cancer stem cell perspective. Molecular Cancer 16, 41, doi:10.1186/s12943-017-0600-4 (2017). - DOI - PMC - PubMed

REFERENCES METHODS

    1. Teoh ST, Ogrodzinski MP, Ross C, Hunter KW & Lunt SY Sialic Acid Metabolism: A Key Player in Breast Cancer Metastasis Revealed by Metabolomics. Frontiers in Oncology 8, 174, doi:10.3389/fonc.2018.00174 (2018). - DOI - PMC - PubMed
    1. Vandekeere S et al. Serine Synthesis via PHGDH Is Essential for Heme Production in Endothelial Cells. Cell metabolism 28, 573–587.e513, doi:10.1016/j.cmet.2018.06.009 (2018). - DOI - PubMed
    1. Paulo JA & Gygi SP Nicotine-induced protein expression profiling reveals mutually altered proteins across four human cell lines. Proteomics 17, doi:10.1002/pmic.201600319 (2017). - DOI - PMC - PubMed
    1. Zhang X et al. A Renewable Tissue Resource of Phenotypically Stable, Biologically and Ethnically Diverse, Patient-Derived Human Breast Cancer Xenograft Models. Cancer research 73, 4885, doi:10.1158/0008-5472.CAN-12-4081 (2013). - DOI - PMC - PubMed
    1. Au - Lv X et al. Orthotopic Transplantation of Breast Tumors as Preclinical Models for Breast Cancer. JoVE, e61173, doi:doi:10.3791/61173 (2020). - DOI - PMC - PubMed