. 2022 Jun;44(3):1525-1550.
doi: 10.1007/s11357-022-00580-w. Epub 2022 May 19.

A retrotransposon storm marks clinical phenoconversion to late-onset Alzheimer's disease

Affiliations

A retrotransposon storm marks clinical phenoconversion to late-onset Alzheimer's disease

Fabio Macciardi et al. Geroscience. 2022 Jun.

Abstract

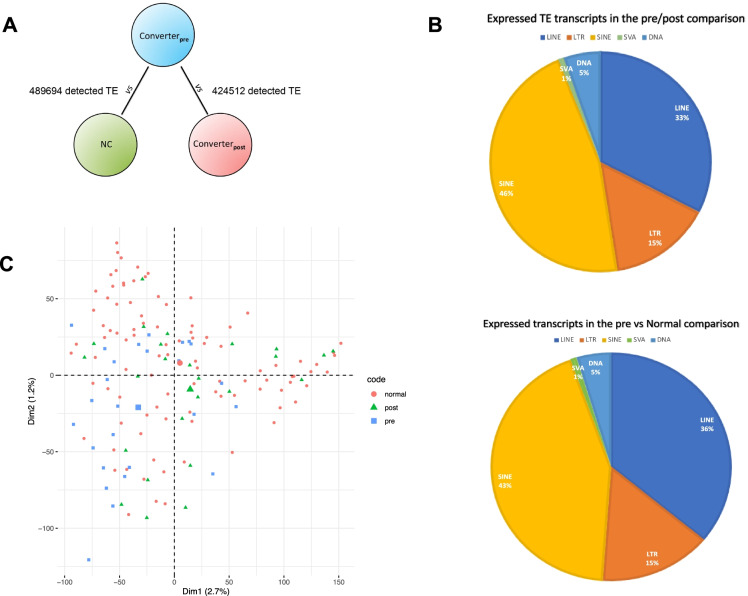
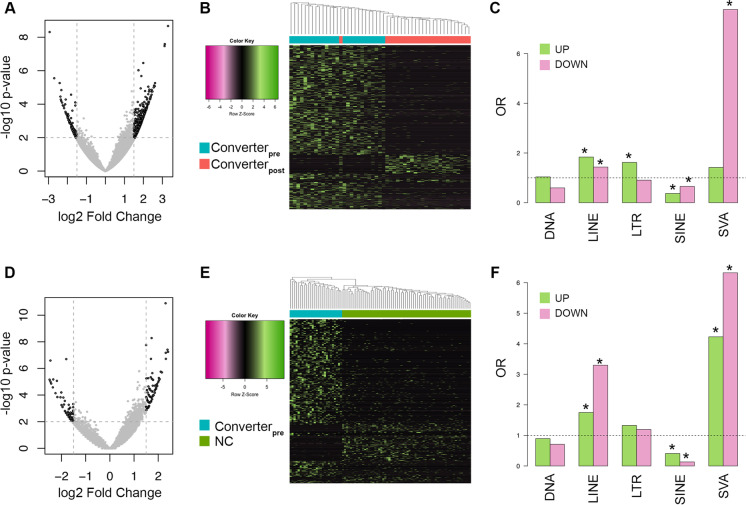
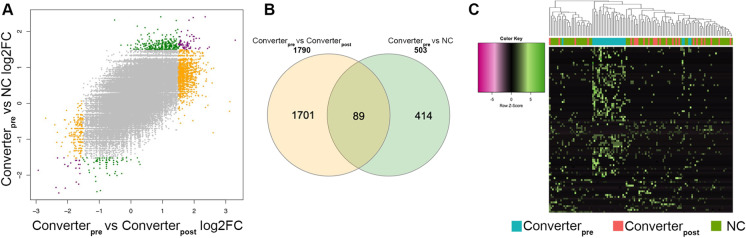
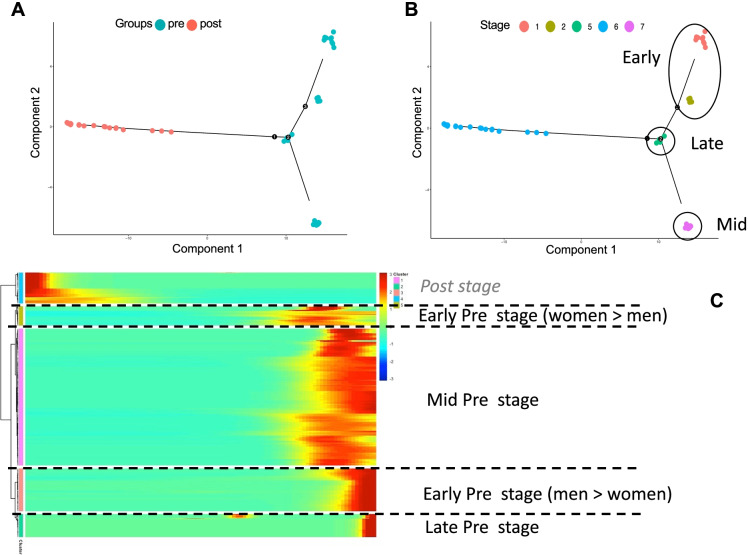
Recent reports have suggested that the reactivation of otherwise transcriptionally silent transposable elements (TEs) might induce brain degeneration, either by dysregulating the expression of genes and pathways implicated in cognitive decline and dementia or through the induction of immune-mediated neuroinflammation resulting in the elimination of neural and glial cells. In the work we present here, we test the hypothesis that differentially expressed TEs in blood could be used as biomarkers of cognitive decline and development of AD. To this aim, we used a sample of aging subjects (age > 70) that developed late-onset Alzheimer's disease (LOAD) over a relatively short period of time (12-48 months), for which blood was available before and after their phenoconversion, and a group of cognitive stable subjects as controls. We applied our developed and validated customized pipeline that allows the identification, characterization, and quantification of the differentially expressed (DE) TEs before and after the onset of manifest LOAD, through analyses of RNA-Seq data. We compared the level of DE TEs within more than 600,000 TE-mapping RNA transcripts from 25 individuals, whose specimens we obtained before and after their phenotypic conversion (phenoconversion) to LOAD, and discovered that 1790 TE transcripts showed significant expression differences between these two timepoints (logFC ± 1.5, logCMP > 5.3, nominal p value < 0.01). These DE transcripts mapped both over- and under-expressed TE elements. Occurring before the clinical phenoconversion, this TE storm features significant increases in DE transcripts of LINEs, LTRs, and SVAs, while those for SINEs are significantly depleted. These dysregulations end with signs of manifest LOAD. This set of highly DE transcripts generates a TE transcriptional profile that accurately discriminates the before and after phenoconversion states of these subjects. Our findings suggest that a storm of DE TEs occurs before phenoconversion from normal cognition to manifest LOAD in risk individuals compared to controls, and may provide useful blood-based biomarkers for heralding such a clinical transition, also suggesting that TEs can indeed participate in the complex process of neurodegeneration.

Keywords: Alzheimer disease; Blood biomarkers; Gene expression; Machine learning; Retrotransposons; Transposable elements.


Conflict of interest statement

The authors declare no competing interests.

Figures

Fig. 1
Fig. 1
A A graphical representation of the comparisons with the QC numbers of observed TE-mapping transcripts in the Converterpre vs. Converterpost and Converterpre vs NC samples. B The relative proportion of expressed TEs by classes in the 2 comparisons. C The first 2 dimensions of PCA for normal, pre, and post subjects that do not present any preferential subclustering (see also text for more details)
Fig. 2
Fig. 2
Differential analysis of TE expression. A Volcano plot of the results from the differential expression analysis of TE transcripts in the Converterpre vs Converterpost comparison. Significant RNA transcripts at logFC ± 1.5 and p value ≤ .01 are highlighted in black. B Scaled heatmap and unsupervised hierarchical clustering of the log2 TMM values of the 1790 TEs identified as differentially expressed in the Converterpre vs Converterpost comparison. Samples are annotated with different colors according to the group (Converterpre or Converterpost). C Enrichment analysis for up- and down-regulated differentially expressed TE transcripts according to their class. Stars mark significantly enriched TE classes (Fisher’s exact test p value ≤ .01). D, E, F The panels reports the same plots described above, but for the Converterpre vs NC comparison
Fig. 3
Fig. 3
Relationship between Converterpre vs Converterpost and Converterpre vs NC comparisons. A Correlation between the log2 fold changes (log2FC) of the expressed TE from the Converterpre vs Converterpost and Converterpre vs NC comparisons. TEs significant in the Converterpre vs Converterpost comparison are highlighted in yellow, and TEs significant in the Converterpre vs NC comparison are highlighted in green, while the 89 TEs significant in both the comparisons are highlighted in purple. B Venn diagram showing the intersection between DE TEs significant in Converterpre vs Converterpost and Converterpre vs NC comparisons. C Scaled heatmap and unsupervised hierarchical clustering of the log2 TMM values of the 89 TEs common to Converterpre vs Converterpost and Converterpre vs NC comparisons. Samples are annotated with different colors according to the group (NC, Converterpre, or Converterpost)
Fig. 4
Fig. 4
A and B show the pseudotime continuum from a Converterpre (dots on the right side) to a Converterpost (dots on the left side) for the subjects that developed AD during the period of observation. Dots represent subjects: in A, blue dots are subjects at their Converterpre condition and red dots are those at their Converterpost condition. In B, blue dots show the Converterpost condition for subjects; the other colors show different Converterpre stages. C A heatmap expression matrix for significant DE TEs at the 3 (early, mid, and late) Converterpre stages in addition to the Converterpost phase
Fig. 5
Fig. 5
Chromatin states of DE TE. A, B Distribution of up- and down-regulated DE TE across the chromatin states included in the Core 15-state model in blood cells, considering Converterpre vs Converterpost (A) and Converterpre vs NC (B) comparisons. C, D Heatmaps with unsupervised clustering of the chromatin states in blood cells, and adult and fetal brain tissue considering the genomic regions overlapping with DE TEs from Converterpre vs Converterpost (C) and Converterpre vs NC (D) comparisons. In all the plots, colors of the chromatin states are shown in the legend and correspond to those used in the Epigenomic Roadmap website; DE TEs whose genomic location encompasses multiple chromatin states are colored in blue
Fig. 6
Fig. 6
The upper left and right panels show a PCA representation of the accuracy of classification for Converterpre and Converterpost subjects, using the 8 selected TEs from Table 1 (left) or the overall 1790 significant TEs (right). The lower panel shows the ROC curves obtained using only the 8 selected TEs from the ML algorithm for Converterpre and Converterpost subjects with a correct classification of 78% (left) and the 8 selected TEs for Converterpre and NC subjects with a correct classification of 69%

References

    1. Ibanez L, Cruchaga C, Fernandez MV. Advances in genetic and molecular understanding of Alzheimer’s disease. Genes 2021, 12, 1247. 10.3390/genes12081247 - PMC - PubMed
    1. Frost B, Hemberg M, Lewis J, Feany MB. Tau promotes neurodegeneration through global chromatin relaxation. Nat Neurosci. 2014;17(3):357–366. - PMC - PubMed
    1. Colombo AR, Elias HK, Ramsingh G. Senescence induction universally activates transposable element expression. Cell Cycle. 2018;17(14):1846–1857. - PMC - PubMed
    1. Liu EY, Russ J, Cali CP, Phan JM, Amlie-Wolf A, Lee EB. Loss of nuclear TDP-43 is associated with decondensation of LINE retrotransposons. Cell reports. 2019;27(5):1409–21.e6. - PMC - PubMed
    1. Jonsson ME, Garza R, Johansson PA, Jakobsson J. Transposable elements: a common feature of neurodevelopmental and neurodegenerative disorders. Trends Genet: TIG. 2020;36(8):610–623. - PubMed

Publication types