. 2022 May;605(7910):483-489.
doi: 10.1038/s41586-022-04605-4. Epub 2022 May 18.

Synergistic HNO3-H2SO4-NH3 upper tropospheric particle formation

Mingyi Wang  1   2   3 Mao Xiao  4 Barbara Bertozzi  5 Guillaume Marie  6 Birte Rörup  7 Benjamin Schulze  3 Roman Bardakov  8   9 Xu-Cheng He  7 Jiali Shen  7 Wiebke Scholz  10 Ruby Marten  4 Lubna Dada  4   7 Rima Baalbaki  7 Brandon Lopez  1   11 Houssni Lamkaddam  4 Hanna E Manninen  12 António Amorim  13 Farnoush Ataei  14 Pia Bogert  5 Zoé Brasseur  7 Lucía Caudillo  6 Louis-Philippe De Menezes  12 Jonathan Duplissy  7   15 Annica M L Ekman  8   9 Henning Finkenzeller  16 Loïc Gonzalez Carracedo  17 Manuel Granzin  6 Roberto Guida  12 Martin Heinritzi  6 Victoria Hofbauer  1   2 Kristina Höhler  5 Kimmo Korhonen  18 Jordan E Krechmer  19 Andreas Kürten  6 Katrianne Lehtipalo  7   20 Naser G A Mahfouz  1   21 Vladimir Makhmutov  22   23 Dario Massabò  24 Serge Mathot  12 Roy L Mauldin  1   2   25 Bernhard Mentler  10 Tatjana Müller  6   26 Antti Onnela  12 Tuukka Petäjä  7 Maxim Philippov  22 Ana A Piedehierro  20 Andrea Pozzer  26 Ananth Ranjithkumar  27 Meredith Schervish  1   2 Siegfried Schobesberger  18 Mario Simon  6 Yuri Stozhkov  22 António Tomé  28 Nsikanabasi Silas Umo  5 Franziska Vogel  5 Robert Wagner  5 Dongyu S Wang  4 Stefan K Weber  12 André Welti  20 Yusheng Wu  7 Marcel Zauner-Wieczorek  6 Mikko Sipilä  7 Paul M Winkler  17 Armin Hansel  10   29 Urs Baltensperger  4 Markku Kulmala  7   15   30   31 Richard C Flagan  3 Joachim Curtius  6 Ilona Riipinen  9   32 Hamish Gordon  1   11 Jos Lelieveld  26   33 Imad El-Haddad  4 Rainer Volkamer  16 Douglas R Worsnop  7   19 Theodoros Christoudias  33 Jasper Kirkby  6   12 Ottmar Möhler  5 Neil M Donahue  34   35   36   37
Affiliations

Synergistic HNO3-H2SO4-NH3 upper tropospheric particle formation

Mingyi Wang et al. Nature. 2022 May.

Abstract

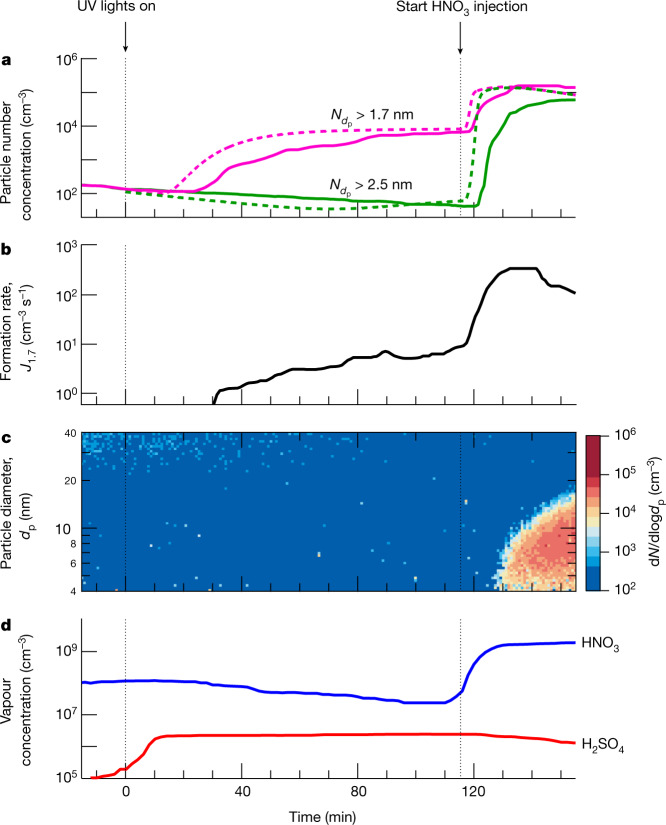
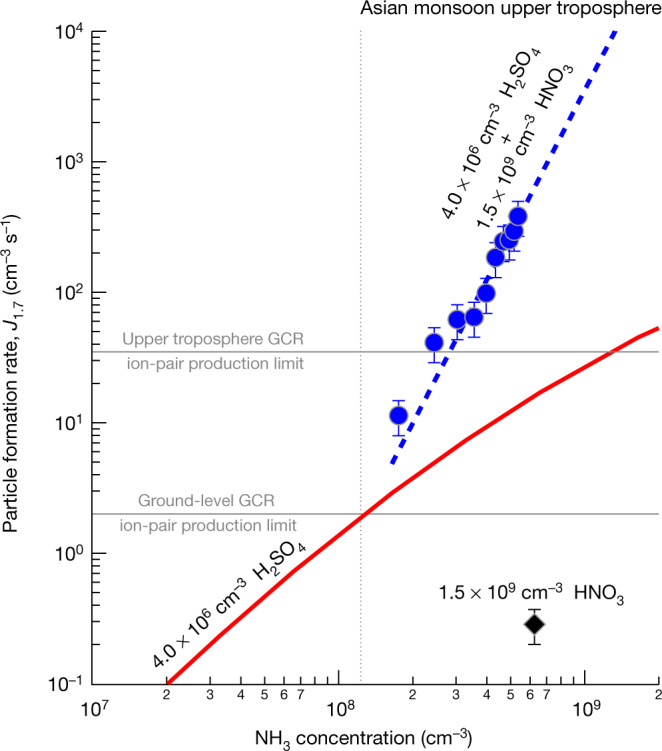
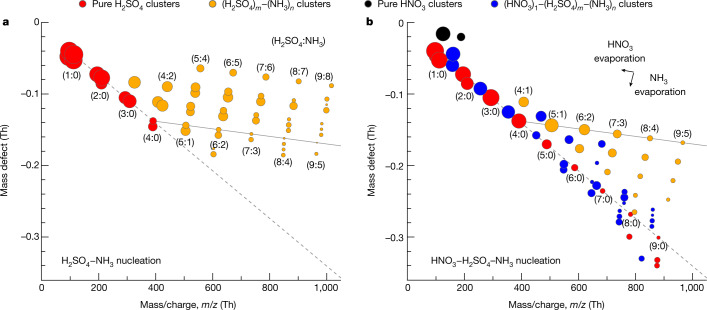
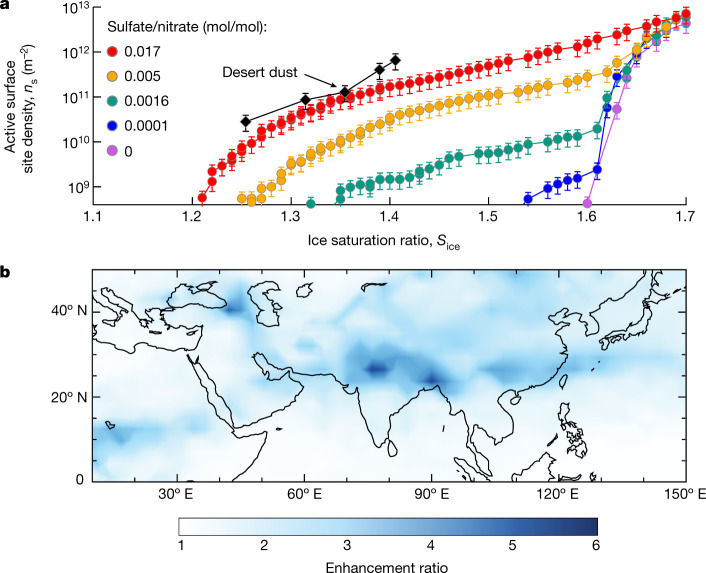
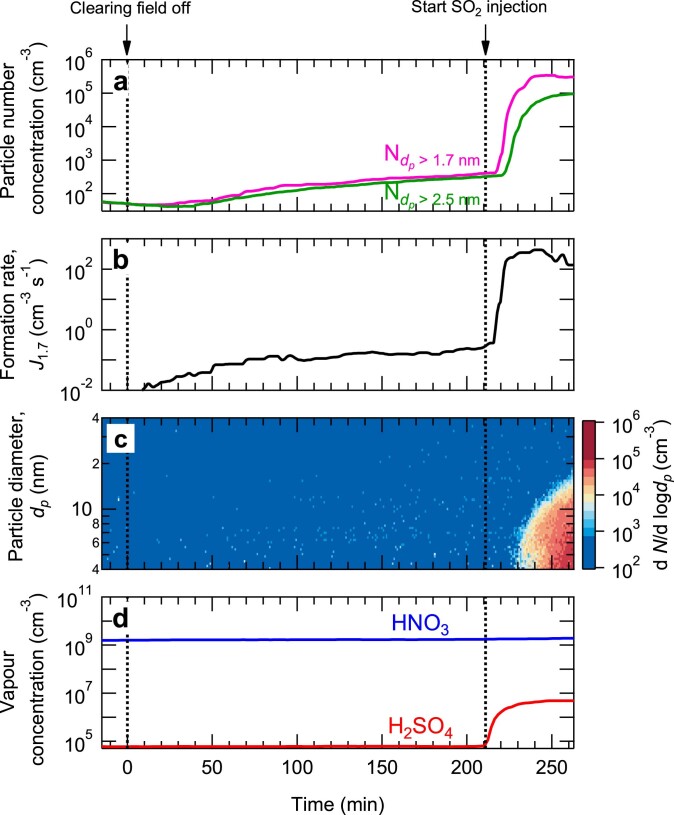
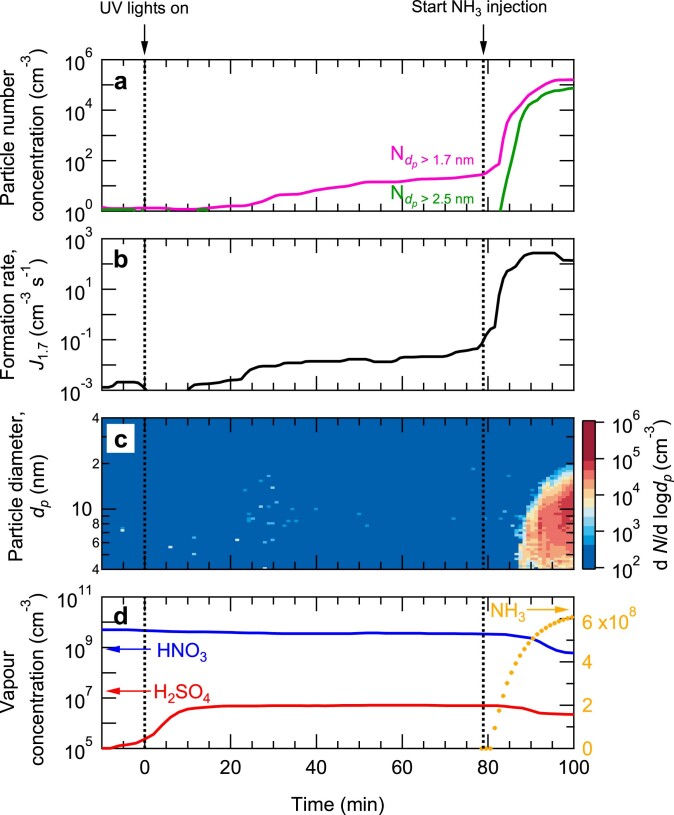
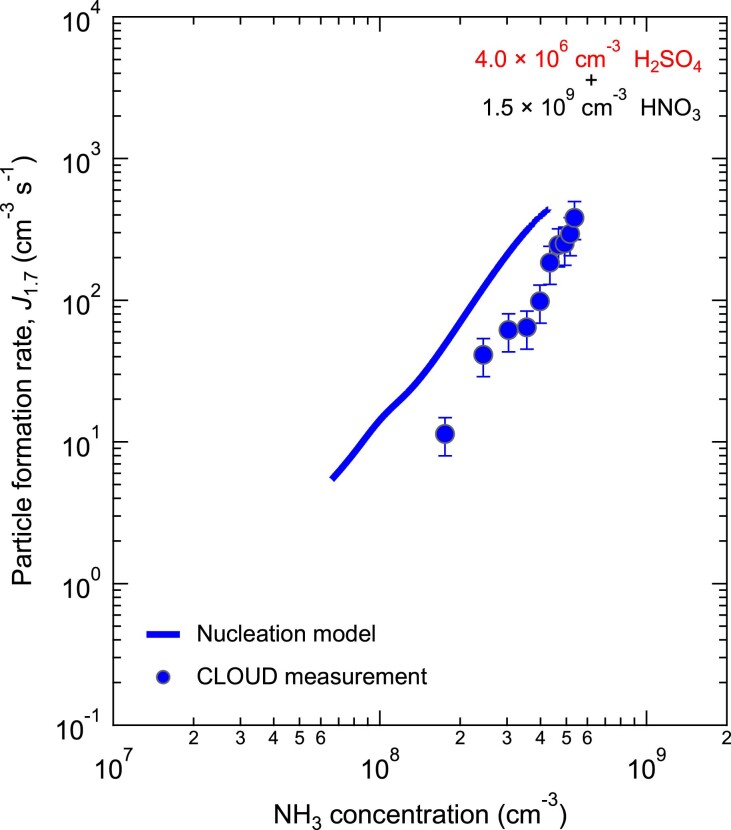
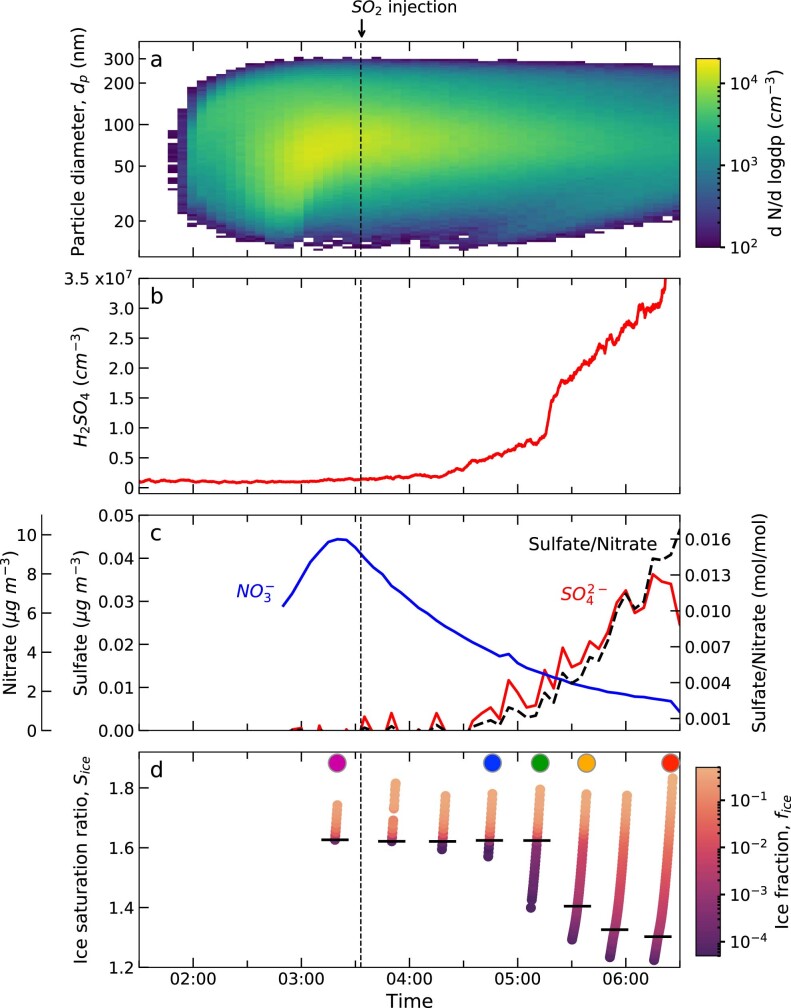
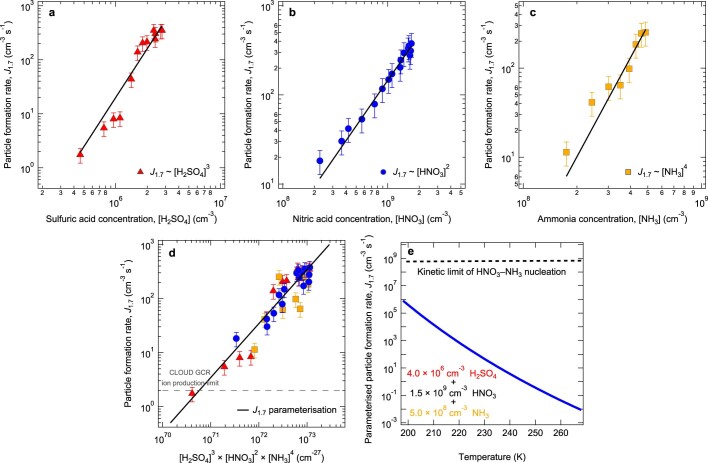
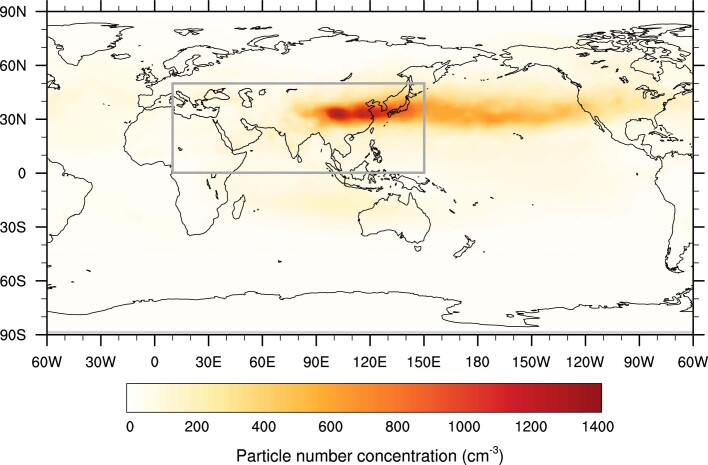
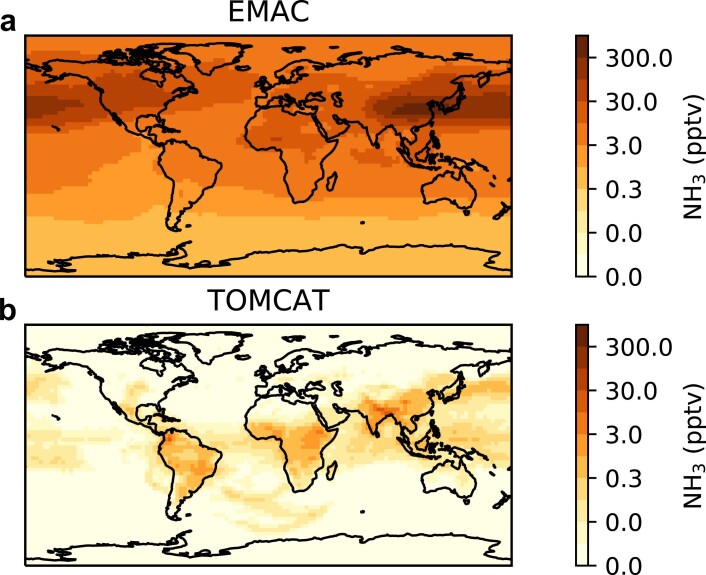
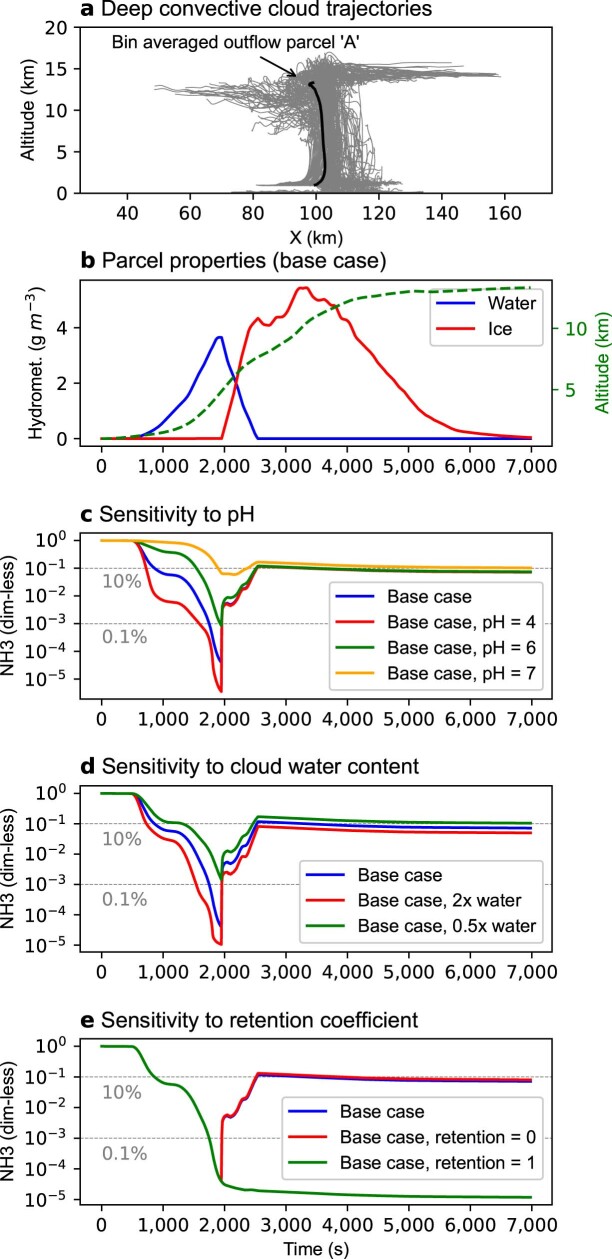
New particle formation in the upper free troposphere is a major global source of cloud condensation nuclei (CCN)1-4. However, the precursor vapours that drive the process are not well understood. With experiments performed under upper tropospheric conditions in the CERN CLOUD chamber, we show that nitric acid, sulfuric acid and ammonia form particles synergistically, at rates that are orders of magnitude faster than those from any two of the three components. The importance of this mechanism depends on the availability of ammonia, which was previously thought to be efficiently scavenged by cloud droplets during convection. However, surprisingly high concentrations of ammonia and ammonium nitrate have recently been observed in the upper troposphere over the Asian monsoon region5,6. Once particles have formed, co-condensation of ammonia and abundant nitric acid alone is sufficient to drive rapid growth to CCN sizes with only trace sulfate. Moreover, our measurements show that these CCN are also highly efficient ice nucleating particles-comparable to desert dust. Our model simulations confirm that ammonia is efficiently convected aloft during the Asian monsoon, driving rapid, multi-acid HNO3-H2SO4-NH3 nucleation in the upper troposphere and producing ice nucleating particles that spread across the mid-latitude Northern Hemisphere.


Conflict of interest statement

The authors declare no competing interests.

Figures

Fig. 1
Fig. 1. Example experiment showing nitric acid enhancement of H2SO4–NH3 particle formation.
a, Particle number concentrations versus time at mobility diameters >1.7 nm (magenta) and >2.5 nm (green). The solid magenta trace is measured by a PSM1.7 and the solid green trace is measured by a CPC2.5. The fixed experimental conditions are about 6.5 × 108 cm−3 NH3, 223 K and 25% relative humidity. A microphysical model reproduces the main features of the observed particle formation (dashed lines; see text for details). b, Particle formation rate versus time at 1.7 nm (J1.7), measured by a PSM. c, Particle size distribution versus time, measured by an SMPS. d, Gas-phase nitric acid and sulfuric acid versus time, measured by an I CIMS and a NO3 CIMS, respectively. Sulfuric acid through SO2 oxidation started to appear soon after switching on the UV lights at time = 0 min, building up to a steady state of 2.3 × 106 cm−3 after a wall-loss-rate timescale of around 10 min. The subsequent H2SO4–NH3 nucleation led to a relatively slow formation rate of 1.7-nm particles. The particles did not grow above 2.5 nm because of their slow growth rate and corresponding low survival probability against wall loss. Following injection of 2.0 × 109 cm−3 nitric acid into the chamber after 115 min, while leaving the production rate of sulfuric acid and the injection rate of ammonia unchanged, we observed a sharp increase in particle formation rate (panel b), together with rapid particle growth of 40 nm h−1 (panel c). The overall systematic scale uncertainties of ±30% on particle formation rate, −33%/+50% on sulfuric acid concentration and ±25% on nitric acid concentration are not shown. Source data
Fig. 2
Fig. 2. Particle formation rates at 1.7 nm (J1.7) versus ammonia concentration at 223 K and 25% relative humidity.
The chemical systems are HNO3–NH3 (black), H2SO4–NH3 (red) and HNO3–H2SO4–NH3 (blue). The black diamond shows the CLOUD measurement of HNO3–NH3 nucleation at 1.5 × 109 cm−3 HNO3, 6.5 × 108 cm−3 NH3 and with H2SO4 below the detection limit of 5 × 104 cm−3. The red solid curve is J1.7 versus ammonia concentration at 4.0 × 106 cm−3 sulfuric acid from a H2SO4–NH3 nucleation parameterization on the basis of previous CLOUD measurements,. The blue circles show the CLOUD measurements of HNO3–H2SO4–NH3 nucleation at 4.0 × 106 cm−3 H2SO4, 1.5 × 109 cm−3 HNO3 and (1.6–6.5) × 108 cm−3 NH3. The data are fitted by a power law, J1.7 = k[NH3]3.7 (blue dashed curve). The vertical grey dotted line separates ammonia concentrations measured in different regions in the upper troposphere; the region to the right indicates the Asian monsoon conditions. The horizontal grey solid lines show J1.7 upper limits for ion-induced nucleation resulting from the GCR ionization rate of around 2 ion pairs cm−3 s−1 at ground level and 35 ion pairs cm−3 s−1 in the upper troposphere. Among the three nucleation mechanisms, H2SO4–NH3 nucleation dominates in regions with low ammonia (below around 1.0 × 108 cm−3, or 12 pptv), whereas HNO3–H2SO4–NH3 nucleation dominates at higher ammonia levels characteristic of the Asian monsoon upper troposphere. The bars indicate 30% estimated total error on the particle formation rates. The overall systematic scale uncertainties are −33%/+50% for sulfuric acid and ±25% for nitric acid concentrations. Source data
Fig. 3
Fig. 3. Molecular composition of negatively charged clusters during H2SO4–NH3 and HNO3–H2SO4–NH3 nucleation events at 223 K and 25% relative humidity.
Mass defect (difference from integer mass) versus mass/charge (m/z) of negatively charged clusters measured with an APi-TOF mass spectrometer for 1.7 × 106 cm−3 sulfuric acid and 6.5 × 108 cm−3 ammonia (a) and 2.0 × 107 cm−3 sulfuric acid, 3.2 × 109 cm−3 nitric acid and 7.9 × 109 cm−3 ammonia (b). The symbol colours indicate the molecular composition as shown. The symbol area is proportional to the logarithm of signal rate (counts per second). The labels (m:n) near the symbols indicate the number of sulfuric acid (H2SO4)m and ammonia (NH3)n molecules in the clusters, including both neutral and charged species. The grey dashed lines follow clusters that contain pure H2SO4 molecules with an HSO4 ion (or SO4 instead of H2SO4 and/or SO4 instead of HSO4 for pure H2SO4 clusters falling below this line in b). The grey solid lines follow the 1:1 H2SO4–NH3 addition starting at (H2SO4)4–(NH3)0. Nearly all clusters in panel a lie above this line, whereas nearly all clusters in panel b fall below it. Most clusters containing HNO3 lack NH3 by the time they are measured (they fall near the (m:0) grey dashed line), but the marked difference between a and b indicates that the nucleating clusters had distinctly different compositions, probably including relatively weakly bound HNO3–NH3 pairs in b. It is probable that nucleating clusters in the CLOUD chamber at 223 K contain HNO3–H2SO4–NH3 with a roughly 1:1 acid–base ratio. However, during the transmission from the chamber to the warm APi-TOF mass spectrometer at 293 K, the clusters lose HNO3 and NH3, leaving a less volatile core of H2SO4 with depleted NH3. The evaporation of a single NH3 or HNO3 molecule from a cluster displaces it on the mass defect plot by a vector distance indicated by the black arrows in b. Source data
Fig. 4
Fig. 4. Ice nucleation properties and modelled regional contribution of upper tropospheric particles formed from HNO3–H2SO4–NH3 nucleation.
a, Active surface site density versus ice saturation ratio, measured by the mINKA instrument at CLOUD, at 233 K and 25% relative humidity. Pure ammonium nitrate particles (purple points) show homogeneous freezing. However, addition of only small amounts of sulfate creates highly ice-nucleation-active particles. At around 1.7% sulfate fraction (red points), the ice nucleating efficiency is comparable with desert dust particles. b, Simulation of particle formation in a global model (EMAC) with efficient vertical transport of ammonia into the upper troposphere during the Asian monsoon. Including multi-acid HNO3–H2SO4–NH3 nucleation (on the basis of the blue dashed curve in Fig. 2) enhances particle number concentrations (nucleation mode) over the Asian monsoon region by a factor of 3–5 compared with the same model with only H2SO4–NH3 nucleation (from Dunne et al., similar to the red solid curve in Fig. 2). Source data
Extended Data Fig. 1
Extended Data Fig. 1. Enhancement of HNO3–NH3 particle formation by sulfuric acid.
a, Particle number concentrations versus time at mobility diameters >1.7 nm (magenta) and >2.5 nm (green). The solid magenta trace is measured by a PSM1.7 and the solid green trace is measured by a CPC2.5. The fixed experimental conditions are about 6.5 × 108 cm−3 NH3, 223 K and 25% relative humidity. b, Particle formation rate versus time at 1.7 nm (J1.7), measured by a PSM. c, Particle size distribution versus time, measured by an SMPS. d, Gas-phase nitric acid and sulfuric acid versus time, measured by an I CIMS and a NO3 CIMS, respectively. We started the experiment by oxidizing NO2 to produce 1.6 × 109 cm−3 HNO3 in the presence of about 6.5 × 108 cm−3 ammonia. At time = 0 min, we turned off the high-voltage clearing field to allow the ion concentration to build up to a steady state between GCR production and wall deposition. The presence of ions (GCR condition) induces slow HNO3–NH3 nucleation, followed by relatively fast particle growth by nitric acid and ammonia condensation. We thus observe formation of both 1.7-nm and 2.5-nm particles by about one order of magnitude in about 3.5 h, with a slower approach to steady state because of the longer wall deposition time constant for the larger particles. Then, we increased H2SO4 in the chamber from 0 to 4.9 × 106 cm−3 by oxidizing progressively more injected SO2 after 211 min, with a fixed production rate of nitric acid and injection rate of ammonia. Subsequently, particle concentrations increase by three orders of magnitude within 30 min. The overall systematic scale uncertainties of ±30% on particle formation rate, −33%/+50% on sulfuric acid concentration and ±25% on nitric acid concentration are not shown. Source data
Extended Data Fig. 2
Extended Data Fig. 2. Enhancement of H2SO4–HNO3 nucleation by ammonia.
a, Particle number concentrations versus time at mobility diameters >1.7 nm (magenta) and >2.5 nm (green). The solid magenta trace is measured by a PSM1.7 and the solid green trace is measured by a CPC2.5. The fixed experimental conditions are 223 K and 25% relative humidity. b, Particle formation rate versus time at 1.7 nm (J1.7), measured by a PSM. c, Particle size distribution versus time, measured by an SMPS. d, Gas-phase nitric acid and sulfuric acid versus time, measured by an I CIMS and a NO3 CIMS, respectively; gas-phase ammonia versus time, calculated with a first-order wall-loss rate. Before the experiment, we cleaned the chamber by rinsing the walls with ultra-pure water, followed by heating to 373 K and flushing at a high rate with humidified synthetic air for 48 h. We started with an almost perfectly clean chamber and only HNO3, SO2 and O3 vapours present at constant levels. Sulfuric acid starts to appear by means of SO2 oxidation soon after switching on the UV lights at time = 0 min, building up to a steady state of 5.0 × 106 cm−3 with the wall-loss timescale of about 10 min. Subsequently, we observe slow formation of 1.7-nm particles, yet they do not reach 2.5 nm during the course of a 2-h period with small growth rates and low survival probability. Then, owing to the injection of ammonia from 0 to around 6.5 × 108 cm−3 into the chamber after 80 min, a sharp increase in the rate of particle formation is observed with a fixed production rate of sulfuric acid and injection rate of nitric acid. The sulfuric acid concentration decreases slightly afterwards, owing to accumulated condensation sink from fast particle growth. The overall systematic scale uncertainties of ±30% on particle formation rate, −33%/50% on sulfuric acid concentration and ±25% on nitric acid concentration are not shown. Source data
Extended Data Fig. 3
Extended Data Fig. 3. Particle formation rates at 1.7 nm (J1.7) versus ammonia concentration at 223 K and 25% relative humidity.
Circles are the CLOUD measurements (the same as those in Fig. 2). The curve represents the model simulations on the basis of known thermodynamics and microphysics, including Kelvin effects, for nucleating clusters. Source data
Extended Data Fig. 4
Extended Data Fig. 4. Measurement of the ice nucleation ability of HNO3–H2SO4–NH3 particles versus sulfate-to-nitrate ratio.
a, Particle size distribution versus time during the experiment, measured by an SMPS. b, Gas-phase sulfuric acid versus time, measured by a nitrate CIMS. c, Particle-phase chemical composition versus time, measured by an AMS. d, Fraction of INP at the nominal temperature of 215 K. The horizontal black dashes indicate the ice fraction threshold, fice = 10−3. The coloured circles correspond to the sulfate-to-nitrate ratios shown in Fig. 4a. Source data
Extended Data Fig. 5
Extended Data Fig. 5. Parameterization of the HNO3–H2SO4–NH3 particle formation rate.
ac Particle formation rate (J1.7) as a function of H2SO4, HNO3 and NH3 vapour concentrations, respectively, at 223 K and 25% relative humidity. The red triangles, blue circles and yellow squares represent experiments while varying only the concentration of H2SO4 (Extended Data Fig. 1), HNO3 (Fig. 1) and NH3 (Extended Data Fig. 2), respectively. The H2SO4 concentration was varied between 4.6 × 105 and 2.9 × 106 cm−3, HNO3 between 2.3 × 108 and 1.7 × 109 cm−3 and NH3 between 1.8 × 108 and 5.1 × 108 cm−3. d, The multi-acid–ammonia parameterization (black line) on the basis of equation (6) with k = 3.4 × 10−71 s−1 cm24. The grey dashed horizontal line shows a maximum of about 2 cm−3 s−1 ion-induced nucleation in the CLOUD chamber under GCR conditions, limited by the ion-pair production rate from GCR plus beam-background muons. The bars indicate 30% estimated total error on the particle formation rates, although the overall systematic scale uncertainties of −33%/+50% on sulfuric acid concentration and ±25% on nitric acid concentration are not shown. e, Temperature dependence of J1.7 for HNO3–H2SO4–NH3 nucleation (blue curve) on the basis of equation (9) with k = 2.9 × 10−98 e14,000/T s−1 cm24. Source data
Extended Data Fig. 6
Extended Data Fig. 6. Modelled contribution of HNO3–H2SO4–NH3 nucleation to upper tropospheric particles.
Number concentrations of multi-acid new particles (nucleation mode) at 250-hPa altitude simulated in a global model (EMAC) with efficient vertical transport of ammonia. The particle formation rate is on the basis of the blue dashed curve in Fig. 2 and parameterization shown in Extended Data Fig. 5. The extra particle number concentrations are shown, that is, relative to the same model without multi-acid nucleation. High annually averaged particle numbers are expected in the monsoon region (grey rectangle) and adjacent regions.
Extended Data Fig. 7
Extended Data Fig. 7. Modelled annual mean ammonia mixing ratios at 250 hPa (11 km, about 223 K).
a, The EMAC global model simulations are higher than the MIPAS satellite observations, although consistent with aircraft measurements,. b, The TOMCAT global model predicts much less ammonia (<1 pptv) in the upper troposphere.
Extended Data Fig. 8
Extended Data Fig. 8. Modelled transport of ammonia to the upper troposphere in deep convective clouds.
a, Trajectories of the simulated convective cloud event (grey) and a selected parcel representing a buoyant parcel reaching the upper troposphere (black). b, The simulated evolution of parcel A altitude (green dashed trace) and the total mass concentration and phase of the cloud hydrometeors (red and blue curves). ce Sensitivity of the predicted ammonia concentrations within parcel A to cloud water pH, total water amount and retention coefficient (by ice particles) as compared with the base-case simulation (blue trace in all figures). Source data

References

    1. Clarke A, et al. Nucleation in the equatorial free troposphere: favorable environments during PEM-Tropics. J. Geophys. Res. Atmos. 1999;104:5735–5744. doi: 10.1029/98JD02303. - DOI
    1. Weigel R, et al. In situ observations of new particle formation in the tropical upper troposphere: the role of clouds and the nucleation mechanism. Atmos. Chem. Phys. 2011;11:9983–10010. doi: 10.5194/acp-11-9983-2011. - DOI
    1. Gordon H, et al. Causes and importance of new particle formation in the present-day and pre-industrial atmospheres. J. Geophys. Res. Atmos. 2017;122:8739–8760. doi: 10.1002/2017JD026844. - DOI
    1. Williamson CJ, et al. A large source of cloud condensation nuclei from new particle formation in the tropics. Nature. 2019;574:399–403. doi: 10.1038/s41586-019-1638-9. - DOI - PubMed
    1. Höpfner M, et al. First detection of ammonia (NH3) in the Asian summer monsoon upper troposphere. Atmos. Chem. Phys. 2016;16:14357–14369. doi: 10.5194/acp-16-14357-2016. - DOI

Publication types