. 2022 May 18;23(1):188.
doi: 10.1186/s12859-022-04693-z.

Evaluation of statistical approaches for association testing in noisy drug screening data

Affiliations

Evaluation of statistical approaches for association testing in noisy drug screening data

Petr Smirnov et al. BMC Bioinformatics. .

Abstract

Background: Identifying associations among biological variables is a major challenge in modern quantitative biological research, particularly given the systemic and statistical noise endemic to biological systems. Drug sensitivity data has proven to be a particularly challenging field for identifying associations to inform patient treatment.

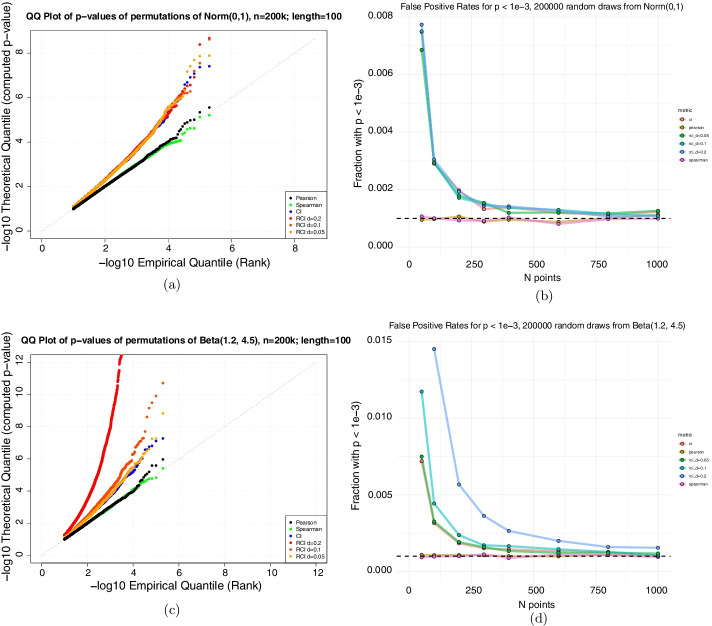
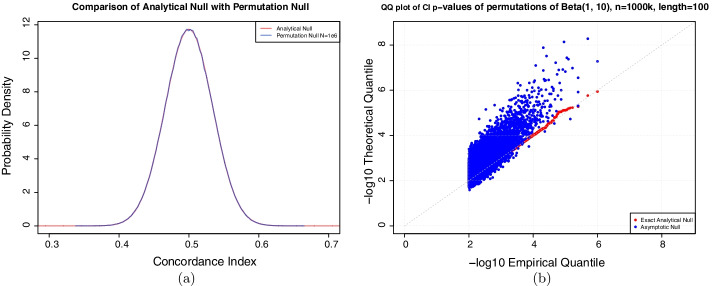
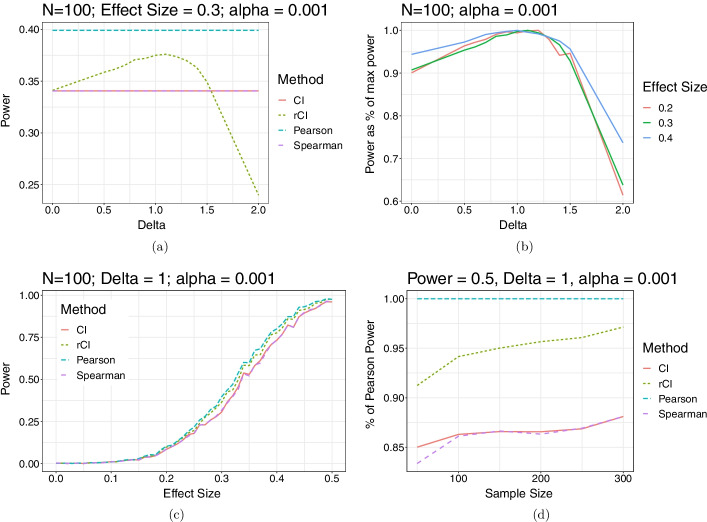
Results: To address this, we introduce two semi-parametric variations on the commonly used concordance index: the robust concordance index and the kernelized concordance index (rCI, kCI), which incorporate measurements about the noise distribution from the data. We demonstrate that common statistical tests applied to the concordance index and its variations fail to control for false positives, and introduce efficient implementations to compute p-values using adaptive permutation testing. We then evaluate the statistical power of these coefficients under simulation and compare with Pearson and Spearman correlation coefficients. Finally, we evaluate the various statistics in matching drugs across pharmacogenomic datasets.

Conclusions: We observe that the rCI and kCI are better powered than the concordance index in simulation and show some improvement on real data. Surprisingly, we observe that the Pearson correlation was the most robust to measurement noise among the different metrics.

Keywords: Association testing; Biomarker; Drug sensitivity; Non-parametric statistics; Pharmacogenomics; Power analysis; Statistics.


Conflict of interest statement

BHK is a shareholder and paid consultant for Code Ocean Inc. The authors have no other competing interests to declare.

Figures

Fig. 1
Fig. 1
The asymptotic approximation of the CI null distribution produces an excess of small p-values. We took independent samples from a normal and beta distribution, computed their similarity using the coefficients above, and calculated asymptotic p-values using the approximations from the text. Because the samples are independent, their p-value distribution should be uniform. The Q-Q plots for normal (a) and beta (c) distributions for samples of length N = 100 sampled 200,000 times shows an excess of small p-values for CI and rCI. In the case of the normal distribution, p-values of 10-4 occur over twenty times more often than would be expected, and for the beta distribution nearly one hundred times more often for rCI. (b, Normal) and (d, beta) summarize the frequency of p<10-3 for different sample sizes. As the number of samples grows large, the asymptotic approximation becomes more correct, but even in the regime of hundreds of samples, extreme p-values occur several times more often than they should under the null
Fig. 2
Fig. 2
The analytical null accurately computes exact p values for CI. a The analytical distribution matches a permutation null of K = 1e6 samples of length 100 from a standard normal distribution. As CI is entirely non-parametric, the choice of distribution is irrelevant. b The Q-Q plot shows the -log10 empirical rank of the CI on the x-axis and the -log10 theoretical quantile from the analytical null (red) and asymptotic null (blue). The analytical p-values are both monotonic and correctly approximate the uniform distribution (grey)
Fig. 3
Fig. 3
Power analysis for data simulated using the bivariate Gaussian family. a displays the effect of the δ parameter on the empirical power at a fixed effect size of population r=0.3. Other statistics unaffected by the parameter are plotted for comparison. b displays the empirically observed power for the rCI statistic only, plotting the dependence on delta at 3 different effect sizes. The power is normalized as percent of maximum power achieved for each effect size to highlight the optimal region for choosing delta. c empirical power for as the population expected Pearson correlation increases. d empirical power for a varying sample size, as the effect size is modified to keep a theoretically constant power for the Pearson correlation of 0.5. Power is plotted as the percent of achieved Pearson correlation power in simulation
Fig. 4
Fig. 4
Drug recall analysis across pharmacogenomic datasets. For all pairs of datasets, the similarity between the vector of cell line responses for all pairs of drugs is computed with each coefficient for (a) all drugs and (b) those drugs with at least fifty cell lines in common across datasets. For drugs present in both datasets, the rank of the matched drug relative to all drugs is extracted. The x-axis is the rank of the matched drug, where 0 is most similar and 1 is least similar. The y-axis is the empirical CDF of the matched drugs for a given rank, or the fraction of matched drugs with rank less than x

References

    1. Greene CS, Tan J, Ung M, Moore JH, Cheng C. Big data bioinformatics. J Cell Physiol. 2014;229:1896–1900. doi: 10.1002/jcp.24662. - DOI - PMC - PubMed
    1. Ching T, et al. Opportunities and obstacles for deep learning in biology and medicine. J R Soc Interface. 2018;15:20170387. doi: 10.1098/rsif.2017.0387. - DOI - PMC - PubMed
    1. Moore JH. Bioinformatics. J Cell Physiol. 2007;213:365–369. doi: 10.1002/jcp.21218. - DOI - PubMed
    1. Tsimring LS. Noise in biology reports on progress in physics. Phys Soc (Great Britain) 2014;77:026601. doi: 10.1088/0034-4885/77/2/026601. - DOI - PMC - PubMed
    1. Costello JC, et al. A community effort to assess and improve drug sensitivity prediction algorithms. Nat Biotechnol. 2014;32:1202–1212. doi: 10.1038/nbt.2877. - DOI - PMC - PubMed

LinkOut - more resources