. 2022 May 18;22(1):1008.
doi: 10.1186/s12889-022-13170-4.

Prevalence of child undernutrition measures and their spatio-demographic inequalities in Bangladesh: an application of multilevel Bayesian modelling

Affiliations

Prevalence of child undernutrition measures and their spatio-demographic inequalities in Bangladesh: an application of multilevel Bayesian modelling

Sumonkanti Das et al. BMC Public Health. .

Abstract

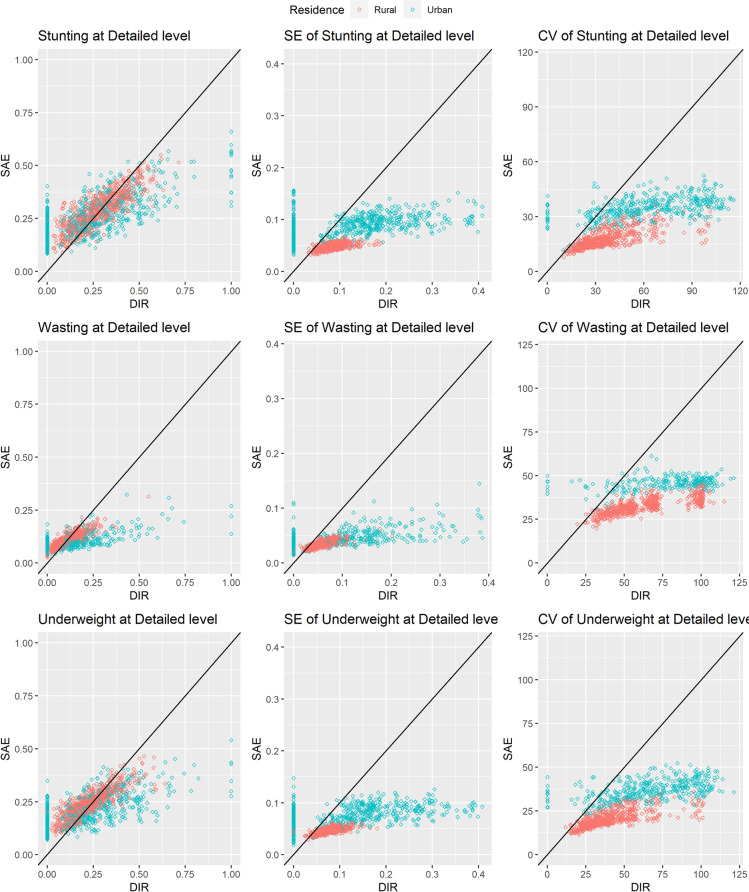
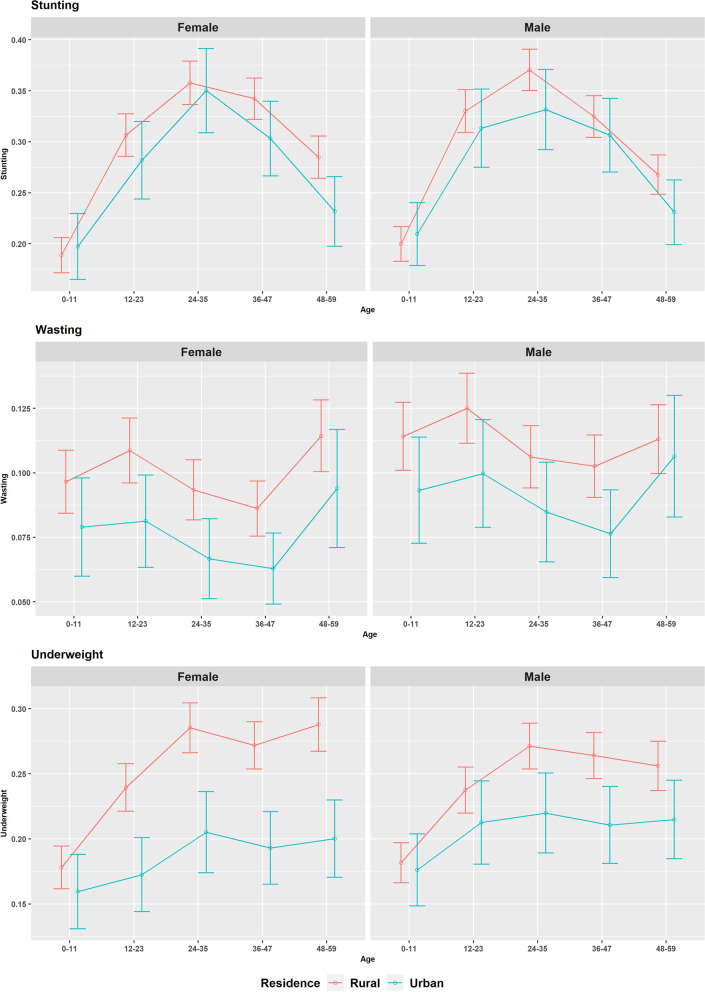
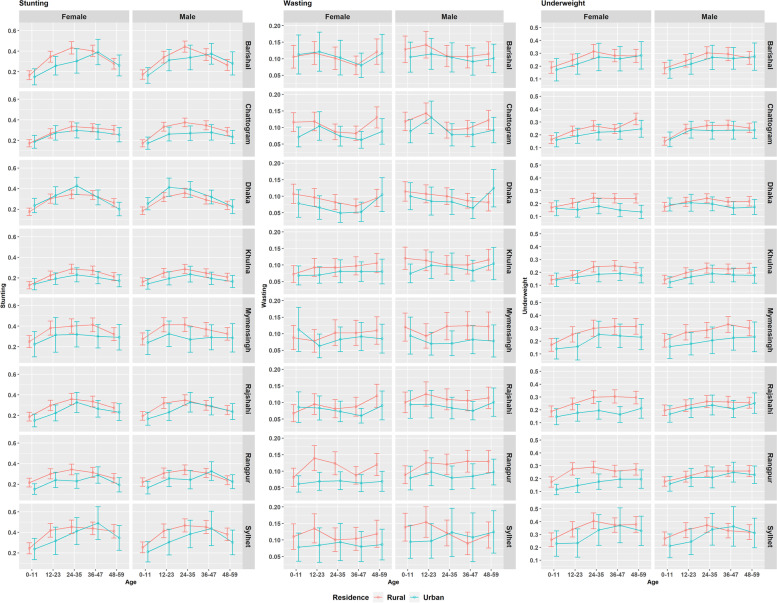
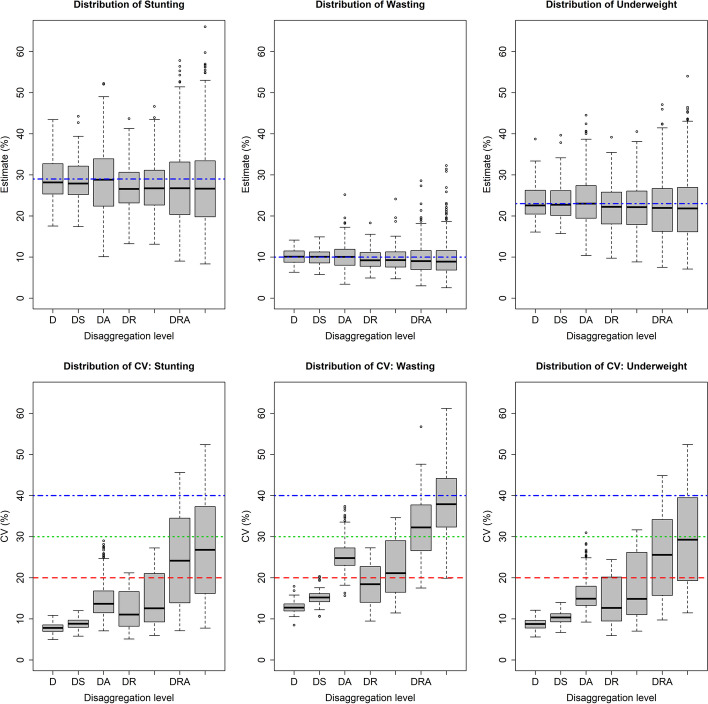
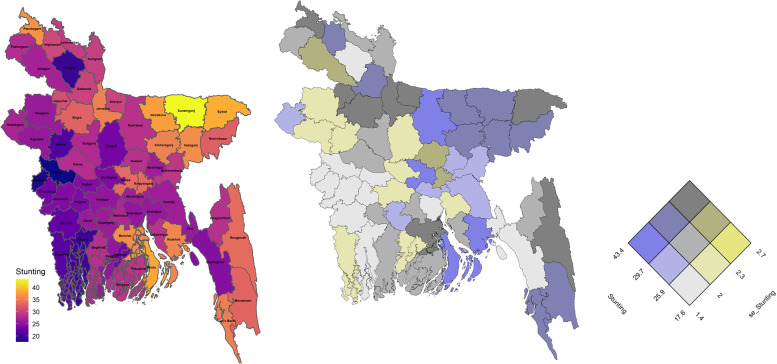
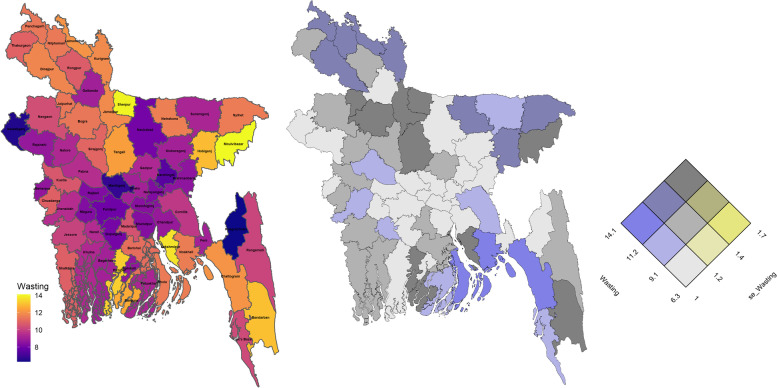
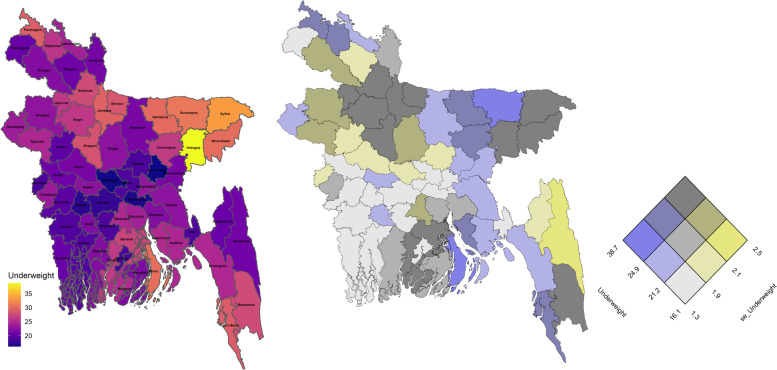
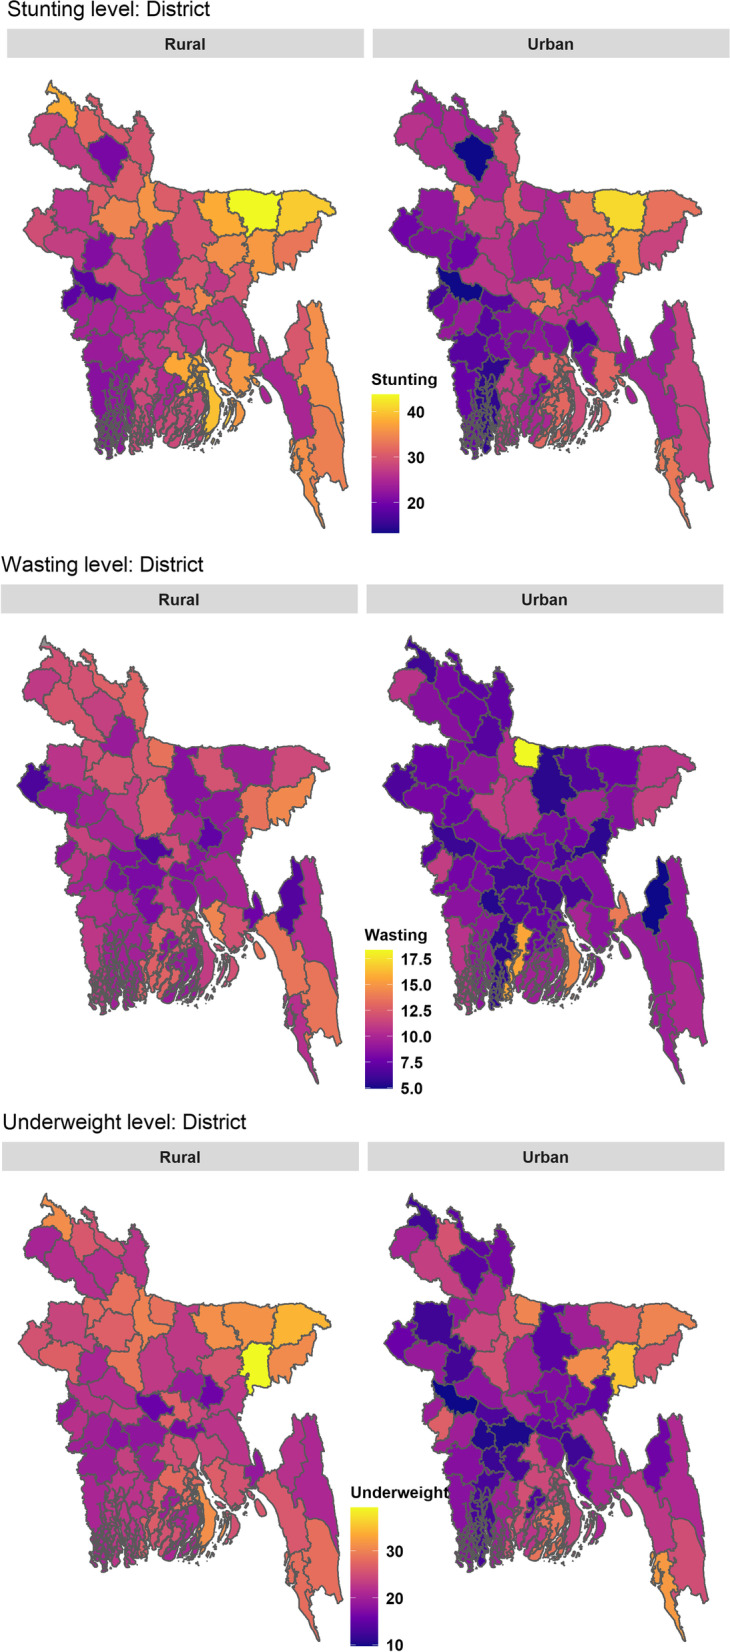
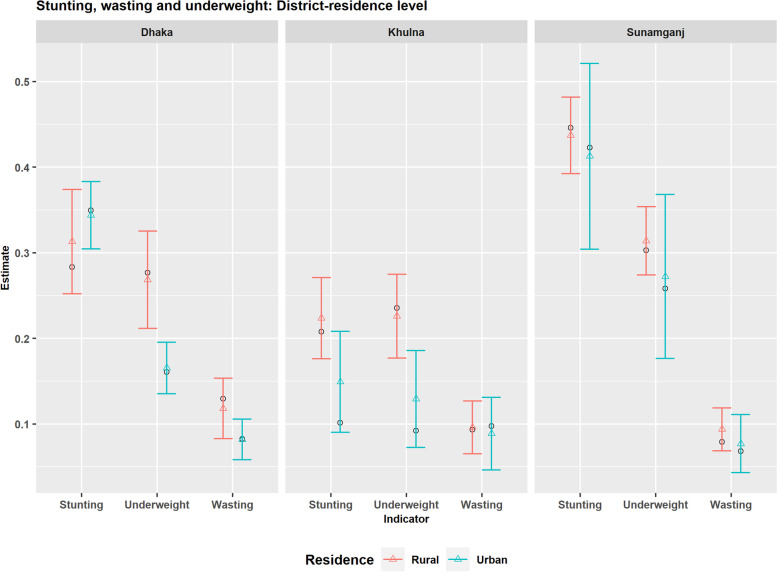
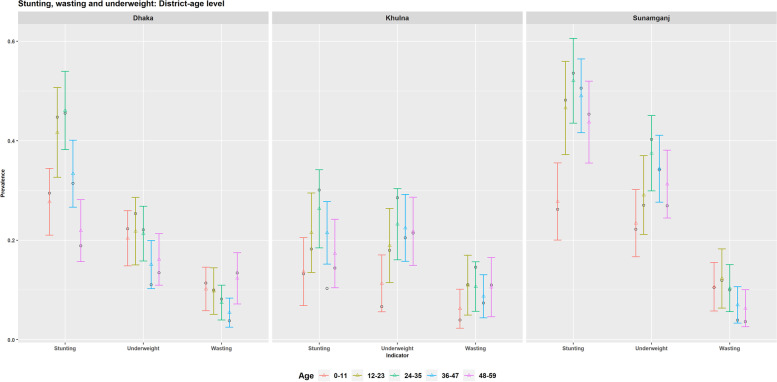
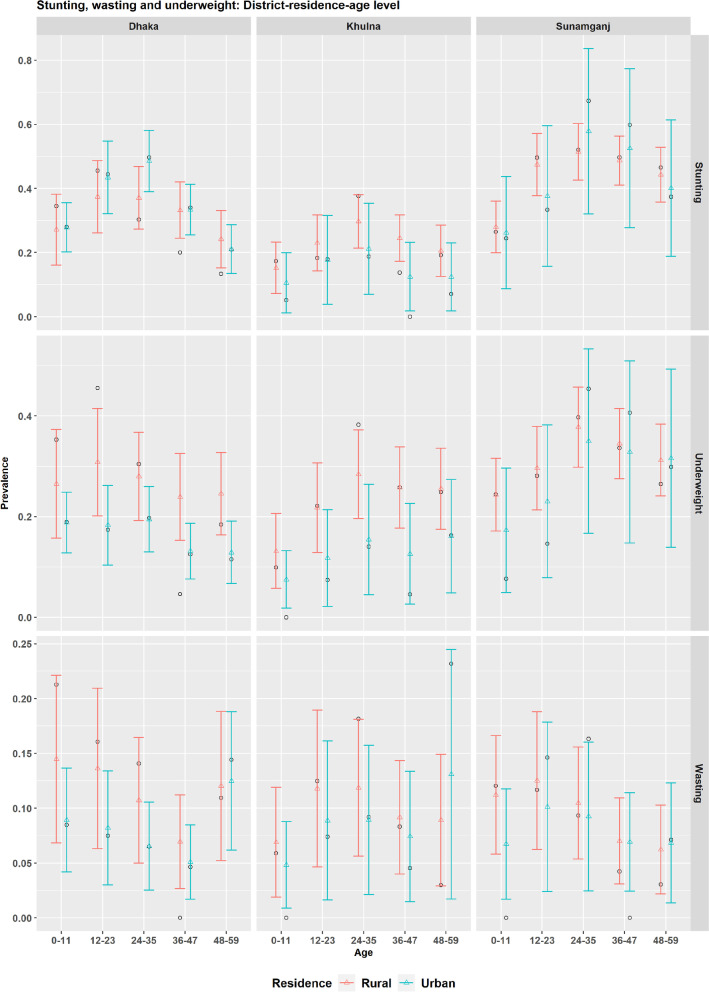
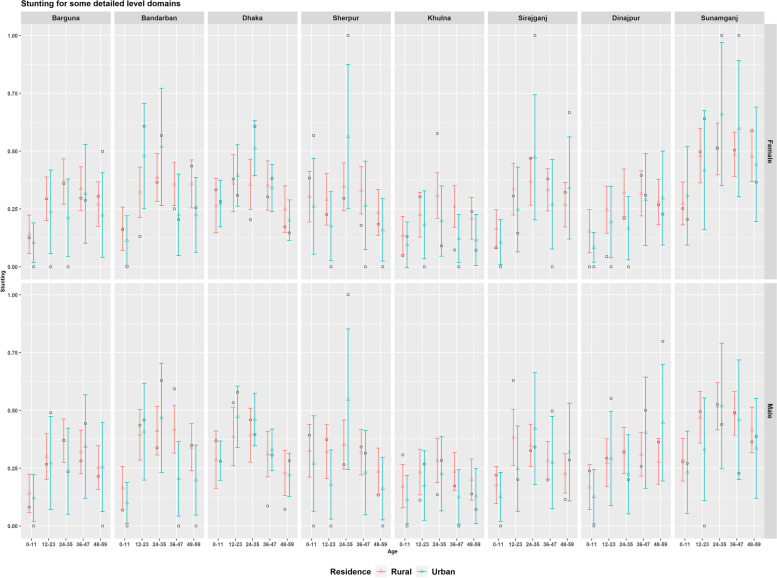
Micro-level statistics on child undernutrition are highly prioritized by stakeholders for measuring and monitoring progress on the sustainable development goals. In this regard district-representative data were collected in the Bangladesh Multiple Indicator Cluster Survey 2019 for identifying localised disparities. However, district-level estimates of undernutrition indicators - stunting, wasting and underweight - remain largely unexplored. This study aims to estimate district-level prevalence of these indicators as well as to explore their disparities at sub-national (division) and district level spatio-demographic domains cross-classified by children sex, age-groups, and place of residence. Bayesian multilevel models are developed at the sex-age-residence-district level, accounting for cross-sectional, spatial and spatio-demographic variations. The detailed domain-level predictions are aggregated to higher aggregation levels, which results in numerically consistent and reasonable estimates when compared to the design-based direct estimates. Spatio-demographic distributions of undernutrition indicators indicate south-western districts have lower vulnerability to undernutrition than north-eastern districts, and indicate significant inequalities within and between administrative hierarchies, attributable to child age and place of residence. These disparities in undernutrition at both aggregated and disaggregated spatio-demographic domains can aid policymakers in the social inclusion of the most vulnerable to meet the sustainable development goals by 2030.

Keywords: Rural-urban disparities; Small area estimation; Spatial and cross-sectional correlations; Stunting; Underweight; Wasting.


Conflict of interest statement

The authors declare that they have no competing interests.

Figures

Fig. 1
Fig. 1
Standard errors (SE) and generalized variance function (GVF) model-based SEs are plotted against the corresponding estimates under original and square-root scales for stunting, wasting and underweight. Empty diamonds and filled circles refer to direct and GVF model-based SEs. Orange and sky-blue colours refer to rural and urban domains, respectively
Fig. 2
Fig. 2
Prevalence of stunting, wasting and underweight for the cross-classified domains of children age-group, sex and place of residence
Fig. 3
Fig. 3
Prevalence of stunting, wasting and underweight for the cross-classified domains of children age-group, sex, place of residence and division
Fig. 4
Fig. 4
Distribution of estimated stunting, wasting and underweight (in %) with their coefficient of variation (CV in %) for the disaggregation level of district (D), district-sex (DS), district-age (DA), district-residence (DR), district-residence-sex (DRS), district-residence-age (DRA), and district-residence-age-sex (DRAS)
Fig. 5
Fig. 5
Spatial distribution of district level stunting through univariate map (left), bivariate map (middle) and bivariate key for the prevalence estimates and their standard errors (right)
Fig. 6
Fig. 6
Spatial distribution of district level wasting through univariate map (left), bivariate map (middle) and bivariate key for the prevalence estimates and their standard errors (right)
Fig. 7
Fig. 7
Spatial distribution of district level underweight through univariate map (left), bivariate map (middle) and bivariate key for the prevalence estimates and their standard errors (right)
Fig. 8
Fig. 8
District level map for the prevalence of stunting, wasting and underweight by the place of residence
Fig. 9
Fig. 9
District level prevalence of stunting, wasting and underweight by the place of residence for Dhaka, Khulna and Sunamganj districts estimated by design-based (black circle dot) and model-based (coloured triangle dots) estimators (with 95% CI)
Fig. 10
Fig. 10
District level prevalence of stunting, wasting and underweight by the children age-groups for Dhaka, Khulna and Sunamganj districts estimated by design-based (black circle dot) and model-based (coloured triangle dots) estimators (with 95% CI)
Fig. 11
Fig. 11
Prevalence of stunting, wasting and underweight for cross-classified domains of children age-groups and place of residence for Dhaka, Khulna and Sunamganj districts estimated by design-based (black circle dot) and model-based (coloured triangle dots) estimators (with 95% CI)
Fig. 12
Fig. 12
Prevalence of stunting for the detailed level domains of 8 districts as representative of 8 divisions estimated by design-based (black circle dot) and model-based (triangle coloured dots) estimators (with 95% CI)

Similar articles

Cited by

References

    1. Pelletier DL, Frongillo Jr EA, Schroeder DG, Habicht J-P. The effects of malnutrition on child mortality in developing countries. Bull World Health Organ. 1995;73(4):443. - PMC - PubMed
    1. Pelletier DL, Frongillo EA. Changes in child survival are strongly associated with changes in malnutrition in developing countries. J Nutr. 2003;133(1):107–19. doi: 10.1093/jn/133.1.107. - DOI - PubMed
    1. Rice AL, Sacco L, Hyder A, Black RE. Malnutrition as an underlying cause of childhood deaths associated with infectious diseases in developing countries. Bull World Health Organ. 2000;78:1207–21. - PMC - PubMed
    1. WHO. Fact Sheet: Children – improving survival and wellbeing. 2020. https://www.who.int/news-room/fact-sheets/detail/children-reducing-morta.... Accessed 25 Aug 2021.
    1. De Onis M, Blössner M. The World Health Organization global database on child growth and malnutrition: methodology and applications. Int J Epidemiol. 2003;32(4):518–26. doi: 10.1093/ije/dyg099. - DOI - PubMed

Publication types