

Resting state EEG power spectrum and functional connectivity in autism: a cross-sectional analysis
- PMID: 35585637
- PMCID: PMC9118870
- DOI: 10.1186/s13229-022-00500-x
Resting state EEG power spectrum and functional connectivity in autism: a cross-sectional analysis
Abstract
Background: Understanding the development of the neuronal circuitry underlying autism spectrum disorder (ASD) is critical to shed light into its etiology and for the development of treatment options. Resting state EEG provides a window into spontaneous local and long-range neuronal synchronization and has been investigated in many ASD studies, but results are inconsistent. Unbiased investigation in large and comprehensive samples focusing on replicability is needed.
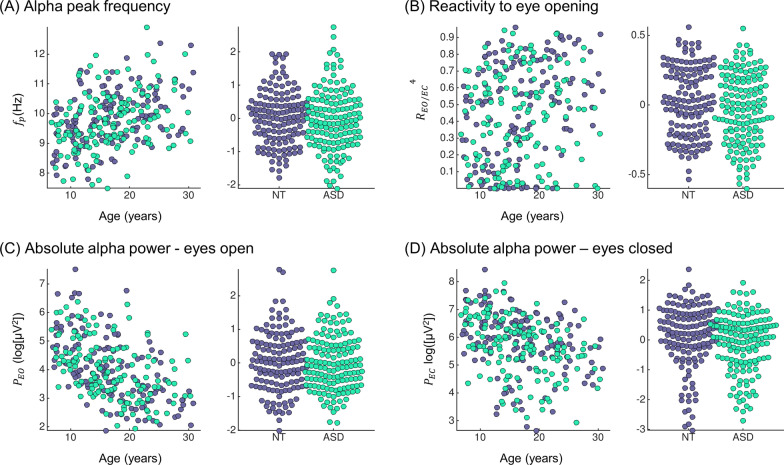
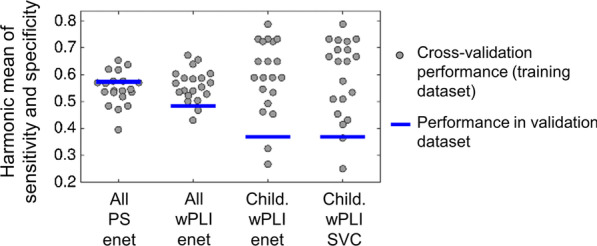
Methods: We quantified resting state EEG alpha peak metrics, power spectrum (PS, 2-32 Hz) and functional connectivity (FC) in 411 children, adolescents and adults (n = 212 ASD, n = 199 neurotypicals [NT], all with IQ > 75). We performed analyses in source-space using individual head models derived from the participants' MRIs. We tested for differences in mean and variance between the ASD and NT groups for both PS and FC using linear mixed effects models accounting for age, sex, IQ and site effects. Then, we used machine learning to assess whether a multivariate combination of EEG features could better separate ASD and NT participants. All analyses were embedded within a train-validation approach (70%-30% split).
Results: In the training dataset, we found an interaction between age and group for the reactivity to eye opening (p = .042 uncorrected), and a significant but weak multivariate ASD vs. NT classification performance for PS and FC (sensitivity 0.52-0.62, specificity 0.59-0.73). None of these findings replicated significantly in the validation dataset, although the effect size in the validation dataset overlapped with the prediction interval from the training dataset.
Limitations: The statistical power to detect weak effects-of the magnitude of those found in the training dataset-in the validation dataset is small, and we cannot fully conclude on the reproducibility of the training dataset's effects.
Conclusions: This suggests that PS and FC values in ASD and NT have a strong overlap, and that differences between both groups (in both mean and variance) have, at best, a small effect size. Larger studies would be needed to investigate and replicate such potential effects.
Keywords: Autism spectrum disorder; EEG; Functional connectivity; Power spectrum; Resting state.
© 2022. The Author(s).
Conflict of interest statement
JD is former, and PG, CHC, SH and JFH are current full-time employees of F. Hoffmann–La Roche Ltd. TBa served in an advisory or consultancy role for ADHS digital, Infectopharm, Lundbeck, Medice, Neurim Pharmaceuticals, Oberberg GmbH, Roche and Takeda. He received conference support or speaker’s fee by Medice and Takeda. He received royalties from Hogrefe, Kohlhammer, CIP Medien, Oxford University Press. SB has acted as an author, consultant or lecturer for Medice, Roche, Hogrefe, Kohlhammer and UTB. JKB was a consultant to/member of advisory board of/and/or speaker for Janssen-Cilag BV, Eli Lilly, Takeda (Shire), Medice, Roche and Servier. CFB is director and shareholder in SBGneuro. DGMM has been a consultant to and advisory board member for Roche and Servier; he is not an employee of nor stock shareholder in any of these companies. JT is a consultant for F. Hoffmann–La Roche Ltd. TC has served as a paid consultant to F. Hoffmann-La Roche Ltd. and Servier and has received royalties from Sage Publications and Guilford Publications.
Figures


References
-
- Maenner MJ, Shaw KA, Baio J, Washington A, Patrick M, DiRienzo M, et al. Prevalence of Autism spectrum disorder among children aged 8 years—Autism and developmental disabilities monitoring network, 11 sites, United States, 2016. MMWR Surveill Summ. 2020;69(4):1–12. doi: 10.15585/mmwr.ss6904a1. - DOI - PMC - PubMed
-
- Cooke E. Letter of support for N170 ERP as a prognostic biomarker for adaptive social functioning and its potential to stratify study populations in people with Autism spectrum disorders (ASD) without intellectual disability. 2020. Available from: https://www.ema.europa.eu/en/documents/other/letter-support-n170-erp-pro...
Publication types
MeSH terms
Grants and funding
LinkOut - more resources
Full Text Sources
Medical
Research Materials
