. 2022 Jul;9(21):e2200978.
doi: 10.1002/advs.202200978. Epub 2022 May 18.

Multiomics Analysis Identifies SOCS1 as Restraining T Cell Activation and Preventing Graft-Versus-Host Disease

Affiliations

Multiomics Analysis Identifies SOCS1 as Restraining T Cell Activation and Preventing Graft-Versus-Host Disease

Huidong Guo et al. Adv Sci (Weinh). 2022 Jul.

Abstract

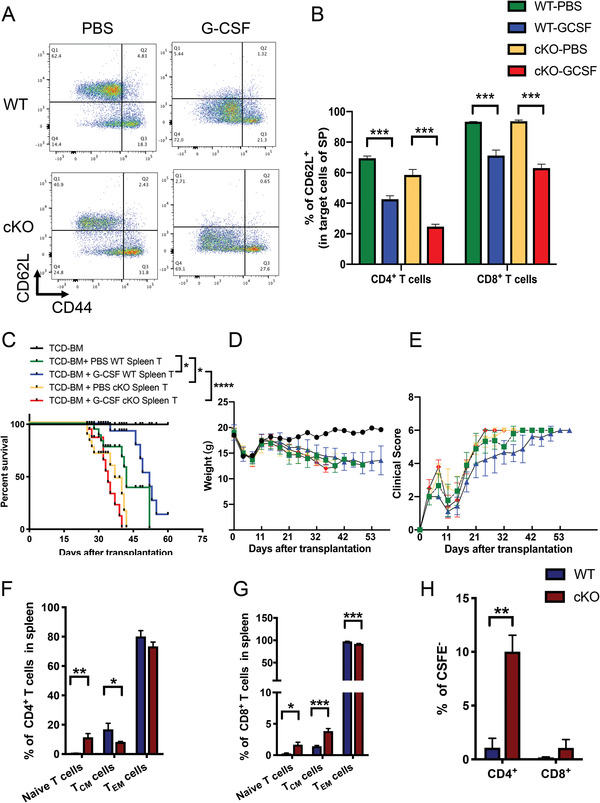
Graft-versus-host disease (GVHD) is a major life-threatening complication of allogeneic hematopoietic stem cell transplantation (allo-HSCT). Inflammatory signaling pathways promote T-cell activation and are involved in the pathogenesis of GVHD. Suppressor of cytokine signaling 1 (SOCS1) is a critical negative regulator for several inflammatory cytokines. However, its regulatory role in T-cell activation and GVHD has not been elucidated. Multiomics analysis of the transcriptome and chromatin structure of granulocyte-colony-stimulating-factor (G-CSF)-administered hyporesponsive T cells from healthy donors reveal that G-CSF upregulates SOCS1 by reorganizing the chromatin structure around the SOCS1 locus. Parallel in vitro and in vivo analyses demonstrate that SOCS1 is critical for restraining T cell activation. Loss of Socs1 in T cells exacerbates GVHD pathogenesis and diminishes the protective role of G-CSF in GVHD mouse models. Further analysis shows that SOCS1 inhibits T cell activation not only by inhibiting the colony-stimulating-factor 3 receptor (CSF3R)/Janus kinase 2 (JAK2)/signal transducer and activator of transcription 3 (STAT3) pathway, but also by restraining activation of the inflammasome signaling pathway. Moreover, high expression of SOCS1 in T cells from patients correlates with low acute GVHD occurrence after HSCT. Overall, these findings identify that SOCS1 is critical for inhibiting T cell activation and represents a potential target for the attenuation of GVHD.

Keywords: SOCS1; T cell tolerance; graft-versus-host disease (GVHD); hematopoietic stem cell transplantation (HSCT); multiomics.


Conflict of interest statement

The authors declare no conflict of interest.

Figures

Figure 1
Figure 1
Multiomics‐analyzed transcriptome and 3D genome of steady state T cells and G‐CSF‐administrated hyporesponsive T cells. A) Outline of the experiments and analyses in this study. We performed in situ Hi‐C, RNA‐seq, and ATAC‐seq experiments on paired T cells (CD4 and CD8) from three healthy donors before and after G‐CSF mobilization in vivo. B) Volcano plot comparing CD8 TpreG and CD8 TpostG. The X‐axis shows the fold change (log2). Among the genes, 54 genes were significantly upregulated, and 78 genes were significantly downregulated. C) Gene pathway enrichment analysis for the upregulated (red) and downregulated (blue) genes in CD8 TpostG cells. D) T‐cell‐activation‐associated chromatin accessibility changes in CD8 TpreG and TpostG. The T‐cell‐activation‐associated ATAC‐seq data base on Bediaga et al.[ 44 ] E) The UCSC (University of California, Santa Cruz) browser views showing ATAC‐seq of representative open chromatin accessibility genes (PRDM1 and TNFAIP3) and close chromatin accessibility genes (JAK1 and IFNG) in CD8 TpostG cells compared with CD8 TpreG cells. F) Motif results predicted by HOMER (Hypergeometric Optimization of Motif EnRichment) software to have different types of loops in CD8 TpostG cells. CTCF is the transcription factor most significantly enriched in static loops. This finding is consistent with the existing literature. G) The regulatory network map of highly expressed genes and enhanced transcription factors in CD8 TpreG and CD8 TpostG cells. Red dots represent transcription factors, and purple dots represent target genes. The regulatory relationships between transcription factors and genes are based on Yan et al.[ 22 ]
Figure 2
Figure 2
G‐CSF upregulated SOCS1 expression level by STAT3‐mediated chromatin structure reorganization. A) Top: Hi‐C interaction matrix of a region (chr16: 10.3–12.3 Mb) in CD8 TpreG cells around the SOCS1 gene. Bottom: Genome browser view of CTCF and STAT3 binding sites, histone modifications, chromatin accessibility, gene expression chromatin states, and 3D genome interactions around the SOCS1 gene in CD8 T cells. The green box represents the region of chromatin with reduced interactions with SOCS1 after G‐CSF mobilization. The yellow box represents the region of chromatin with increase interactions with SOCS1 after G‐CSF mobilization. B) Heatmaps displaying whole‐genome STAT3 and CTCF colocalization in CD8 TpreG cells according to CUT&Tag data (the top 5000 CTCF peaks in CD8 TpreG cells). C) Heatmaps displaying whole‐genome STAT3 and CTCF colocalization in CD8 TpreG cells according to CUT&Tag data (the top 5000 STAT3 peaks in CD8 TpreG cells). D) Aggregate plot of CTCF binding (blue line) and STAT3 binding (green line) at ±5.0 kb from the CTCF peaks in CD8 cells. E) Venn diagram showing the overlap between CTCF peaks (red) and STAT3 peaks (blue) in CD8 TpreG cells. p < 1 × 10⁻¹⁰, hypergeometric test. F) Heatmaps displaying STAT3 occupancy and active promoters (the top 5000 STAT3 peaks in CD8 TpreG cells). G) The peaks of STAT3 binding are classified as belonging to two clusters. The first cluster is the promoter region, which overlaps with the promoters of all genes (±1 kb around the transcription start site), and the second represents intergenic regions. H) Heatmap of the interaction between the promoter region and the intergenic region in the spatial interaction between enhancers and promoters. I) A random selection of the same number of enhancers and promoter peaks has no significant spatial interaction.
Figure 3
Figure 3
Highly expressed SOCS1 in human primary T cells inhibited T cell activation. A) SOCS1 was overexpressed by lentivirus in CD3+ T cells from healthy donor bone marrow. Quantitative real‐time (RT)‐PCR was used to detect SOCS1 expression levels. B) Flow cytometric analysis of proliferation in GFP+ cells. C,D) Percentage of Ki67+ cells in CD4+ cells (C) or CD8+ cells (D). E) The expression level of TIGIT detected by flow cytometry. F) IL‐4 and IL‐10 secretion levels in GFP+CD4+ T cells. G) Gene pathway enrichment analysis for the upregulated genes and downregulated genes in SOCS1‐overexpressing T cells compared with control T cells. Error bars represent the mean ± SEM values from 3 independent experiments, *p < 0.05, **p < 0.01.
Figure 4
Figure 4
Socs1 deficiency in T cells exacerbated mice GVHD. A) Percentage of CD3+ T cells in the spleen from WT or cKO mice (left). Percentage of CD4+ and CD8+ T cells in CD3+ T cells in the spleen from WT or cKO mice (right). B) Representative flow cytometry results and percentages show the CD62L and CD44 expression levels on CD4+ T cells from the spleens of WT or cKO mice. Naïve T cells: CD62L+CD44; central memory T cells (TCM): CD62L+CD44+; effector memory T cells (TEM): CD62LCD44+. C) Representative flow cytometry results and percentages show the IFN‐γ secretion level of CD4+ and CD8+ T cells from the spleens of WT or cKO mice. D) CFSE analysis showed the proliferation ability of T cells from the spleens of WT or cKO mice. E) Treg cells (CD4+CD25+) from the spleens of WT or cKO mice were cocultured with Teff cells (CD4+CD25) from the spleens of WT mice. The proliferation ability of Teff cells was detected by CFSE. F) Survival curves of GVHD mouse models. A total of 5 × 10⁶ TCD‐BM from WT mice and 3 × 10⁶ T cells from the spleens of the WT or cKO donor mice were transplanted into the corresponding recipient mice (blue vs red). A total of 5 × 10⁶ TCD‐BM from WT mice and 2 × 10⁶ T cells from the spleens of the WT or cKO donor mice were transplanted into the corresponding recipient mice (green vs orange). 10 mice per group. G) Clinical scores of GVHD mouse models. The experiment was repeated at least 3 times, with 4–6 mice per group. Error bars represent the mean ± SEM, ***p < 0.001, **p < 0.01, *p < 0.05.
Figure 5
Figure 5
T cell loss of Socs1 disrupted the protecting role of G‐CSF in GVHD models. A) Representative flow cytometry results show the cell subsets in CD4+ and CD8+ T cells from the spleens of WT or cKO mice treated with PBS or G‐CSF. B) CD62L expression level on CD4+ and CD8+ T cells in the spleens of WT or cKO mice treated with PBS or G‐CSF. C) Survival curves of GVHD mouse models. A total of 5 × 10⁶ TCD‐BM from WT mice treated with PBS and 3 × 10⁶ T cells from the spleens of the respective treated donor mice were transplanted into the corresponding wild type recipient mice. 10 mice per group. D) Weight of GVHD mice. E) Clinical score of GVHD mice. F,G) Flow cytometric analysis of the ratio of T cell subsets on donor‐derived CD4+ (F) and CD8+ (G) T cells in the spleens of recipient mice. H) CFSE analysis showed the proliferation ability of donor‐derived T cells in the spleen of recipient mice. The experiment was repeated at least 3 times, with 4–6 mice per group. Error bars represent the mean ± SEM, ***p < 0.001, **p < 0.01, *p < 0.05.
Figure 6
Figure 6
SOCS1 inhibited T cell activation by inhibiting STAT3 phosphorylation. A) RNA‐seq volcano plots comparing gene expression between Socs1‐specific knockout T cells and T cells from WT mice (n = 3). B) Gene pathway enrichment analysis for the upregulated genes in Socs1 deficiency T cells. C) Western blot analysis of STAT3 and phosphorylated STAT3 levels in the SOCS1‐overexpressing Jurkat T cell line. D) Western blot analysis of STAT3 and phosphorylated STAT3 levels in the splenic T cell from Socs1 cKO or WT mice. E) Flow cytometric analysis of the phosphorylated STAT3 levels in SOCS1 mimetic (KIR) or PBS treated primary T cells. n = 4. F) Flow cytometric analysis of the Ki67 levels in SOCS1 mimetic (KIR) or PBS‐treated primary T cells. n = 4. Error bars represent the mean ± SEM, ***p < 0.001.
Figure 7
Figure 7
SOCS1 expression level in primary T cells is negatively related with GVHD occurrence after HSCT. A) Quantitative real‐time PCR showed the expression level of SOCS1 in CD4+ T cells from peripheral allografts and the aGVHD occurrence in related patients. B) SOCS1 expression level in CD3+ T cells from patients with aGVHD and patients without aGVHD in the same period after allo‐HSCT. C) Schematic summary of SOCS1 restraining T cell activation in G‐CSF mobilized T cells. G‐CSF activated STAT3 by receptor CSF3R, then phosphorylated STAT3 entered into nucleus and upregulated SOCS1 expression level by reorganizing chromatin structure around SOCS1 locus. High expression level of SOCS1 inhibited T cell proliferation, inflammatory cytokine secretion and abolished GVHD by inhibiting CSF3R, STAT3, and NLRP3 inflammasome activation.

References

    1. a) Appelbaum F. R., N. Engl. J. Med. 2007, 357, 1472; - PubMed
    2. b) Dohner H., Estey E., Grimwade D., Amadori S., Appelbaum F. R., Buchner T., Dombret H., Ebert B. L., Fenaux P., Larson R. A., Levine R. L., Lo‐Coco F., Naoe T., Niederwieser D., Ossenkoppele G. J., Sanz M., Sierra J., Tallman M. S., Tien H. F., Wei A. H., Lowenberg B., Bloomfield C. D., Blood 2017, 129, 424; - PMC - PubMed
    3. c) Wang Y., Liu Q. F., Xu L. P., Liu K. Y., Zhang X. H., Ma X., Fan Z. P., Wu D. P., Huang X. J., Blood 2015, 125, 3956. - PubMed
    1. a) Markey K. A., MacDonald K. P., Hill G. R., Blood 2014, 124, 354; - PMC - PubMed
    2. b) Penack O., Marchetti M., Ruutu T., Aljurf M., Bacigalupo A., Bonifazi F., Ciceri F., Cornelissen J., Malladi R., Duarte R. F., Giebel S., Greinix H., Holler E., Lawitschka A., Mielke S., Mohty M., Arat M., Nagler A., Passweg J., Schoemans H., Socie G., Solano C., Vrhovac R., Zeiser R., Kroger N., Basak G. W., Lancet Haematol. 2020, 7, e157. - PubMed
    1. Pasquini MC Z. X., http://www.cibmtr.org (accessed: 2014).
    1. Zeiser R., Socie G., Blazar B. R., Br. J. Haematol. 2016, 175, 191. - PubMed
    1. a) Ferrara J. L., Reddy P., Semin. Hematol. 2006, 43, 3; - PubMed
    2. b) Burman A. C., Banovic T., Kuns R. D., Clouston A. D., Stanley A. C., Morris E. S., Rowe V., Bofinger H., Skoczylas R., Raffelt N., Fahy O., McColl S. R., Engwerda C. R., McDonald K. P., Hill G. R., Blood 2007, 110, 1064; - PubMed
    3. c) Tawara I., Koyama M., Liu C., Toubai T., Thomas D., Evers R., Chockley P., Nieves E., Sun Y., Lowler K. P., Malter C., Nishimoto N., Hill G. R., Reddy P., Clin. Cancer Res. 2011, 17, 77. - PMC - PubMed

MeSH terms

Substances

LinkOut - more resources