. 2022 May 2:9:872618.
doi: 10.3389/fvets.2022.872618. eCollection 2022.

A Machine Learning-Based Approach for Classification of Focal Splenic Lesions Based on Their CT Features

Affiliations

A Machine Learning-Based Approach for Classification of Focal Splenic Lesions Based on Their CT Features

Silvia Burti et al. Front Vet Sci. .

Abstract

The aim of the study was to describe the CT features of focal splenic lesions (FSLs) in dogs in order to predict lesion histotype. Dogs that underwent a CT scan and had a FSL diagnosis by cytology or histopathology were retrospectively included in the study. For the statistical analysis the cases were divided into four groups, based on the results of cytopatholoy or hystopathology, namely: nodular hyperplasia (NH), other benign lesions (OBLs), sarcoma (SA), round cell tumour (RCT). Several qualitative and quantitative CT features were described for each case. The relationship occurring between each individual CT feature and the histopathological groups was explred by means of c chi-square test for the count data and by means of Kruskal-Wallis or ANOVA for the continuous data. Furthermore, the main features of each group were described using factorial discriminant analysis, and a decision tree for lesion classification was then developed. Sarcomas were characterised by large dimensions, a cystic appearance and an overall low post contrast-enhancement. NH and OBLs were characterised by small dimensions, a solid appearance and a high post-contrast enhancement. OBLs showed higher post-contrast values than NH. Lastly, RCTs did not exhibit any distinctive CT features. The proposed decision tree had a high accuracy for the classification of SA (0.89) and a moderate accuracy for the classification of OBLs and NH (0.79), whereas it was unable to classify RCTs. The results of the factorial analysis and the proposed decision tree could help the clinician in classifying FSLs based on their CT features. A definitive FSL diagnosis can only be obtained by microscopic examination of the spleen.

Keywords: computed tomography; decision tree; factorial discriminant analysis; focal lesion; sarcoma; spleen.


Conflict of interest statement

The authors declare that the research was conducted in the absence of any commercial or financial relationships that could be construed as a potential conflict of interest.

Figures

Figure 1
Figure 1
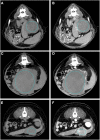
Pre- (A) and post- (B) contrast images of NH showing isoattenuation and hypoenhancement, diffuse enhancement pattern with heterogeneous distribution, well-defined margins, irregular surface, and a cyst-like appearance. Pre- (C) and post- (D) contrast images of NH showing hypoattenuation and hypoenhancement, diffuse enhancement pattern, with heterogeneous distribution, ill-defined margins, regular surface, and cyst-like appearance. Pre- (E) and post- (F) contrast images of NH showing hypoattenuation and hyperenhancement, rim enhancement pattern with heterogeneous distribution, well-defined margins, irregular surface, and solid appearance. The ROI is placed inside the lesions.
Figure 2
Figure 2
Pre- (A) and post- (B) contrast images of an OBL (diagnosed as extramedullary haematopoiesis) showing hypoattenuation and hypoenhancement, diffuse enhancement pattern with heterogeneous distribution, well-defined margins, irregular surface, and solid appearance. Pre- (C) and post- (D) contrast images of an OBL (diagnosed as extramedullary haematopoiesis) showing isoattenuation and hyperenhancement, diffuse enhancement pattern with homogeneous distribution, well-defined margins, regular surface, and solid appearance. Pre- (E) and post- (F) contrast images of an OBL (diagnosed as haematoma) showing hypoattenuation and hypoenhancement, diffuse enhancement pattern with heterogeneous distribution, well-defined margins, regular surface, and cyst-like appearance. The ROI is placed inside the lesions.
Figure 3
Figure 3
Pre- (A) and post- (B) contrast images of a RCT (diagnosed as lymphoma) showing isoattenuation and hyperenhancement, diffuse enhancement pattern with homogeneous distribution, ill-defined margins, irregular surface, and solid appearance. Pre- (C) and post- (D) contrast images of a RCT (diagnosed as mastocytoma) showing hypoattenuation and hyperenhancement, rim enhancement pattern, with heterogeneous distribution, well-defined margins, regular surface, and solid appearance. Pre- (E) and post- (F) contrast images of a RCT (diagnosed as mesenchymal neoplasia) showing hypoattenuation and hypoenhancement, diffuse enhancement pattern with heterogeneous distribution, well-defined margins, irregular surface, and cyst-like appearance. The ROI is placed inside the lesions.
Figure 4
Figure 4
Pre- (A) and post- (B) contrast images of a sarcoma (diagnosed as haemangiosarcoma) showing hypoattenuation and hypoenhancement, rim enhancement pattern with heterogeneous distribution, well-defined margins, irregular surface, and cyst-like appearance. Pre- (C) and post- (D) contrast images of a sarcoma (diagnosed as sarcoma) showing isoattenuation and hypoenhancement, diffuse enhancement pattern with heterogeneous distribution, well-defined margins, irregular surface, and cyst-like appearance. Pre- (E) and post- (F) contrast images of a sarcoma (diagnosed as stromal sarcoma) showing hypoattenuation and hyperenhancement, diffuse enhancement pattern with heterogeneous distribution, well-defined margins, irregular surface, and cyst-like appearance. The ROI is placed inside the lesions.
Figure 5
Figure 5
Box and whisker plot of the maximum dimension (A), ellipsoid volume (B), HU value of the pre-contrast normal spleen (C), HU value of the post-contrast normal spleen (D), HU value of the pre-contrast lesion (E), HU value of the post-contrast lesion (F).
Figure 6
Figure 6
Distribution of the cases (A) and of the centroids (B) based on the F1 and F2 components of the factorial discriminant analysis classification.
Figure 7
Figure 7
The machine learning-based decision tree developed on the qualitative and the quantitative CT features of the focal splenic lesions. The second line in each box shows the probability of each class at that node (i.e., the probability of the class conditioned on the node) and the third line shows the percentage of observations used at that node.

References

    1. Spangler WL, Culbertson MR. Prevalence, type, and importance of splenic diseases in dogs: 1,480 cases (1985–1989). J Am Vet Med Assoc. (1992) 15:829–34. - PubMed
    1. Kutara K, Seki M, Ishigaki K, Teshima K, Ishikawa C, Kagawa Y, et al. . Triple-phase helical computed tomography in dogs with solid splenic masses. J Vet Med Sci. (2017) 79:1870–7. 10.1292/jvms.17-0253 - DOI - PMC - PubMed
    1. Meuten DJ. Tumors in Domestic Animals. Ames, IA: John Wiley & Sons Inc. (2017). 10.1002/9780470376928 - DOI
    1. Cordella A, Caldin M, Bertolini G. Splenic extramedullary hematopoiesis in dogs is frequently detected on multiphase multidetector-row CT as hypervascular nodules. Vet Radiol Ultrasound. (2020) 61:512–8. 10.1111/vru.12872 - DOI - PubMed
    1. Mattoon J. Small Animal Diagnostic Ultrasound. St. Louis, MO: Elsevier - Saunders; (2015).

LinkOut - more resources