

Green Space Cooling Effect and Contribution to Mitigate Heat Island Effect of Surrounding Communities in Beijing Metropolitan Area
- PMID: 35586004
- PMCID: PMC9108199
- DOI: 10.3389/fpubh.2022.870403
Green Space Cooling Effect and Contribution to Mitigate Heat Island Effect of Surrounding Communities in Beijing Metropolitan Area
Abstract
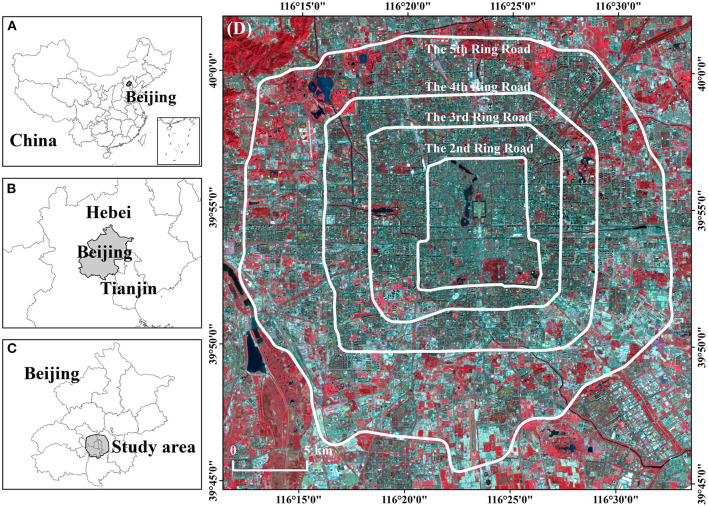
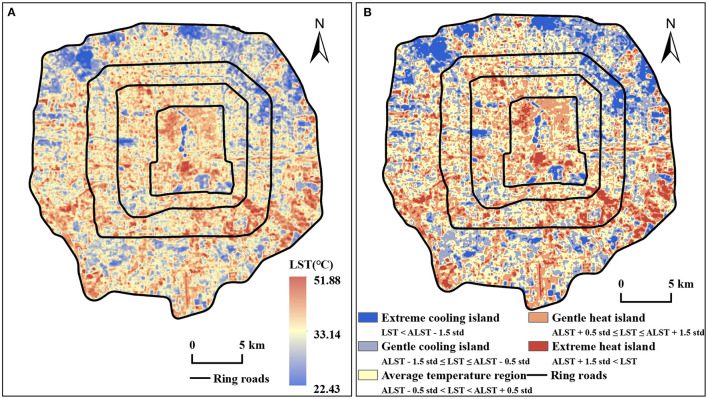
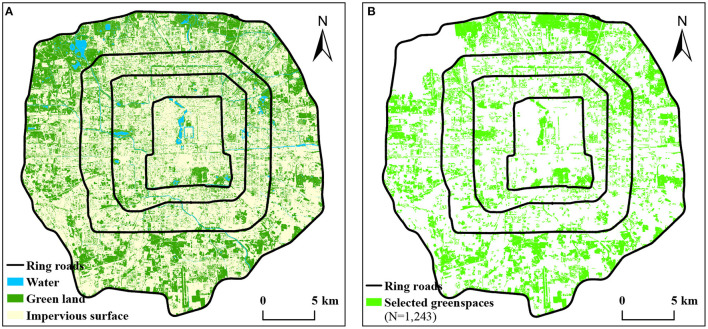
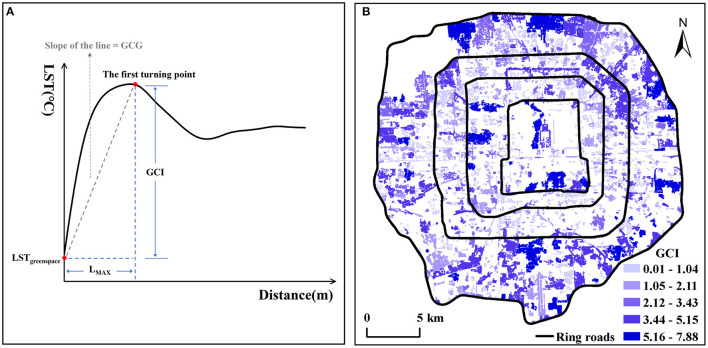
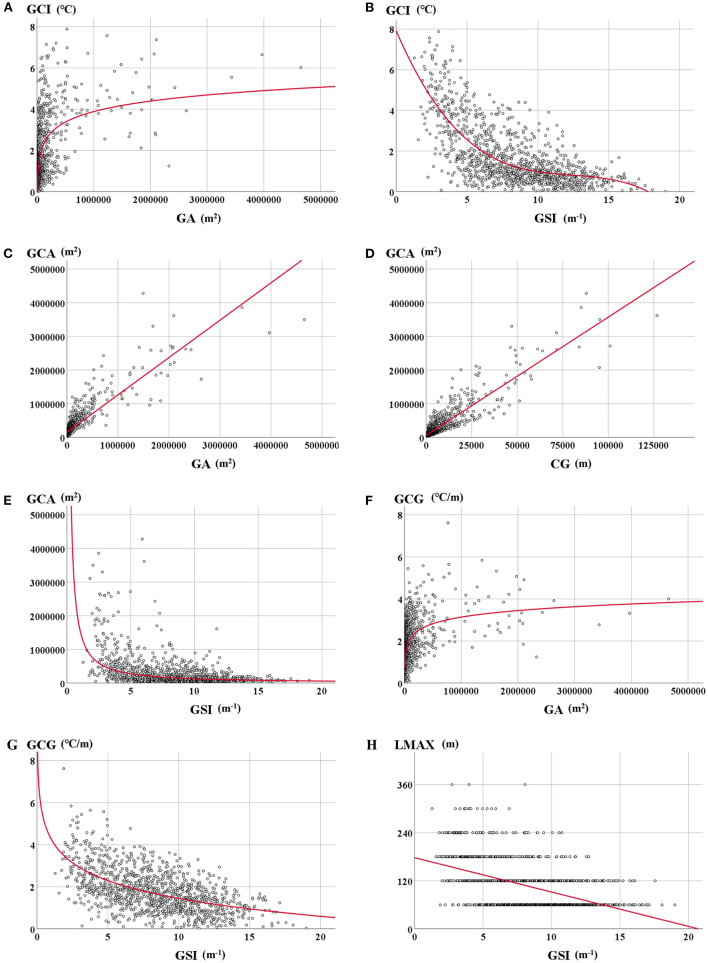
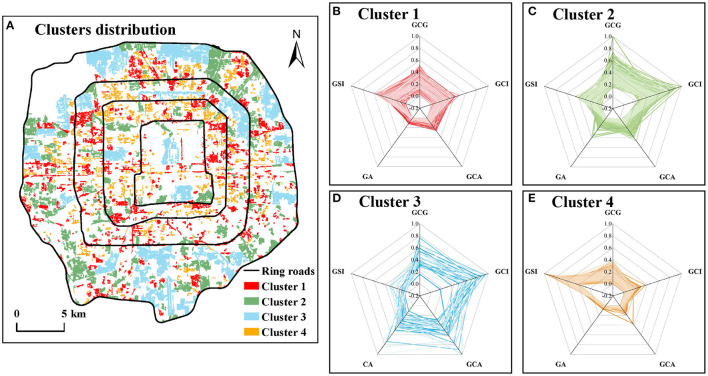
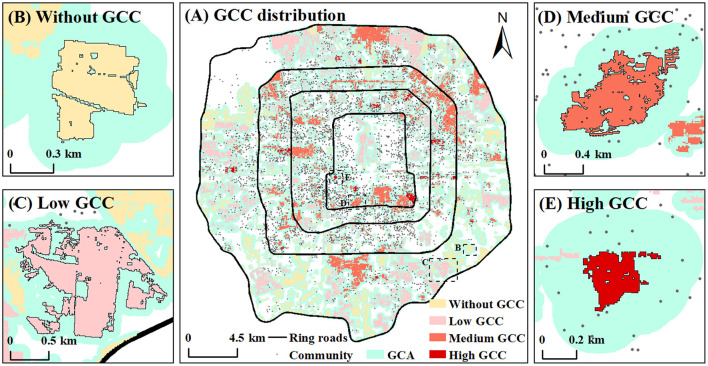
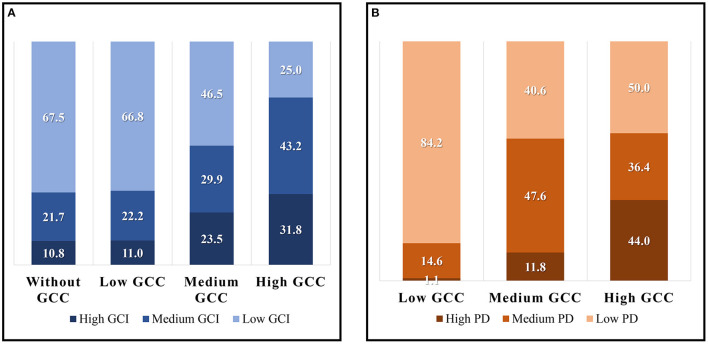
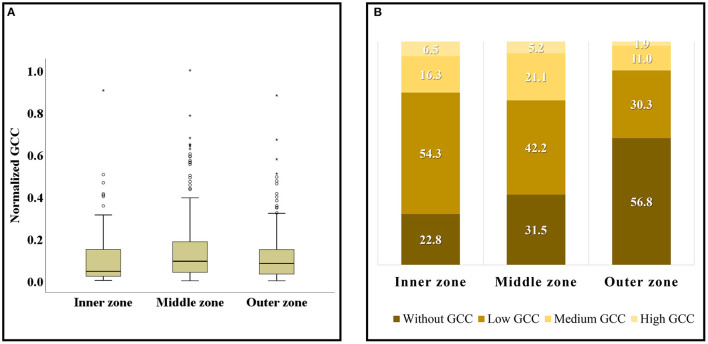
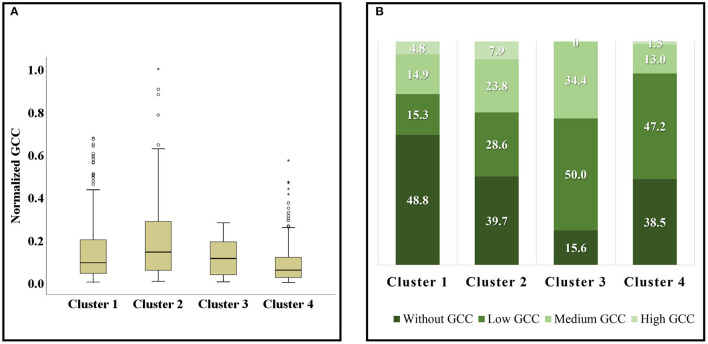
With the rapid process of urbanization and global warming, many metropolises are vulnerable to high temperatures in summer, threatening the health of residents. However, green spaces can generate a cooling effect to mitigate the urban heat island effect in big cities. They can also help to improve the living quality and wellbeing of surrounding residents. In this paper, we utilized the radiative transfer equation algorithm, k-means clustering algorithm, big data crawling, and spatial analysis to quantify and map the spatial distribution, cooling capacity, and cooling contribution for surrounding communities of 1,157 green spaces within Beijing Fifth Ring Road, a typical metropolitan area. The findings showed that (1) the area proportion of the heat island in the study area is larger than that of the cooling island. Accounting for only about 30% area in the study area, the green spaces reduce the average land surface temperature by 1.32°C. (2) The spatial features of green space, such as area and shape complexity, have a significant influence on its cooling effect. (3) Four clusters of green spaces with specific spatial features and cooling capacity were identified. And there were differences among these clusters in green space cooling contribution for the surrounding communities. (4) The differences in green space cooling contribution also existed in different urban zones. Specifically, the middle zone performed significantly better than the inner and outer zones. (5) We furthered in finding that some green spaces with medium and high cooling contributions need to improve their cooling capacity soon, and some green spaces with low cooling contributions or no contributions have a good potential for constructing new communities in the future. Our study could help planners and government understand the current cooling condition of green spaces, to improve their cooling capacity, mitigate the urban heat island effect, and create a comfortable and healthy thermal environment in summer.
Keywords: cooling contribution; cooling effect; green space; metropolitan area; resident health; urban thermal environment.
Copyright © 2022 Liu, Zhao, Sun, Xu, Huang and Zhu.
Conflict of interest statement
The authors declare that the research was conducted in the absence of any commercial or financial relationships that could be construed as a potential conflict of interest.
Figures
References
-
- Rauf S, Pasra MM, Yuliani. Analysis of correlation between urban heat islands (UHI) with land-use using sentinel 2 time-series image in Makassar city. IOP Conf Ser Earth Environ Sci. (2020) 419:12088. 10.1088/1755-1315/419/1/012088 - DOI
-
- Zhao J, Yan Y, Deng H, Liu G, Shao G. Remarks about landsenses ecology and ecosystem services. Int J Sust Dev World Ecol. (2020) 27:1–6. 10.1080/13504509.2020.1718795 - DOI
-
- Zhao ZQ, He BJ, Li LG, Wang HB, Darko A. Profile and concentric zonal analysis of relationships between land use/land cover and land surface temperature: case study of Shenyang, China. Energy Build. (2017) 155:282–95. 10.1016/j.enbuild.2017.09.046 - DOI
-
- Wang J, Chen Y, Liao W, He G, Tett SFB, Yan Z, et al. Anthropogenic emissions and urbanization increase risk of compound hot extremes in cities. Nat Clim Change. (2021) 11:1084–9. 10.1038/s41558-021-01196-2 - DOI
Publication types
MeSH terms
LinkOut - more resources
Full Text Sources