

Horizontal gene transfer drives the evolution of dependencies in bacteria
- PMID: 35586069
- PMCID: PMC9108730
- DOI: 10.1016/j.isci.2022.104312
Horizontal gene transfer drives the evolution of dependencies in bacteria
Abstract
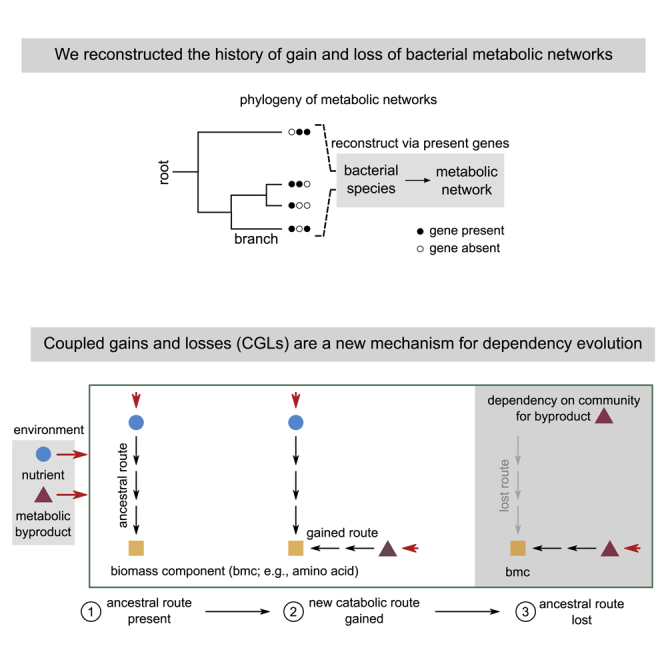
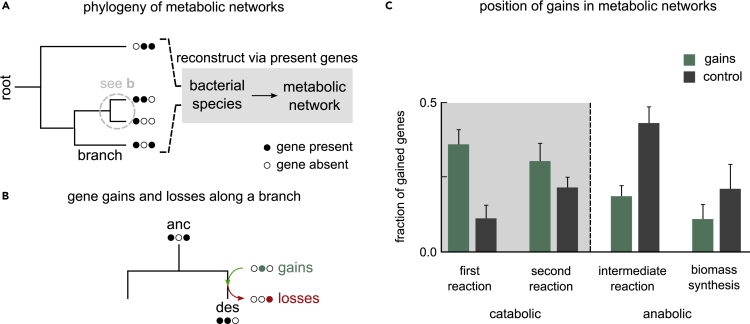
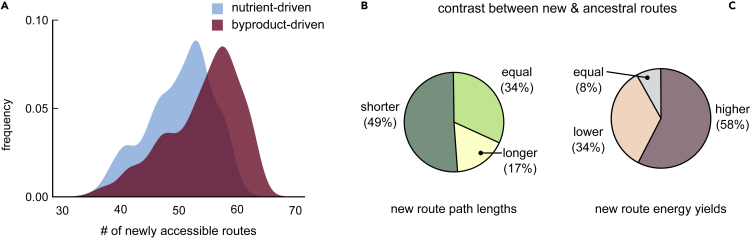
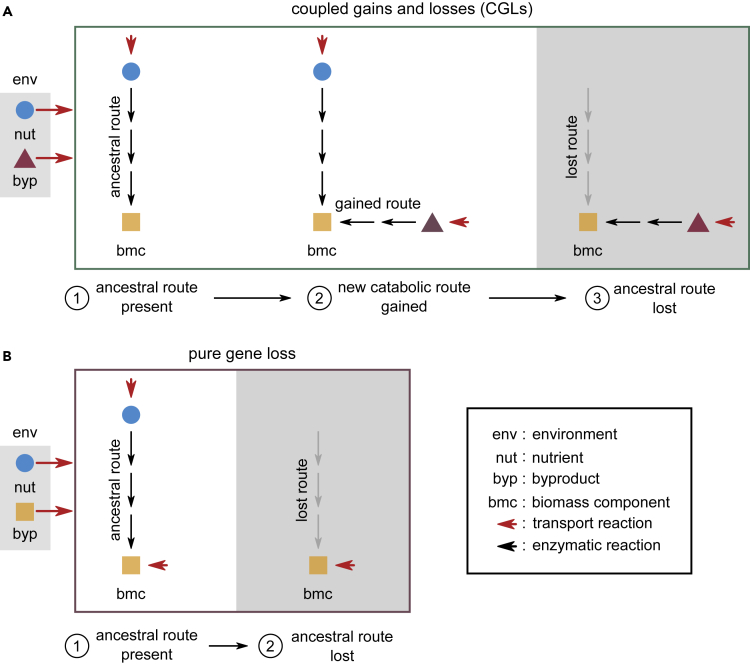
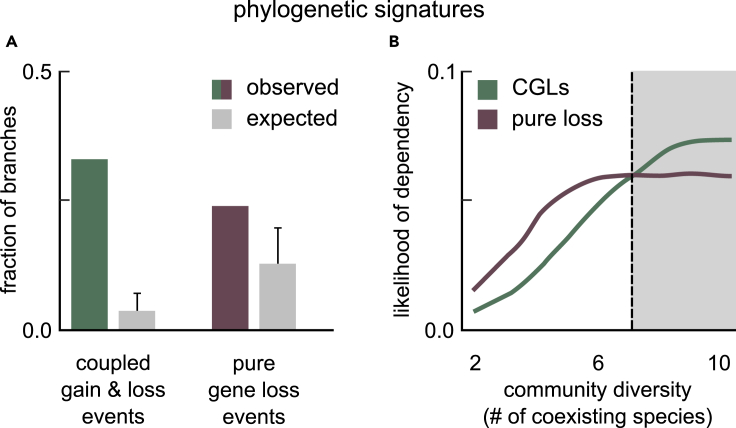
Many naturally occurring bacteria lead a lifestyle of metabolic dependency for crucial resources. We do not understand what factors drive bacteria toward this lifestyle and how. Here, we systematically show the crucial role of horizontal gene transfer (HGT) in dependency evolution in bacteria. Across 835 bacterial species, we map gene gain-loss dynamics on a deep evolutionary tree and assess the impact of HGT and gene loss on metabolic networks. Our analyses suggest that HGT-enabled gene gains can affect which genes are later lost. HGT typically adds new catabolic routes to bacterial metabolic networks, leading to new metabolic interactions between bacteria. We also find that gaining new routes can promote the loss of ancestral routes ("coupled gains and losses", CGLs). Phylogenetic patterns indicate that both dependencies-mediated by CGLs and those purely by gene loss-are equally likely. Our results highlight HGT as an important driver of metabolic dependency evolution in bacteria.
Keywords: Computational molecular modeling; Microbiology; Molecular network.
© 2022 The Author.
Conflict of interest statement
The author declares that there are no competing interests.
Figures
Similar articles
-
Algorithms for computing parsimonious evolutionary scenarios for genome evolution, the last universal common ancestor and dominance of horizontal gene transfer in the evolution of prokaryotes.BMC Evol Biol. 2003 Jan 6;3:2. doi: 10.1186/1471-2148-3-2. Epub 2003 Jan 6. BMC Evol Biol. 2003. PMID: 12515582 Free PMC article.
-
Horizontal gene transfer dynamics and distribution of fitness effects during microbial in silico evolution.BMC Bioinformatics. 2012 Jun 25;13 Suppl 10(Suppl 10):S13. doi: 10.1186/1471-2105-13-S10-S13. BMC Bioinformatics. 2012. PMID: 22759418 Free PMC article.
-
Evolutionary assembly patterns of prokaryotic genomes.Genome Res. 2016 Jun;26(6):826-33. doi: 10.1101/gr.200097.115. Epub 2016 Apr 14. Genome Res. 2016. PMID: 27197212 Free PMC article.
-
Horizontal gene transfer: essentiality and evolvability in prokaryotes, and roles in evolutionary transitions.F1000Res. 2016 Jul 25;5:F1000 Faculty Rev-1805. doi: 10.12688/f1000research.8737.1. eCollection 2016. F1000Res. 2016. PMID: 27508073 Free PMC article. Review.
-
Role of horizontal gene transfer in the evolution of plant parasitism among nematodes.Methods Mol Biol. 2009;532:517-35. doi: 10.1007/978-1-60327-853-9_30. Methods Mol Biol. 2009. PMID: 19271205 Review.
Cited by
-
The evolution of autonomy from two cooperative specialists in fluctuating environments.Proc Natl Acad Sci U S A. 2024 Aug 27;121(35):e2317182121. doi: 10.1073/pnas.2317182121. Epub 2024 Aug 22. Proc Natl Acad Sci U S A. 2024. PMID: 39172793 Free PMC article.
-
Community diversity is associated with intra-species genetic diversity and gene loss in the human gut microbiome.Elife. 2023 Feb 9;12:e78530. doi: 10.7554/eLife.78530. Elife. 2023. PMID: 36757364 Free PMC article.
-
Insights on the Evolutionary Genomics of the Blautia Genus: Potential New Species and Genetic Content Among Lineages.Front Microbiol. 2021 Apr 26;12:660920. doi: 10.3389/fmicb.2021.660920. eCollection 2021. Front Microbiol. 2021. PMID: 33981291 Free PMC article.
-
Predicting horizontal gene transfers with perfect transfer networks.Algorithms Mol Biol. 2024 Feb 6;19(1):6. doi: 10.1186/s13015-023-00242-2. Algorithms Mol Biol. 2024. PMID: 38321476 Free PMC article.
-
Overcoming Mycobacterium tuberculosis Drug Resistance: Novel Medications and Repositioning Strategies.ACS Omega. 2023 Sep 1;8(36):32244-32257. doi: 10.1021/acsomega.3c02563. eCollection 2023 Sep 12. ACS Omega. 2023. PMID: 37720746 Free PMC article. Review.
References
-
- Davis D.J. The accessory factors in bacterial growth: iv. the” satellite” or symbiosis phenomenon of pfeiffer’s bacillus (b. influenzae) J. Infect. Dis. 1921;29:178–186.
LinkOut - more resources
Full Text Sources
