

LMPA Regulates Lesion Mimic Leaf and Panicle Development Through ROS-Induced PCD in Rice
- PMID: 35586211
- PMCID: PMC9108926
- DOI: 10.3389/fpls.2022.875038
LMPA Regulates Lesion Mimic Leaf and Panicle Development Through ROS-Induced PCD in Rice
Abstract
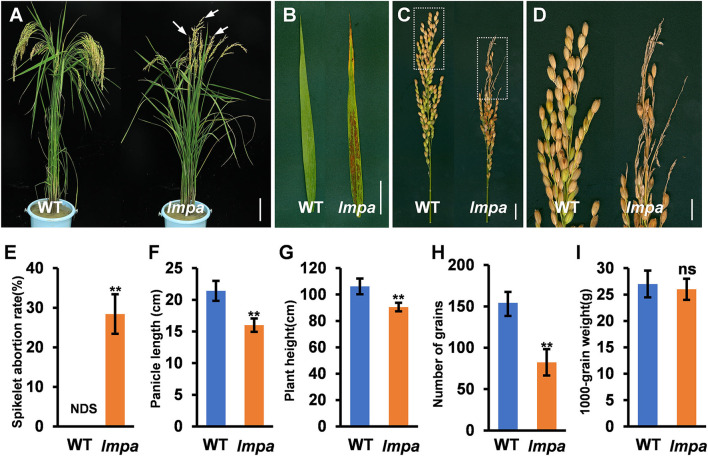
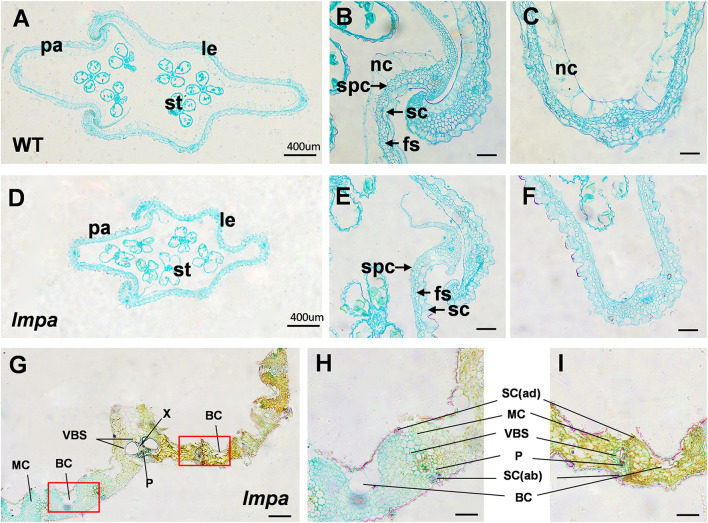
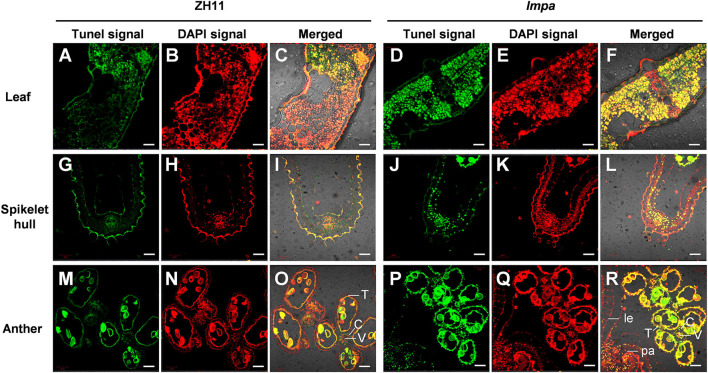
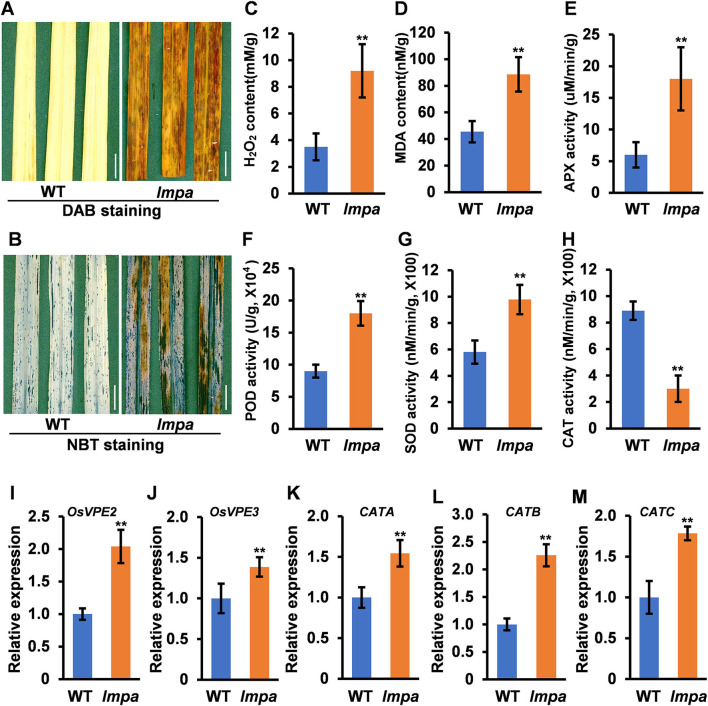
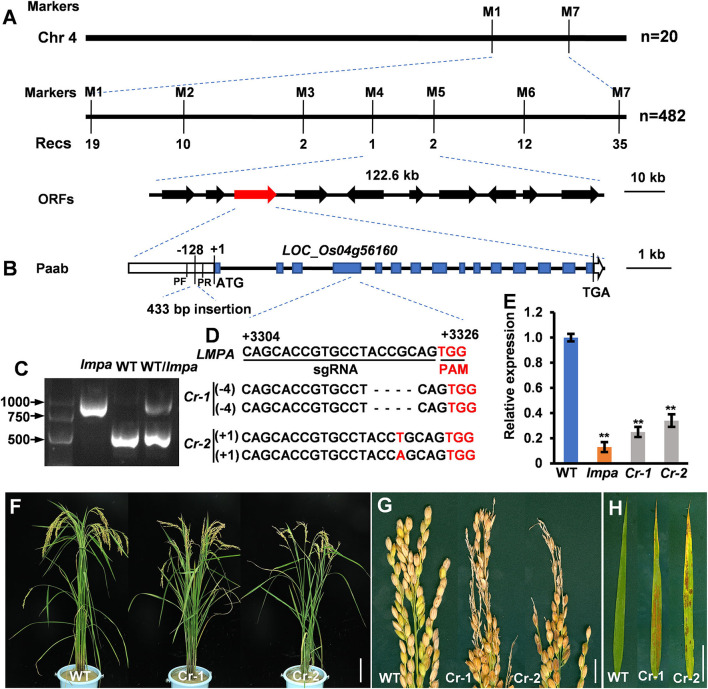
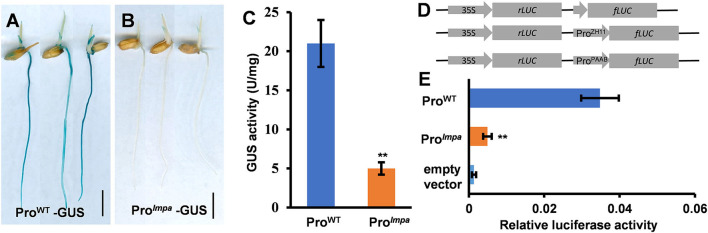
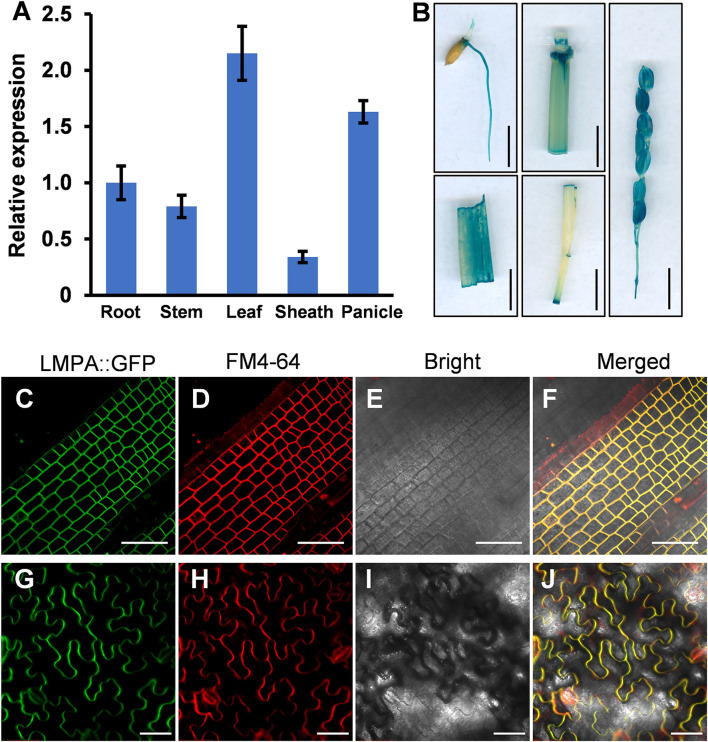
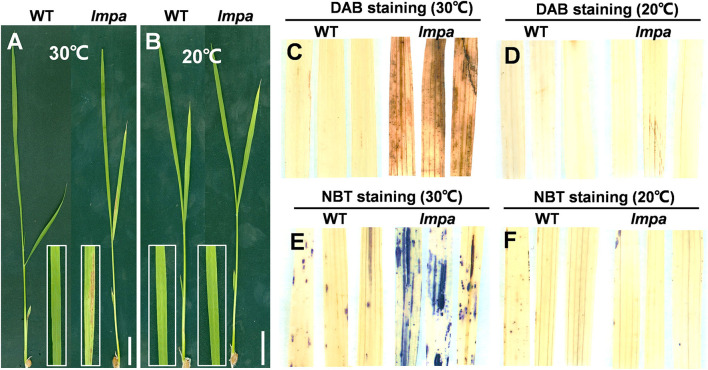
Leaf and panicle are important nutrient and yield organs in rice, respectively. Although several genes controlling lesion mimic leaf and panicle abortion have been identified, a few studies have reported the involvement of a single gene in the production of both the traits. In this study, we characterized a panicle abortion mutant, lesion mimic leaf and panicle apical abortion (lmpa), which exhibits lesions on the leaf and causes degeneration of apical spikelets. Molecular cloning revealed that LMPA encodes a proton pump ATPase protein that is localized in the plasma membrane and is highly expressed in leaves and panicles. The analysis of promoter activity showed that the insertion of a fragment in the promoter of lmpa caused a decrease in the transcription level. Cellular and histochemistry analysis indicated that the ROS accumulated and cell death occurred in lmpa. Moreover, physiological experiments revealed that lmpa was more sensitive to high temperatures and salt stress conditions. These results provide a better understanding of the role of LMPA in panicle development and lesion mimic formation by regulating ROS homeostasis.
Keywords: cell death; lesion mimic; panicle apical abortion; plasma membrane H+-ATPase; reactive oxygen species; rice.
Copyright © 2022 Hu, Tan, Wen, Fang, Wang, Wu, Wang, Wu, Chai, Zhu, Zhang, Gao, Ren, Zeng, Shen, Xue, Qian and Hu.
Conflict of interest statement
The authors declare that the research was conducted in the absence of any commercial or financial relationships that could be construed as a potential conflict of interest. The reviewer YX declared a shared affiliation with the author(s) YWe to the handling editor at the time of review.
Figures
Similar articles
-
Panicle Apical Abortion 7 Regulates Panicle Development in Rice (Oryza sativa L.).Int J Mol Sci. 2022 Aug 22;23(16):9487. doi: 10.3390/ijms23169487. Int J Mol Sci. 2022. PMID: 36012754 Free PMC article.
-
Panicle Apical Abortion 3 Controls Panicle Development and Seed Size in Rice.Rice (N Y). 2021 Jul 15;14(1):68. doi: 10.1186/s12284-021-00509-5. Rice (N Y). 2021. PMID: 34264425 Free PMC article.
-
APICAL SPIKELET ABORTION (ASA) Controls Apical Panicle Development in Rice by Regulating Salicylic Acid Biosynthesis.Front Plant Sci. 2021 Feb 25;12:636877. doi: 10.3389/fpls.2021.636877. eCollection 2021. Front Plant Sci. 2021. PMID: 33719311 Free PMC article.
-
Rice Lesion Mimic Mutants (LMM): The Current Understanding of Genetic Mutations in the Failure of ROS Scavenging during Lesion Formation.Plants (Basel). 2021 Aug 4;10(8):1598. doi: 10.3390/plants10081598. Plants (Basel). 2021. PMID: 34451643 Free PMC article. Review.
-
Current Advances in Molecular Mechanisms and Physiological Basis of Panicle Degeneration in Rice.Int J Mol Sci. 2019 Apr 1;20(7):1613. doi: 10.3390/ijms20071613. Int J Mol Sci. 2019. PMID: 30939720 Free PMC article. Review.
Cited by
-
Lesion Mimic Mutant: An Ideal Genetic Material for Deciphering the Balance Between Plant Immunity and Growth.Rice (N Y). 2025 May 13;18(1):34. doi: 10.1186/s12284-025-00789-1. Rice (N Y). 2025. PMID: 40355767 Free PMC article. Review.
-
Multilayered regulation of developmentally programmed pre-anthesis tip degeneration of the barley inflorescence.Plant Cell. 2023 Oct 30;35(11):3973-4001. doi: 10.1093/plcell/koad164. Plant Cell. 2023. PMID: 37282730 Free PMC article.
-
Plasma membrane-localized hexose transporter OsSWEET1b, affects sugar metabolism and leaf senescence.Plant Cell Rep. 2024 Jan 6;43(1):29. doi: 10.1007/s00299-023-03125-3. Plant Cell Rep. 2024. PMID: 38183427
-
GW9 determines grain size and floral organ identity in rice.Plant Biotechnol J. 2024 Apr;22(4):915-928. doi: 10.1111/pbi.14234. Epub 2023 Nov 20. Plant Biotechnol J. 2024. PMID: 37983630 Free PMC article.
-
Genome-wide analysis of the HSF family in Allium sativum L. and AsHSFB1 overexpression in Arabidopsis under heat stress.BMC Genomics. 2024 Nov 11;25(1):1072. doi: 10.1186/s12864-024-11002-w. BMC Genomics. 2024. PMID: 39528922 Free PMC article.
References
-
- Akter M. B., Piao R., Kim B., Lee Y., Koh E., Koh H. J. (2014). Fine mapping and candidate gene analysis of a new mutant gene for panicle apical abortion in rice. Euphytica 197, 387–398. 10.1007/s10681-014-1074-8 - DOI
LinkOut - more resources
Full Text Sources