. 2022 May 2:12:862582.
doi: 10.3389/fcimb.2022.862582. eCollection 2022.

Mycobacterium tuberculosis Induces Irg1 in Murine Macrophages by a Pathway Involving Both TLR-2 and STING/IFNAR Signaling and Requiring Bacterial Phagocytosis

Affiliations

Mycobacterium tuberculosis Induces Irg1 in Murine Macrophages by a Pathway Involving Both TLR-2 and STING/IFNAR Signaling and Requiring Bacterial Phagocytosis

Caio C B Bomfim et al. Front Cell Infect Microbiol. .

Abstract

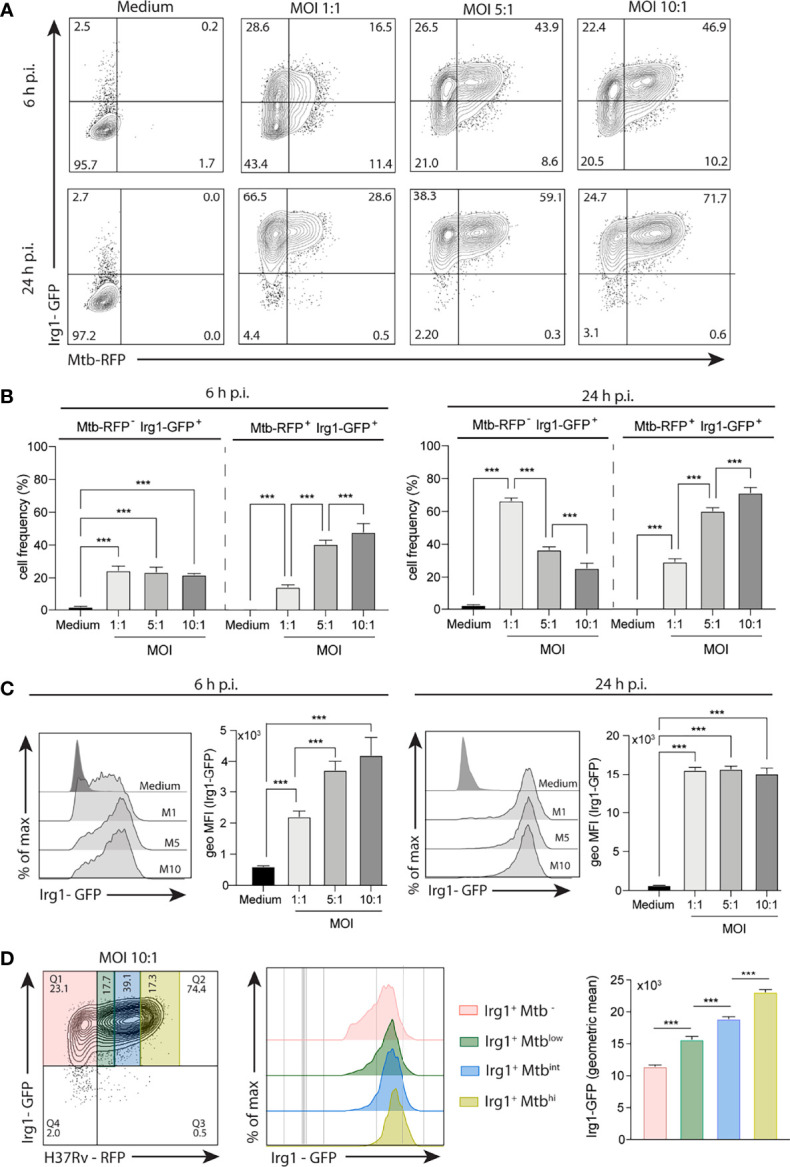
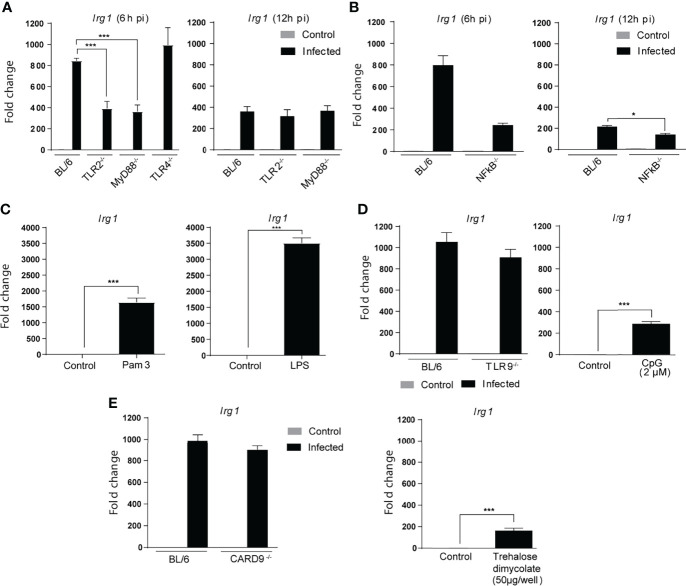
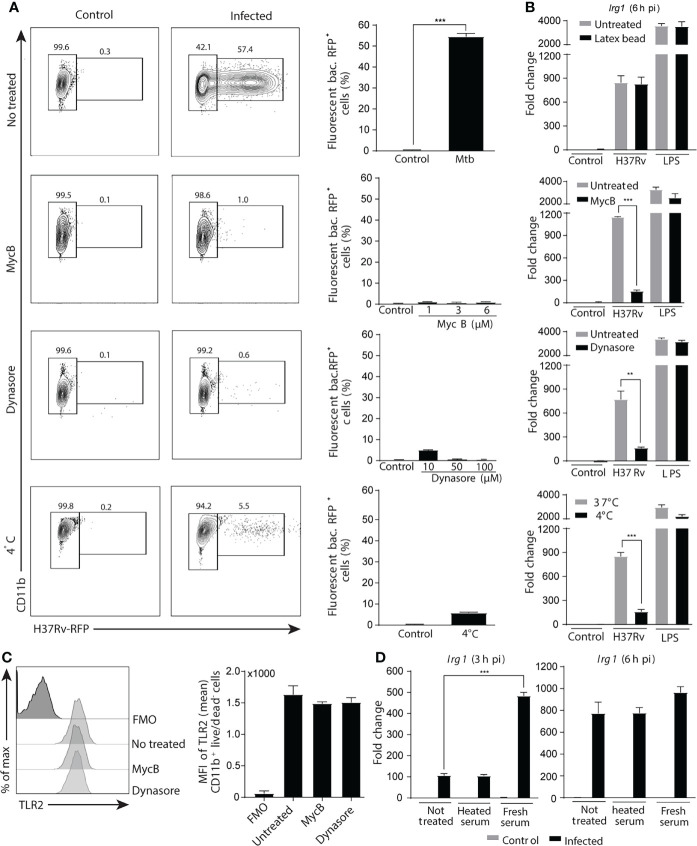
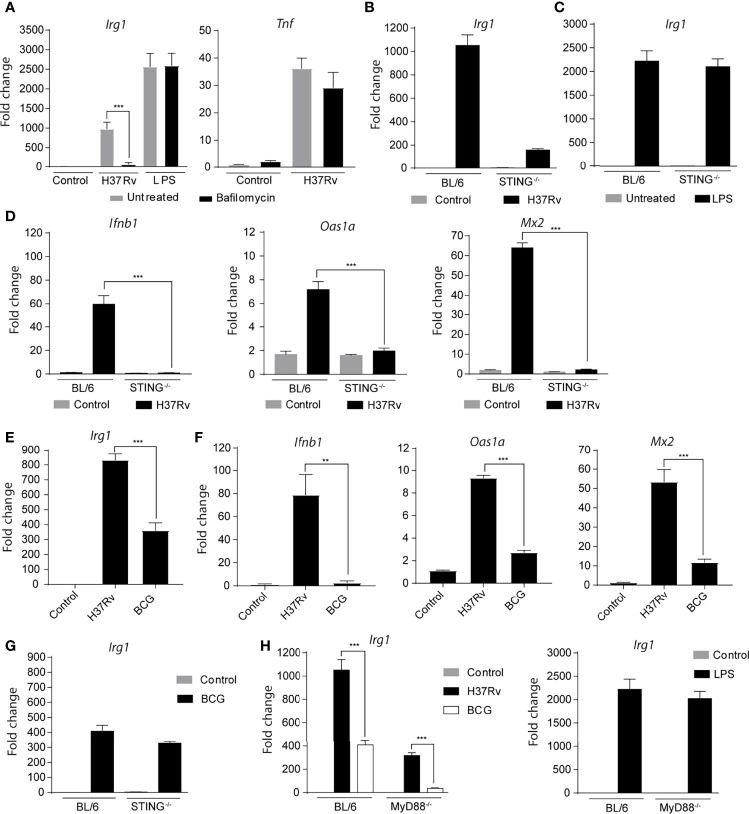
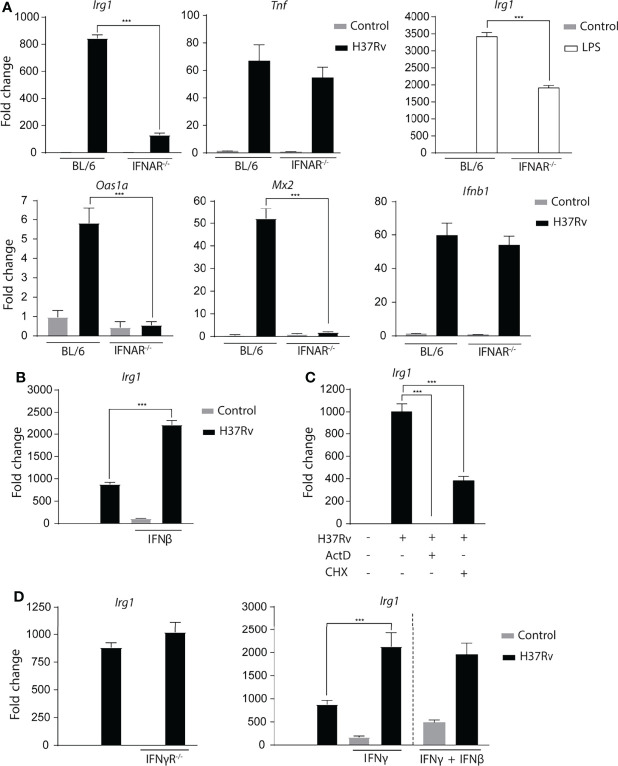
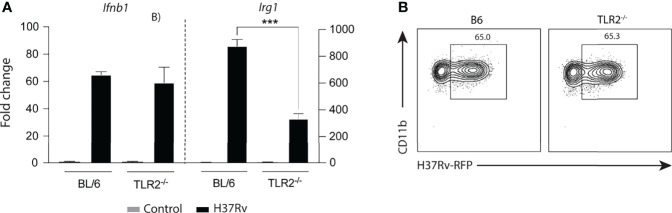
Irg1 is an enzyme that generates itaconate, a metabolite that plays a key role in the regulation of inflammatory responses. Previous studies have implicated Irg1 as an important mediator in preventing excessive inflammation and tissue damage in Mycobacterium tuberculosis (Mtb) infection. Here, we investigated the pattern recognition receptors and signaling pathways by which Mtb triggers Irg1 gene expression by comparing the responses of control and genetically deficient BMDMs. Using this approach, we demonstrated partial roles for TLR-2 (but not TLR-4 or -9), MyD88 and NFκB signaling in Irg1 induction by Mtb bacilli. In addition, drug inhibition studies revealed major requirements for phagocytosis and endosomal acidification in Irg1 expression triggered by Mtb but not LPS or PAM3CSK4. Importantly, the Mtb-induced Irg1 response was highly dependent on the presence of the bacterial ESX-1 secretion system, as well as host STING and Type I IFN receptor (IFNAR) signaling with Type II IFN (IFN-γ) signaling playing only a minimal role. Based on these findings we hypothesize that Mtb induces Irg1 expression in macrophages via the combination of two independent triggers both dependent on bacterial phagocytosis: 1) a major signal stimulated by phagocytized Mtb products released by an ESX-1-dependent mechanism into the cytosol where they activate the STING pathway leading to Type I-IFN production, and 2) a secondary TLR-2, MyD88 and NFκB dependent signal that enhances Irg1 production independently of Type I IFN induction.

Keywords: ESAT-6; ESX-1 system; IFN; Irg1; Mycobacterium tuberculosis; STING; TLR-2; macrophages.


Conflict of interest statement

The authors declare that the research was conducted in the absence of any commercial or financial relationships that could be construed as a potential conflict of interest.

Figures

Figure 1
Figure 1
Mtb induces Irg1 protein expression in macrophages. BMDMs obtained from transgenic mice expressing Irg1-GFP protein (Irg1-GFP+) were infected with H37Rv-RFP at different MOI (1:1; 5:1; 10:1) as indicated. (A, B) Mtb-induced Irg1-GFP expression was evaluated by flow cytometry at 6 h and 24 h p.i. (A) Sample FACS plots and (B) frequency of macrophages expressing Irg1-GFP are shown. (C) Histogram FACS plot and geometric MFI of Irg1-GFP was evaluated by flow cytometry at 6 h (left) and 24 h (right) p.i. (D) FACS plot and histogram of Irg1-GFP expression in cells displaying low, intermediate and high MFI of RFP. Statistical significance was assessed by one-way ANOVA analysis for the indicated experimental condition (***p < 0.001). The data shown are from a representative experiment of two performed.
Figure 2
Figure 2
Mtb induced Irg1 expression is partially dependent on TLR-2/MyD88/NFκB signaling. (A, B) Irg1 mRNA expression was assessed in C57BL/6, TLR-2-/-, MyD88-/- and TLR-4-/- and NFkB-p50-/- BMDM cultures following H37Rv infection at 6 h and 12 h p.i. (C) Irg1mRNA levels were evaluated in C57BL/6 BMDMs at 6 h following Pam3CSK4 (10 ng/ml) or LPS (10 ng/ml) stimulation. (D, E) Irg1 mRNA expression was assessed in BMDMs from (D) C57BL/6, TLR-9-/- and (E) CARD9-/- mice infected with H37Rv strain (MOI of 1) at 6 h p.i. C57BL/6 BMDMs were stimulated with (D) CpG (2 µM) or (E) trehalose dimycolate (50 µg/well) and Irg1 expression evaluated at 6 h after stimulation. As a control both CpG and trehalose dimycolate were shown to induce significant TNF-α responses when tested under the same conditions (data not shown). Significant differences are indicated as follows: *p<0.05, and ***p < 0.001. Results are representative of at least two separate experiments performed.
Figure 3
Figure 3
Phagocytosis of Mtb is crucial for the induction of Irg1 gene expression. (A–C) Macrophages were pretreated with the phagocytosis inhibitors Mycalolide B (MycB; 1 µM, 3 µM or 6 µM) or Dynasore (10 µM, 50 µM or 100 µM) for 1 h and then infected with H37Rv-RFP or stimulated with LPS (10 ng/ml) as indicated. (A) Phagocytosis was determined by flow cytometric analysis at 6 h after H37Rv-RFP Mtb exposure (MOI of 1). FACS plot (left panel) and summary data (right planel) are shown. (B) Irg1 expression was evaluated in BL/6 BMDMs exposed to latex beads (0.025%) (upper graph) or to H37Rv treated or not with MycB and Dynasore as well as in cultures left at 4 0C. (C) TLR-2 protein expression by Mtb-infected macrophages following MycB and Dynasore treatment assessed by flow cytometry. (D) Irg1 mRNA levels were determined in BMDMs exposed to H37Rv opsonized or not with fresh or heat-inactivated naïve mouse sera at 3 h and 6 h p.i. Statistically significant differences are indicated as follows: **p < 0.01 and ***p < 0.001. Data are representative of two separate experiments.
Figure 4
Figure 4
Cytosolic sensing of Mtb is a second major signal required for Irg1 gene expression. (A) Expression of Irg1 and Tnfa at mRNA levels was evaluated in C57BL/6 BMDMs treated or not with bafilomycin (1 µM) and infected with H37Rv (MOI of 1) for 6 h. LPS stimulation (10 ng/ml) was used as a positive control for Irg1 and TNF-α induction in BMDM cultures. (B, C) Irg1 gene expression in STING-/- and C57BL/6 BMDMs at 6 h p.i. with H37Rv or stimulated with LPS (10 ng/ml). (D) Ifnb1, Oas1a and Mx2 mRNA expression was assessed in STING-/- and C57BL/6 BMDM cultures infected with H37Rv (MOI of 1) at 6 h p.i. (E, F) mRNA levels of Irg1, Ifnb1, Oas1a and Mx2 were determined in C57BL/6 macrophages infected with H37Rv or BCG at 6 h p.i. (G) Irg1 mRNA expression was measured in BCG-infected STING-/- and C57BL/6 macrophage cultures at 6 h p.i. (H) Expression of Irg1 was determined in MyD88-/- and C57BL/6 BMDMs infected with H37Rv or BCG strains at MOI of 1, or stimulated with LPS (10 ng/ml) at 6 h p.i. or stimulation. Statistical significance was assessed by one-way ANOVA analysis for the indicated experimental condition (**p < 0.01 and ***p < 0.001). The data are representative of at least two separate experiments performed.
Figure 5
Figure 5
Mtb-induced Type I interferon signaling plays a major role in Irg1 expression. (A) mRNA levels of Irg1, Tnf, Ifnb1, Oas1a and Mx2 were measured in IFNAR-/- and C57BL/6 BMDMs at 6 h following H37Rv Mtb infection or LPS stimulation (10 ng/ml). (B) Irg1 mRNA expression was assessed in C57BL/6 BMDMs treated or not with recombinant IFN-β (10 ng/ml). (C) mRNA levels of Irg1 were evaluated in C57BL/6 BMDMs pretreated with actinomycin D (ActD) (1 µg/ml) or cycloheximide (CHX) (10 µg/ml) for 2 h and then infected with H37Rv Mtb for 6 h. (D) Irg1 mRNA expression was assessed in Mtb-infected IFNγR-/- and C57BL/6 macrophage cultures in the presence of recombinant IFNγ (10U/ml) and/or IFNβ (10 ng/ml) at 6 h p.i. Significant differences are indicated with asterisks (***p < 0.001). The data shown are representative of two separate experiments performed.
Figure 6
Figure 6
Mtb induced expression of Ifnb1 as well as macrophage bacterial uptake are TLR-2 independent processes. (A) Ifnb1 and Irg1 mRNA levels were assessed in TLR-2-/- and C57BL/6 BMDM cultures infected with H37Rv (MOI of 1) at 6 h p.i. (B) Internalization of H37Rv-RFP in TLR-2-/- and C57BL/6 macrophages was measured by flow cytometry at 6 h p.i. Significant differences are indicated with asterisks (***p < 0.001). Results shown are representative of two independent experiments performed.

References

    1. Amaral E. P., Costa D. L., Namasivayam S., Riteau N., Kamenyeva O., Mittereder L., et al. . (2019). A Major Role for Ferroptosis in Mycobacterium tuberculosis-Induced Cell Death and Tissue Necrosis. J. Exp. Med. 216 (3), 556–570. doi: 10.1084/jem.20181776 - DOI - PMC - PubMed
    1. Bambouskova M., Gorvel L., Lampropoulou V., Sergushichev A., Loginicheva E., Johnson K., et al. . (2018). Electrophilic Properties of Itaconate and Derivatives Regulate the IkappaBzeta-ATF3 Inflammatory Axis. Nature 556 (7702), 501–504. doi: 10.1038/s41586-018-0052-z - DOI - PMC - PubMed
    1. Basu S., Fowler B. J., Kerur N., Arnvig K. B., Rao N. A. (2018). NLRP3 Inflammasome Activation by Mycobacterial ESAT-6 and dsRNA in Intraocular Tuberculosis. Microb. Pathog. 114, 219–224. doi: 10.1016/j.micpath.2017.11.044 - DOI - PubMed
    1. Bell L. C. K., Noursadeghi M. (2018). Pathogenesis of HIV-1 and Mycobacterium tuberculosis Co-Infection. Nat. Rev. Microbiol. 16 (2), 80–90. doi: 10.1038/nrmicro.2017.128 - DOI - PubMed
    1. Brodin P., Majlessi L., Marsollier L., de Jonge M. I., Bottai D., Demangel C., et al. . (2006). Dissection of ESAT-6 System 1 of Mycobacterium tuberculosis and Impact on Immunogenicity and Virulence. Infect. Immun. 74 (1), 88–98. doi: 10.1128/iai.74.1.88-98.2006 - DOI - PMC - PubMed

Publication types

MeSH terms