. 2022 May 2:10:888750.
doi: 10.3389/fchem.2022.888750. eCollection 2022.

Understanding of Crucial Factors for Improving the Energy Density of Lithium-Sulfur Pouch Cells

Affiliations

Understanding of Crucial Factors for Improving the Energy Density of Lithium-Sulfur Pouch Cells

Olatz Leonet et al. Front Chem. .

Abstract

Rechargeable lithium-sulfur (Li-S) batteries are the most promising next-generation energy storage system owing to their high energy density and low cost. Despite the increasing number of publications on the Li-S technology, the number of studies on real prototype cells is rather low. Furthermore, novel concepts developed using small lab cells cannot simply be transferred to high-energy cell prototypes due to the fundamental differences. The electrolyte and lithium anode excess used in small lab cells is known to have a huge impact on the cycle life, capacity, and rate capability of the Li-S system. This work analyses the performance of pouch cell prototypes demonstrating the potential and hurdles of the technology. The impact of electrolyte variations and the sulfur cathode loading are studied. The energy density of Li-S pouch cell is improved up to 436 Wh kg-1 by a combination of different approaches related to cell manufacturing, sulfur cathode optimization, and electrolyte amount adjustment.

Keywords: cell balancing; electrolyte volume; high energy density; lithium-sulfur battery; pouch cell performance; sulfur loading density.


Conflict of interest statement

The authors declare that the research was conducted in the absence of any commercial or financial relationships that could be construed as a potential conflict of interest.

Figures

FIGURE 1
FIGURE 1
Publication trend (from 2011 to 2021) of Li-S research reported in the literature. Data were obtained from the Web of Science in December 2021. NOTE: Literature survey was performed according to each defined topic. Since most publications cover several given subjects, the real amount of total publications per year, concerning Li-S batteries as a whole topic, might slightly vary from the data reported for each year in this figure.
FIGURE 2
FIGURE 2
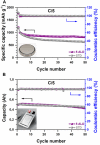
Electrochemical performance of rechargeable standard (STD) and FBR-ALD coated (5 ALD) sulfur cathodes in Li-S batteries was measured at 25°C. Galvanostatic long cycling performance at C/10 in (A) coin cell and (B) pouch cell format.
FIGURE 3
FIGURE 3
Design parameters of the fabricated Li-S pouch cells.
FIGURE 4
FIGURE 4
Electrochemical performance of Li-S pouch-cells with different ASL (2.0, 4.0, and 5.3 mgs cm−2) and at different E/C ratios (3.0 and 3.5 µl mAh−1) at a current density of C/20. Galvanostatic charge/discharge profiles of Li-S batteries with (A) 3.5 µl mAh−1 and (B) 3.0 µl mAh−1. (C) Capacity and specific capacity per sulfur mass (mAh gs −1g−1 sulfur .) and (D) energy density and corresponding energy density improvement of Li-S pouch-cells (reference case: low ASL = 2.0 mgs cm−2 and E/C ratio = 3.5 µl mAh−1).
FIGURE 5
FIGURE 5
Mass distribution and corresponding energy density of fabricated Li-S pouch cells with (A) E/C ratio = 3.5 µl mAh−1 and (B) E/C ratio = 3.0 µl mAh−1. More detailed information can be found in Supplementary Tables S1, S2 of Supporting Information.
FIGURE 6
FIGURE 6
Discharge C-rate performance of Li-S pouch-cells with different ASL (2.0, 4.0, and 5.3 mgs cm−2): Specific energy densities of cells with (A) E/C 3.5 µl mAh−1 and (B) E/C 3.0 µl mAh−1. Discharge energy retention versus current density of cells with (C) E/C 3.5 µl mAh−1 (D) and E/C 3.0 µl mAh−1. NOTE: Tabs and packaging were excluded from the specific energy calculations.
FIGURE 7
FIGURE 7
(A) Galvanostatic long cycling performance and (B) Coulombic efficiency of Li-S batteries with different ASL (2.0, 4.0, and 5.3 mgs cm−2) and different E/C ratios (3.0 and 3.5 µl mAh−1).

References

    1. Abraham K. M. (2012). Rechargeable Batteries for the 300-Mile Electric Vehicle and beyond. ECS Trans. 41, 27–34. 10.1149/1.3702853 - DOI
    1. Azaceta E., García S., Leonet O., Beltrán M., Gómez I., Chuvilin A., et al. (2020). Particle Atomic Layer Deposition as an Effective Way to Enhance Li-S Battery Energy Density. Mater. Today Energ. 18, 100567. 10.1016/j.mtener.2020.100567 - DOI
    1. Borchardt L., Oschatz M., Kaskel S. (2016). Carbon Materials for Lithium Sulfur Batteries-Ten Critical Questions. Chem. Eur. J. 22, 7324–7351. 10.1002/chem.201600040 - DOI - PubMed
    1. Chabu J. M., Zeng K., Walle M. D., You X., Zhang M., Li Y., et al. (2017). Facile Fabrication of Sulfur/Graphene Composite for High-Rate Lithium-Sulfur Batteries. ChemistrySelect 2, 11035–11039. 10.1002/slct.201702336 - DOI
    1. Chen J., Henderson W. A., Pan H., Perdue B. R., Cao R., Hu J. Z., et al. (2017a). Improving Lithium-Sulfur Battery Performance under Lean Electrolyte through Nanoscale Confinement in Soft Swellable Gels. Nano Lett. 17, 3061–3067. 10.1021/acs.nanolett.7b00417 - DOI - PubMed