

Abnormal Dynamic Functional Networks in Subjective Cognitive Decline and Alzheimer's Disease
- PMID: 35586480
- PMCID: PMC9108158
- DOI: 10.3389/fncom.2022.885126
Abnormal Dynamic Functional Networks in Subjective Cognitive Decline and Alzheimer's Disease
Abstract
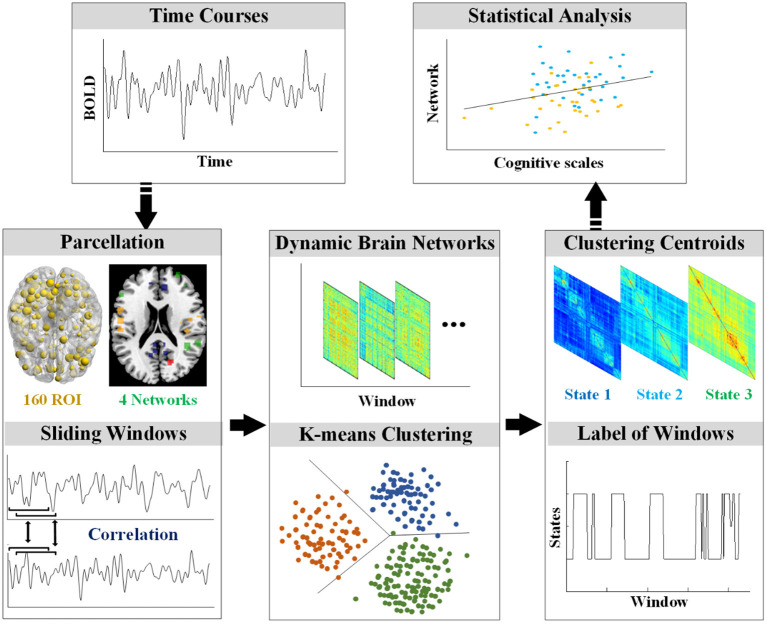
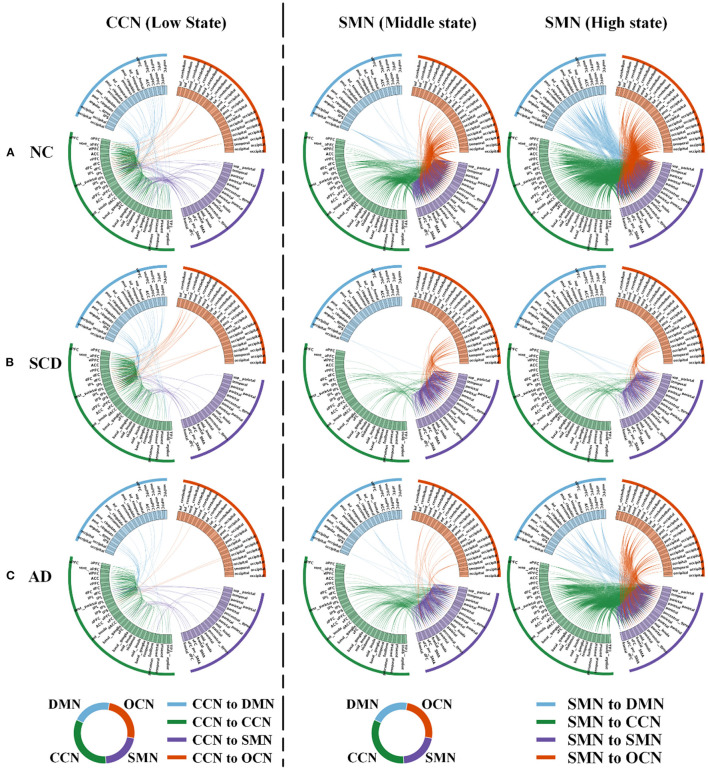
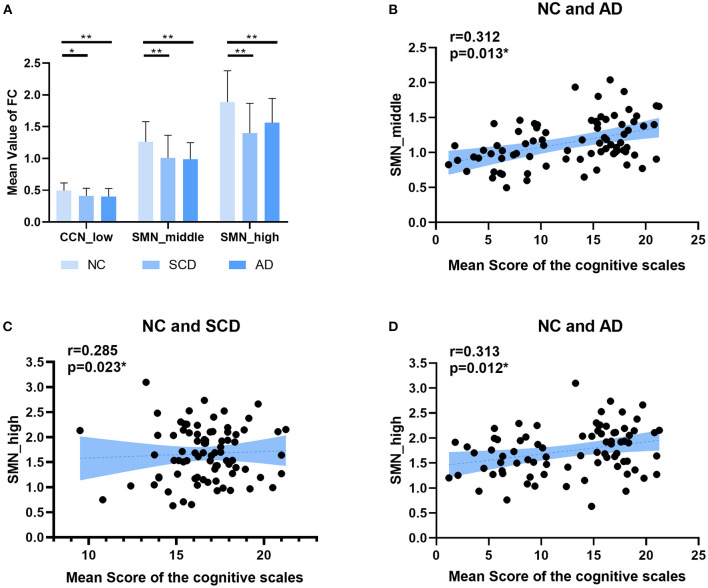
Subjective cognitive decline (SCD) is considered to be the preclinical stage of Alzheimer's disease (AD) and has the potential for the early diagnosis and intervention of AD. It was implicated that CSF-tau, which increases very early in the disease process in AD, has a high sensitivity and specificity to differentiate AD from normal aging, and the highly connected brain regions behaved more tau burden in patients with AD. Thus, a highly connected state measured by dynamic functional connectivity may serve as the early changes of AD. In this study, forty-five normal controls (NC), thirty-six individuals with SCD, and thirty-five patients with AD were enrolled to obtain the resting-state functional magnetic resonance imaging scanning. Sliding windows, Pearson correlation, and clustering analysis were combined to investigate the different levels of information transformation states. Three states, namely, the low state, the middle state, and the high state, were characterized based on the strength of functional connectivity between each pair of brain regions. For the global dynamic functional connectivity analysis, statistically significant differences were found among groups in the three states, and the functional connectivity in the middle state was positively correlated with cognitive scales. Furthermore, the whole brain was parcellated into four networks, namely, default mode network (DMN), cognitive control network (CCN), sensorimotor network (SMN), and occipital-cerebellum network (OCN). For the local network analysis, statistically significant differences in CCN for low state and SMN for middle state and high state were found in normal controls and patients with AD. Meanwhile, the differences were also found in normal controls and individuals with SCD. In addition, the functional connectivity in SMN for high state was positively correlated with cognitive scales. Converging results showed the changes in dynamic functional states in individuals with SCD and patients with AD. In addition, the changes were mainly in the high strength of the functional connectivity state.
Keywords: Alzheimer's disease; clustering analysis; dynamic functional connectivity; resting-state fMRI; sensorimotor network; subjective cognitive decline.
Copyright © 2022 Wang, Wang, Liu, Wang, Suo, Xie, Funahashi, Wu and Pei.
Conflict of interest statement
The authors declare that the research was conducted in the absence of any commercial or financial relationships that could be construed as a potential conflict of interest. The reviewer BW declared a past co-authorship with the author LW.
Figures


References
-
- Alderson T. H., Bokde A. L. W., Kelso J. A. S., Maguire L., Coyle D., Alzheimer's Disease Neuroimaging Initiative . (2018). Metastable neural dynamics in Alzheimer's disease are disrupted by lesions to the structural connectome. Neuroimage 183, 438–455. 10.1016/j.neuroimage.2018.08.033 - DOI - PMC - PubMed
-
- Arthur D., Vassilvitskii S. (2007). k-means++: The advantages of careful seeding, in Proceedings of the eighteenth annual ACM-SIAM symposium on Discrete algorithms. New Orleans, Louisiana: Society for Industrial and Applied Mathematics, 1027–1035.
LinkOut - more resources
Full Text Sources