. 2022 Apr 28:12:880740.
doi: 10.3389/fonc.2022.880740. eCollection 2022.

A Combined Effect of G-Quadruplex and Neuro-Inducers as an Alternative Approach to Human Glioblastoma Therapy

Affiliations

A Combined Effect of G-Quadruplex and Neuro-Inducers as an Alternative Approach to Human Glioblastoma Therapy

Galina Pavlova et al. Front Oncol. .

Abstract

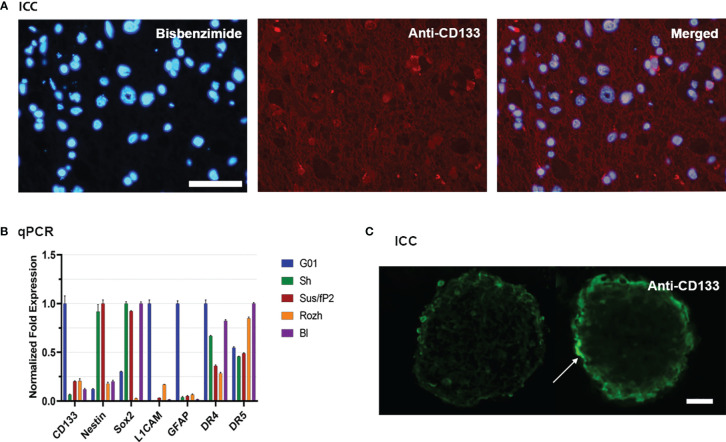
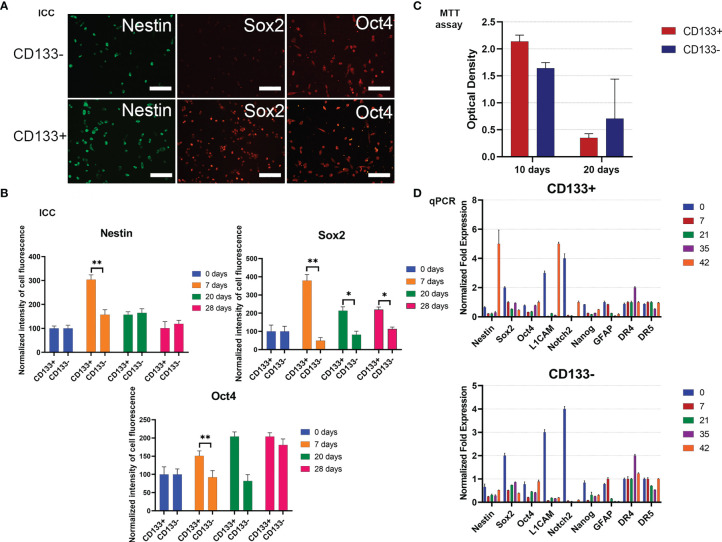
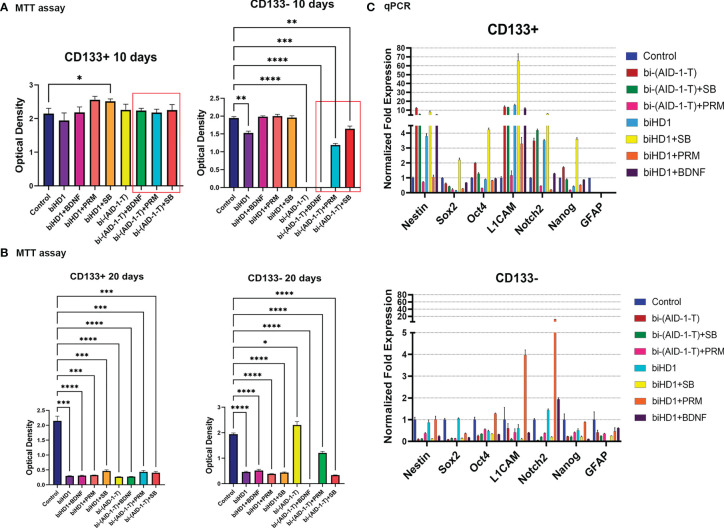
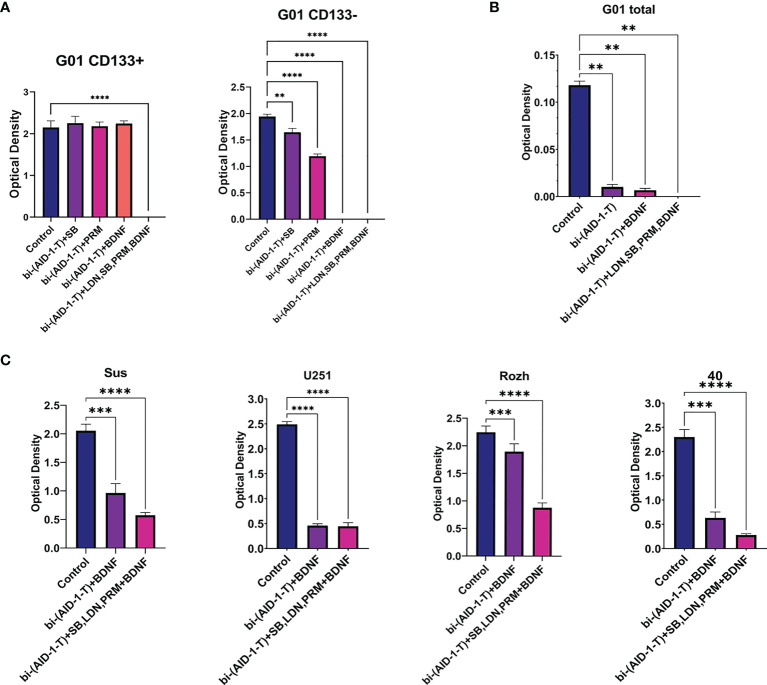
Cancer cell reprogramming based on treatment with G-quadruplex, having antiproliferative power, along with small molecules able to develop iPSCs into neurons, could create a novel approach to diminish the chance of glioblastoma recurrence and circumvent tumor resistance to conventional therapy. In this research, we have tested several combinations of factors to affect both total cell cultures, derived from tumor tissue of patients after surgical resection and two subfractions of this cell culture after dividing them into CD133-enriched and CD133-depleted populations (assuming CD133 to be a marker of glioblastoma stem-like cells). CD133+ and CD133- cells exhibit different responses to the same combinations of factors; CD133+ cells have stem-like properties and are more resistant. Therefore, the ability to affect CD133+ cells provides a possibility to circumvent resistance to conventional therapy and to build a promising strategy for translation to improve the treatment of patients with glioblastoma.

Keywords: CD133; aptamers; cancer stem cells; cell reprogramming; glioblastoma multiforme.


Conflict of interest statement

The authors declare that the research was conducted in the absence of any commercial or financial relationships that could be construed as a potential conflict of interest.

Figures

Figure 1
Figure 1
Characterization of glioblastoma cell culture with CD133 high expression rate. (A) Bisbenzimide staining of cell nuclei of the biopsy samples of the patient (left); immunocytochemical staining with anti-CD133 antibodies (middle); a and b merged (right); scale bar is 50 μm. (B) Real-time quantitative PCR. The expression of the genes of the neural stem cells in tested cell cultures. Data are represented as mean ± SEM; n = 3 for each group. (C) Immunocytochemical staining of the neuro-spheres with anti-CD133 antibodies. CD133+ cells (arrow) are located in the outer layer of the neuro-spheres; scale bar is 20 μm.
Figure 2
Figure 2
A scheme of CD133 protein structure. Insertion shows numbers of amino acids for CD133CT. The number of glycosylation sites is indicated schematically.
Figure 3
Figure 3
Confocal visualization of CD133 distribution on the cell membrane of G01 glioblastoma cells using СD133fr/peGFP-c1 recombinant DNA. (A) Micrographs of fixed glioblastoma cell culture cells stained with anti-CD133 antibodies (dilution 1:25) and anti-GFP antibodies (FITC) (dilution 1:200). GFP (green), CD133 (red), DAPI (blue). (B) Micrographs of the distribution of microbeads in glioblastoma cell culture transfected with реCD133fr/peGFP-c1. The arrows indicate magnetic beads. Scale bar is 20 mm.
Figure 4
Figure 4
Characterization of G01 CD133+ and G01 CD133 cell cultures after cell separation. (A) Micrographs of immunocytochemical staining of G01 CD133+ and G01 CD133 cell cultures with anti-Nestin, anti-Sox2, anti-Oct4 antibodies. Scale bar is 200 μm. (B) The diagrams represent the normalized intensity of cell fluorescence of G01 CD133+ and CD133 cell cultures. Data are represented as mean ± SD, n = 20 for each group. Statistically significant differences between the control and the treatment groups are indicated by asterisks (Mann–Whitney U-test, **p <0.01, *p <0.05). (C) MTT assay of G01 CD133+ and G01 CD133 glioblastoma cell cultures in 10 and 20 days after cell separation; data are presented as mean ± SD; n = 5 for each group. Data are presented as mean ± SD. (D) Real-time quantitative PCR of stem cell genes in G01 CD133 (left) and G01 CD133+ (right) cells before and at 7, 21, 35, and 42 days after cell separation. Data are presented as mean ± SEM; n = 3 for each group.
Figure 5
Figure 5
G01 CD133+ and CD133 cells behavior after treatment of binary combination of GQ and a neuro-inducer. (A) MTT assay of G01 CD133+ cells (left) and G01 CD133 cells (right) after 10 days treatment with combination of either biHD1 or bi-(AID-1-T) and neural differentiation inducers SB431542, purmorphamine, BDNF. Data are represented as mean ± SD, n = 5 for each group. Statistically significant differences between the control and the treatment groups are indicated by asterisks (One-Way ANOVA, post-hoc Tukey HSD Test, *p <0.05, **p <0.01, ***p <0.001, ****p <0.0001). (B) MTT assay of G01 CD133+ cells (left) and CD133- cells (right) after 20 days treatment with the same binary combinations as in (A). Data are represented as in (A). (C) Real-time quantitative PCR of stem cell genes in G01 CD133+ (top) and G01 CD133- (bottom) cell cultures in 20 days after the exposure to the aptamers biHD1 and bi-(AID-1-T) and neural differentiation inducers SB431542, purmorphamine, BDNF. Data are represented as mean ± SD. n = 3 for each group. SB, SB431542, PRM, purmorphamine.
Figure 6
Figure 6
Exposure of cell cultures to the bi-(AID-1-T) aptamer and a cascade of neural inducers. (A) MTT assay for G01 CD133+ and G01 CD133 in 10 days after the exposure to the bi-(AID-1-T) aptamer and the neural differentiation inducers. Data are represented as mean ± SD. n = 5 for each group. (B) MTT assay for G01 cells in 10 days after the exposure to the bi-(AID-1-T) aptamer and the successive addition of the neural differentiation inducers. Data are represented as mean ± SD. n = 5 for each group. (C) MTT assay for Sus, U251, Rozh and 40 cell cultures in 10 days after the exposure to the bi-(AID-1-T) aptamer and the neural differentiation inducers. Data are represented as mean ± SD. n = 5 for each group. Statistically significant differences between the control and the treatment groups are indicated by asterisks (One-Way ANOVA, post-hoc Tukey HSD Test, **p <0.01, ***p <0.001, ****p <0.0001). SB, SB431542; PRM, Purmorphamine; LDN, LDN-193189.

Similar articles

Cited by

References

    1. Omuro A, DeAngelis LM. Glioblastoma and Other Malignant Gliomas: A Clinical Review. J Am Med Assoc (2013) 310:1842–50. doi: 10.1001/jama.2013.280319 - DOI - PubMed
    1. Zahreddine H, Borden KLB. Mechanisms and Insights Into Drug Resistance in Cancer. Front Pharmacol (2013) 4. doi: 10.3389/fphar.2013.00028 - DOI - PMC - PubMed
    1. Dawson LE, D’Agostino L, Hakim AA, Lackman RD, Brown SA, Sensenig RB, et al. . Induction of Myogenic Differentiation Improves Chemosensitivity of Chemoresistant Cells in Soft-Tissue Sarcoma Cell Lines. Sarcoma (2020) 2020:1–9. doi: 10.1155/2020/8647981 - DOI - PMC - PubMed
    1. Han H, Shin DY, Kim D, Kim H, Lee C, Koh Y, et al. . Induction of Leukemic Stem Cell Differentiation by Aryl Hydrocarbon Receptor Agonist and Synergy With Gilteritinib in FLT3-ITD + Acute Myeloid Leukemia. Leukemia Lymphoma (2020) 61:1932–42. doi: 10.1080/10428194.2020.1747062 - DOI - PubMed
    1. Eramo A, Ricci-Vitiani L, Zeuner A, Pallini R, Lotti F, Sette G, et al. . Chemotherapy Resistance of Glioblastoma Stem Cells [2]. Cell Death Differ (2006) 13:1238–41. doi: 10.1038/sj.cdd.4401872 - DOI - PubMed