. 2022 May 2:13:882597.
doi: 10.3389/fphys.2022.882597. eCollection 2022.

"Prefrontal" Neuronal Foundations of Visual Asymmetries in Pigeons

Affiliations

"Prefrontal" Neuronal Foundations of Visual Asymmetries in Pigeons

Qian Xiao et al. Front Physiol. .

Abstract

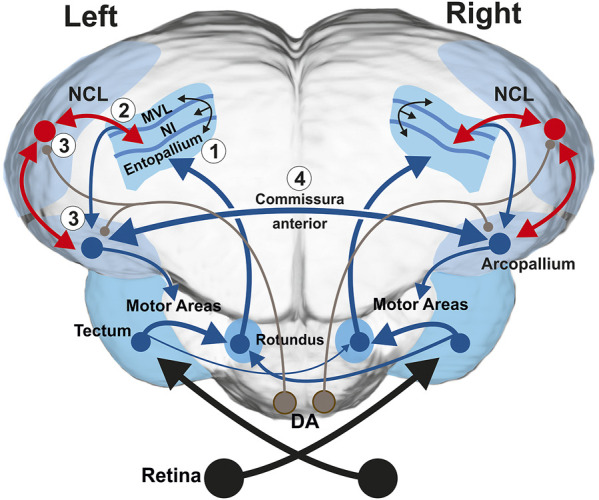
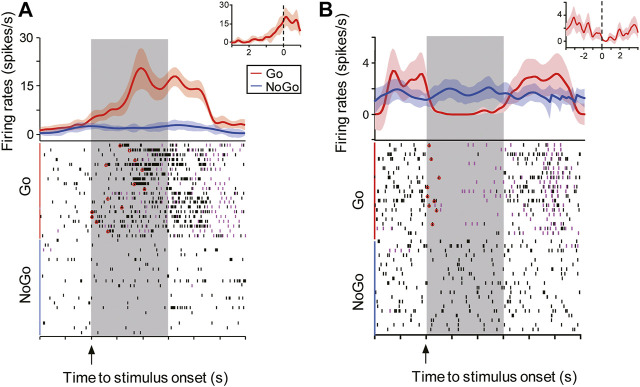
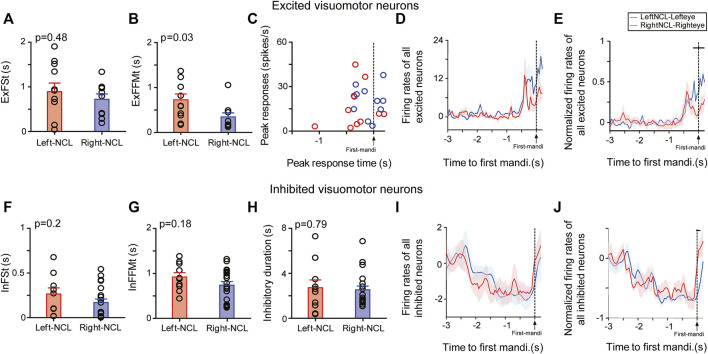
This study was conducted in order to reveal the possibly lateralized processes in the avian nidopallium caudolaterale (NCL), a functional analogue to the mammalian prefrontal cortex, during a color discrimination task. Pigeons are known to be visually lateralized with a superiority of the left hemisphere/right eye for visual feature discriminations. While animals were working on a color discrimination task, we recorded single visuomotor neurons in left and right NCL. As expected, pigeons learned faster and responded more quickly when seeing the stimuli with their right eyes. Our electrophysiological recordings discovered several neuronal properties of NCL neurons that possibly contributed to this behavioral asymmetry. We found that the speed of stimulus encoding was identical between left and right NCL but action generation was different. Here, most left hemispheric NCL neurons reached their peak activities shortly before response execution. In contrast, the majority of right hemispheric neurons lagged behind and came too late to control the response. Thus, the left NCL dominated the animals' behavior not by a higher efficacy of encoding, but by being faster in monopolizing the operant response. A further asymmetry concerned the hemisphere-specific integration of input from the contra- and ipsilateral eye. The left NCL was able to integrate and process visual input from the ipsilateral eye to a higher degree and thus achieved a more bilateral representation of two visual fields. We combine these novel findings with those from previous publications to come up with a working hypothesis that could explain how hemispheric asymmetries for visual feature discrimination in birds are realized by a sequential buildup of lateralized neuronal response properties in the avian forebrain.

Keywords: birds; lateralization; nidopallium caudolaterale; single unit recording; tectofugal system.


Conflict of interest statement

The authors declare that the research was conducted in the absence of any commercial or financial relationships that could be construed as a potential conflict of interest.

Figures

FIGURE 1
FIGURE 1
Schematic frontal depiction of the tectofugal visual system along with the anterior commissure, the projection of the tectofugal system to the prefrontal-like nidopallium caudolaterale (NCL) and the projection of NCL onto the motor arcopallium (A). The subsystems that play key roles for the present study are depicted in red. The tectorotundal axons have a larger number of fibers that cross from right to left, thereby constituting a more bilateral representation of visual information in the left hemisphere. In the current study, we recorded the activity patterns of single NCL neurons. The NCL receives input from the tectofugal system via the nidopallium intermediale (NI) and feedback projections from the arcopallium. In addition, dopaminergic (DA) brainstem projections (depicted in brown color) can modify visuo-associative and visuo-motor connections in experience dependent manner. Numbers 1–4 refer to the four steps of the working hypothesis on lateralized visual discrimination learning and task execution at pallial level in birds. Further abbreviation: mesopallium ventrolaterale (MVL).
FIGURE 2
FIGURE 2
Schematic drawing of the training paradigm. Stimuli were presented to each eye in pseudorandomly interleaved trials with 15 s inter-trial intervals (ITI). Animals were trained to either respond to Go-stimuli (red line) or withhold responses to NoGo-stimuli (blue line) during a 3 s response period after the stimulus onset. Correct responses in Go-trials were rewarded with water at the end of response period and the stimuli were switched off during the reward time. Correct responses (no jaw movements) to NoGo-stimuli were not rewarded, whereas jaw movements during the 3 s response period prolonged stimulus presentation time from 3 s to 9 s. Black vertical bars during the 3 s response period indicate jaw movements of animals (mandibulations).
FIGURE 3
FIGURE 3
Schematic frontal depiction of the electrode positions in the left and right NCL, based on lesions and electrode tracks. Only the lateral 2/3 of the telencephalon of each hemisphere is shown, and omitting the medial 1/3. Abbreviations: AD, arcopallium dorsale; AI, arcopallium intermediale; AM, arcopallium mediale; AV, arcopallium ventral; CDL, area corticoidea dorsolateralis; Cpi, cortex piriformis; NCC, nidopallium caudale pars centralis; NCL, nidopallium caudolaterale; NCVl, nidopallium caudoventrale pars lateralis; N. PoA, posterioris amygdalopallii; StL, striatum laterale; N. TnA, taeniae amygdalae.
FIGURE 4
FIGURE 4
Representative example of an excited and an inhibited visuomotor neuron in the NCL. Animals had 3 s (gray shading) to either respond (magenta ticks: mandibulations) to the Go-stimulus (red line) or refrain from responding to the NoGo-stimulus (blue line). The visuomotor neurons were either excited (A) or inhibited (B) by Go-stimuli (mean ± SEM), but they did not respond to the NoGo-stimuli. The neuronal onset time for each trial was determined by Poisson spike train analyses and are marked with hollow red circles in the raster plots shown in the lower half. After trial-to-trial aligning all spikes of each neuron to the animal’s first mandibulation (zero) during the 3 s response period, these neurons showed preceding excitatory or inhibitory activity before the animal’s first response (insets, mean ± SEM).
FIGURE 5
FIGURE 5
Responses of excited (upper row) and inhibited (lower row) visuomotor neurons to Go-stimuli presented to the contralateral eye. Mean response onset time (± SEM) of excited (A) and inhibited neurons (F) to Go-stimuli. Mean latency (± SEM) between neuronal and behavioral onset of excited (B) and inhibited neurons (G). (C) Peak responses and peak-firing times of excited neurons. Mean firing rates (± SEM) of left and right excited (D) or inhibited visuomotor neurons (I) relative to the first mandibulation of animals. Normalized mean responses (± SEM) of all visuomotor neurons relative to the first mandibulation of animals, in which firing rates of each neuron were normalized to its peak responses of excited neurons (E) or lowest responses of inhibited neurons (J). Horizontal lines indicate time points of significant firing rate differences between left and right NCL excited neurons (p < 0.05). (H) Duration of inhibitory responses of inhibited neurons.
FIGURE 6
FIGURE 6
Discrimination scores (AUROC-value: mean ± SEM) of NCL visuomotor neurons in left (L) or right NCL (R).
FIGURE 7
FIGURE 7
Responses of visuomotor neurons to Go-stimuli presented to the ipsilateral eye. Response characteristics of excited (A–E) and inhibited neurons (F–J) in the NCL to stimuli presented to the ipsilateral eye (ExFSt; InFSt) and their subsequent ability to swiftly activate a motor response (ExFFMt; InFFMt). Mean response onset time (± SEM) of excited (A) and inhibited neurons (F) to Go-stimuli. Mean latency (± SEM) between neuronal and behavioral onset in excited (B) and inhibited neurons (G). (C) Peak activities and peak-firing times of excited neurons in left and right NCL. Mean firing rates (± SEM) of excited (D) and inhibited visuomotor neurons (I) relative to the first response of the animal to ipsilateral stimuli. Normalized mean responses (± SEM) of excited (E) and inhibited visuomotor neurons (J) relative to the first response of the animal. Firing rates of each neuron were normalized to its peak (excited neuron) or lowest response (inhibited neuron). The horizontal lines in E and J indicate the significance level of the comparison of left and right NCL neurons (p < 0.05). (H) Duration of inhibitory responses of inhibited neurons.

Similar articles

Cited by

References

    1. Adam R., Güntürkün O. (2009). When One Hemisphere Takes Control: Metacontrol in Pigeons (Columba livia). PLoS One 4 (4), e5307. 10.1371/journal.pone.0005307 - DOI - PMC - PubMed
    1. Alonso Y. (1998). Lateralization of Visual Guided Behaviour during Feeding in Zebra Finches (Taeniopygia guttata). Behav. Process. 43, 257–263. 10.1016/s0376-6357(98)00015-1 - DOI - PubMed
    1. Azizi A. H., Pusch R., Koenen C., Klatt S., Bröker F., Thiele S., et al. (2019). Emerging Category Representation in the Visual Forebrain Hierarchy of Pigeons (Columba livia). Behav. Brain Res. 356, 423–434. 10.1016/j.bbr.2018.05.014 - DOI - PubMed
    1. Brandler W. M., Paracchini S. (2014). The Genetic Relationship between Handedness and Neurodevelopmental Disorders. Trends Mol. Med. 20, 83–90. 10.1016/j.molmed.2013.10.008 - DOI - PMC - PubMed
    1. Chiesa A. D., Pecchia T., Tommasi L., Vallortigara G. (2006). Multiple Landmarks, the Encoding of Environmental Geometry and the Spatial Logics of a Dual Brain. Anim. Cogn. 9, 281–293. 10.1007/s10071-006-0050-7 - DOI - PubMed