. 2022 Apr 14:12:366-376.
doi: 10.1016/j.ibneur.2022.04.002. eCollection 2022 Jun.

Early mobilization in spinal cord injury promotes changes in microglial dynamics and recovery of motor function

Affiliations

Early mobilization in spinal cord injury promotes changes in microglial dynamics and recovery of motor function

Kohta Asano et al. IBRO Neurosci Rep. .

Abstract

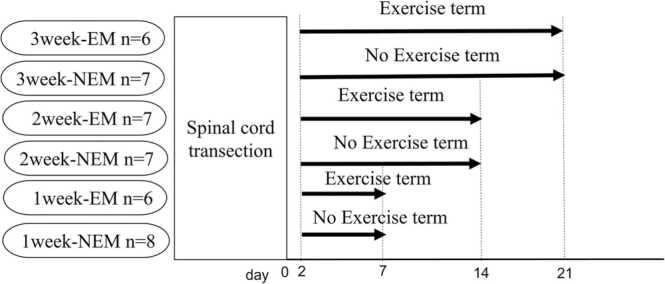
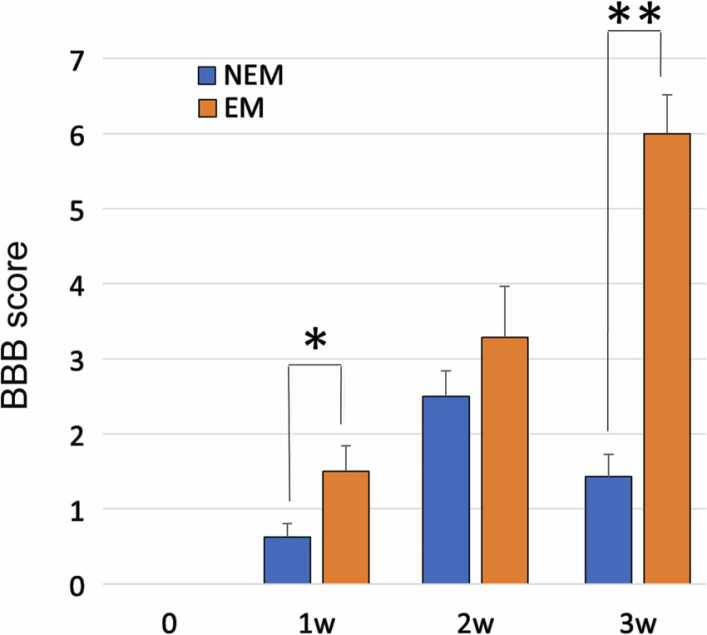
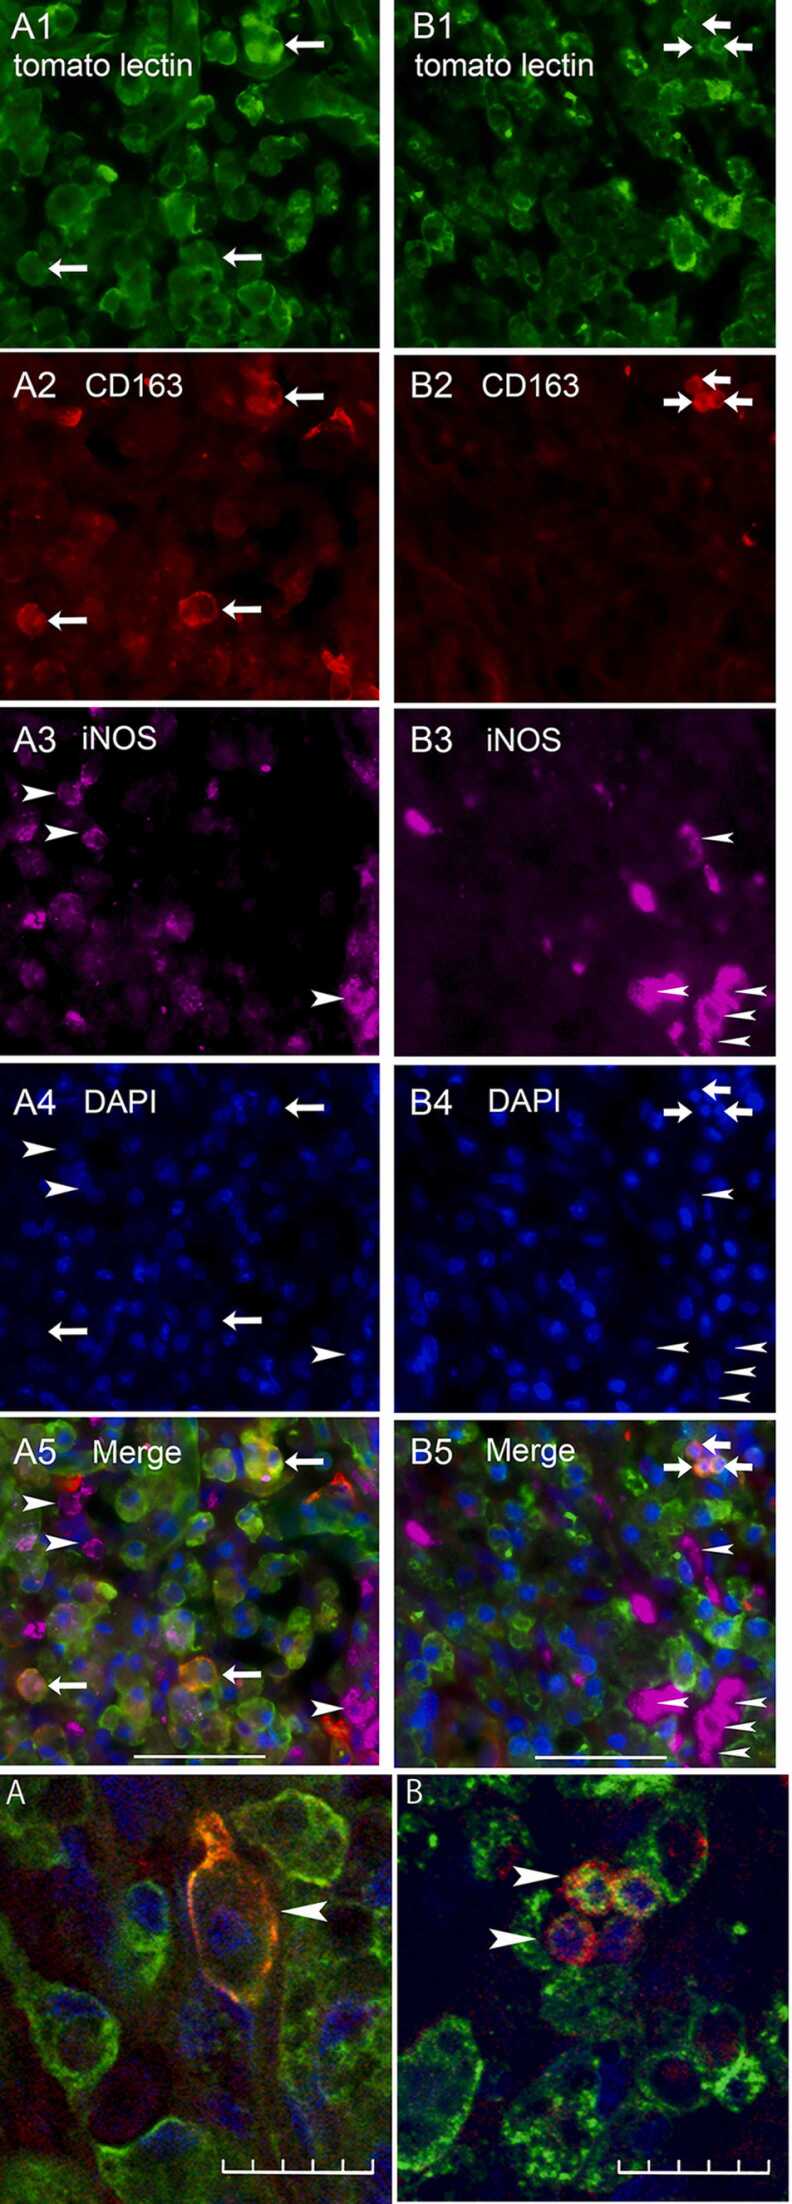
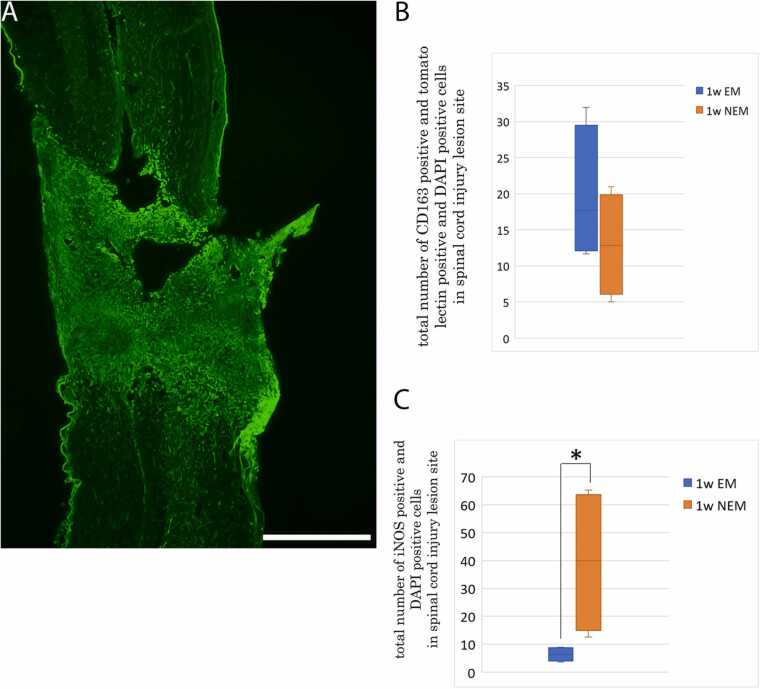
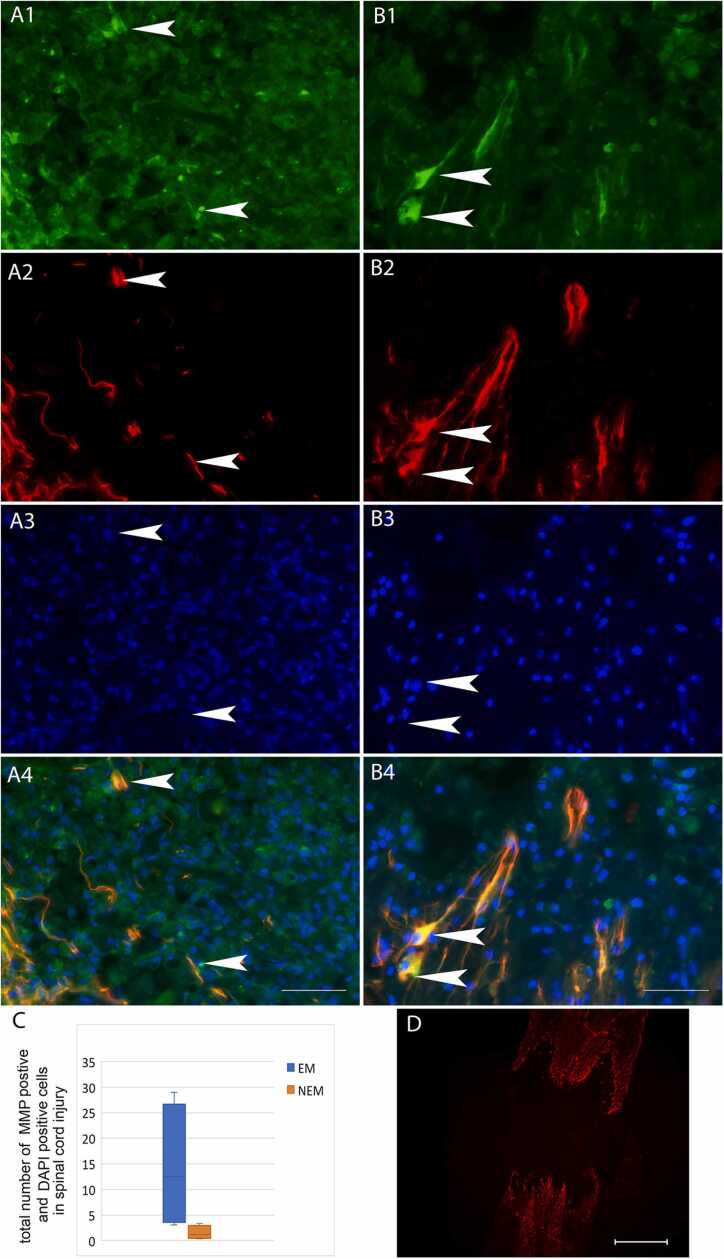
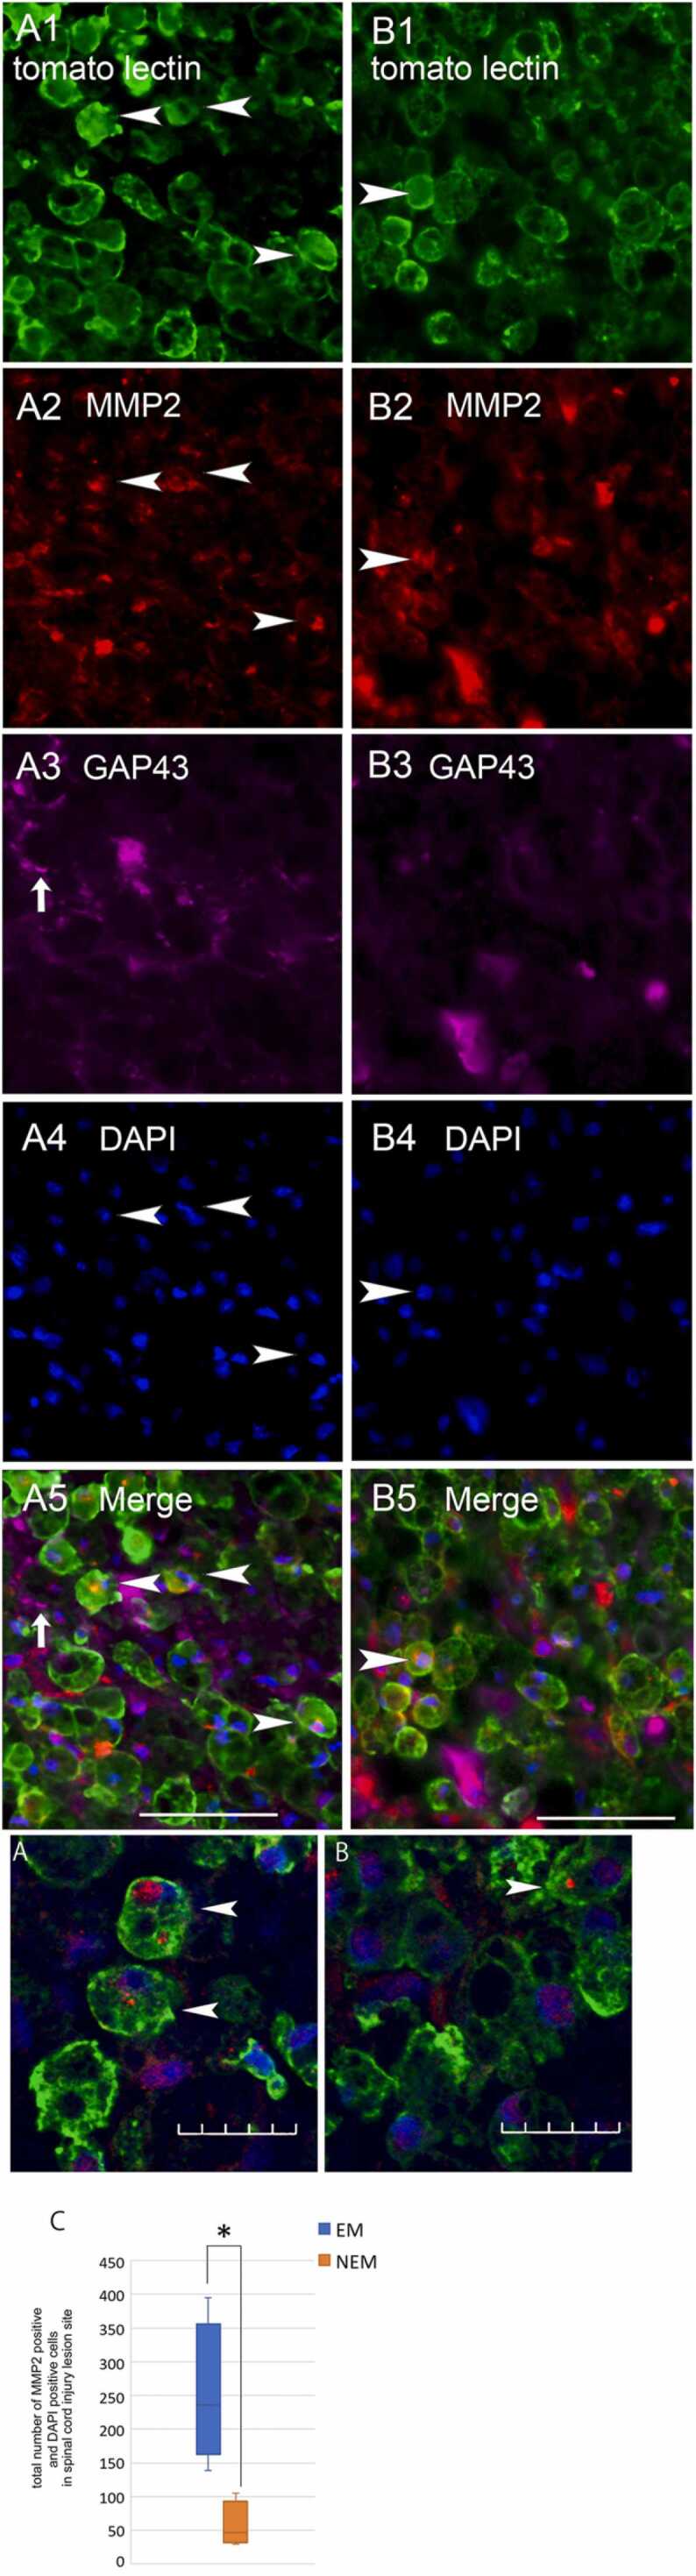
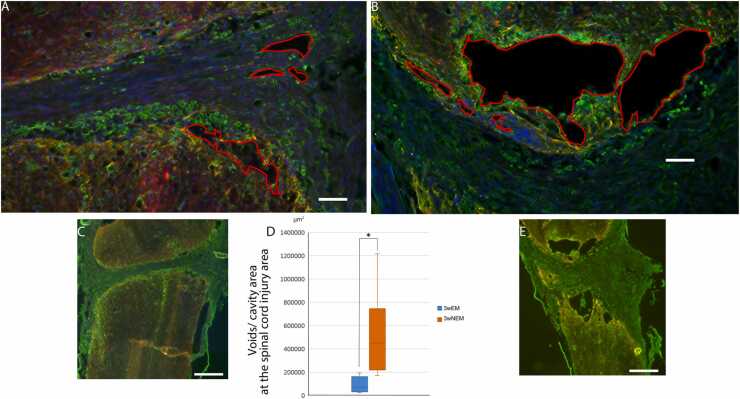
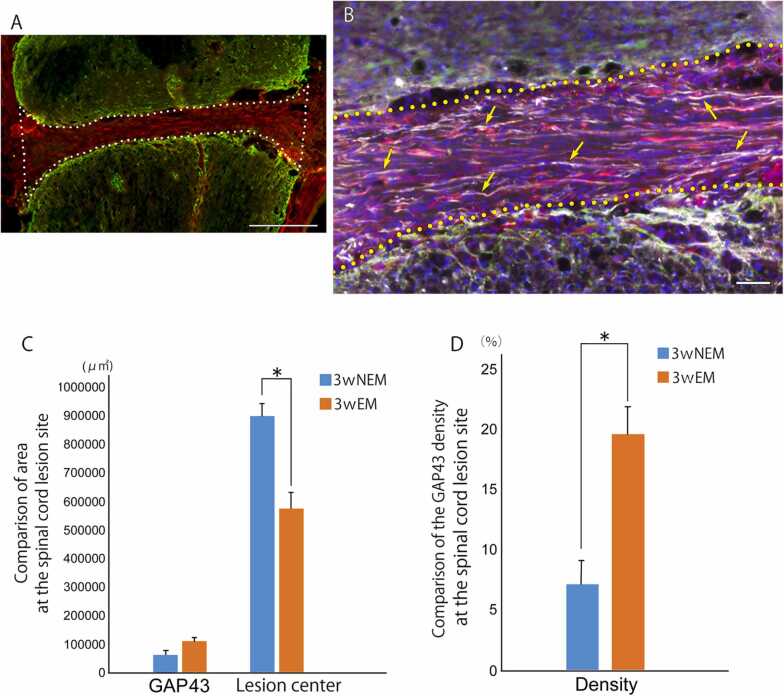
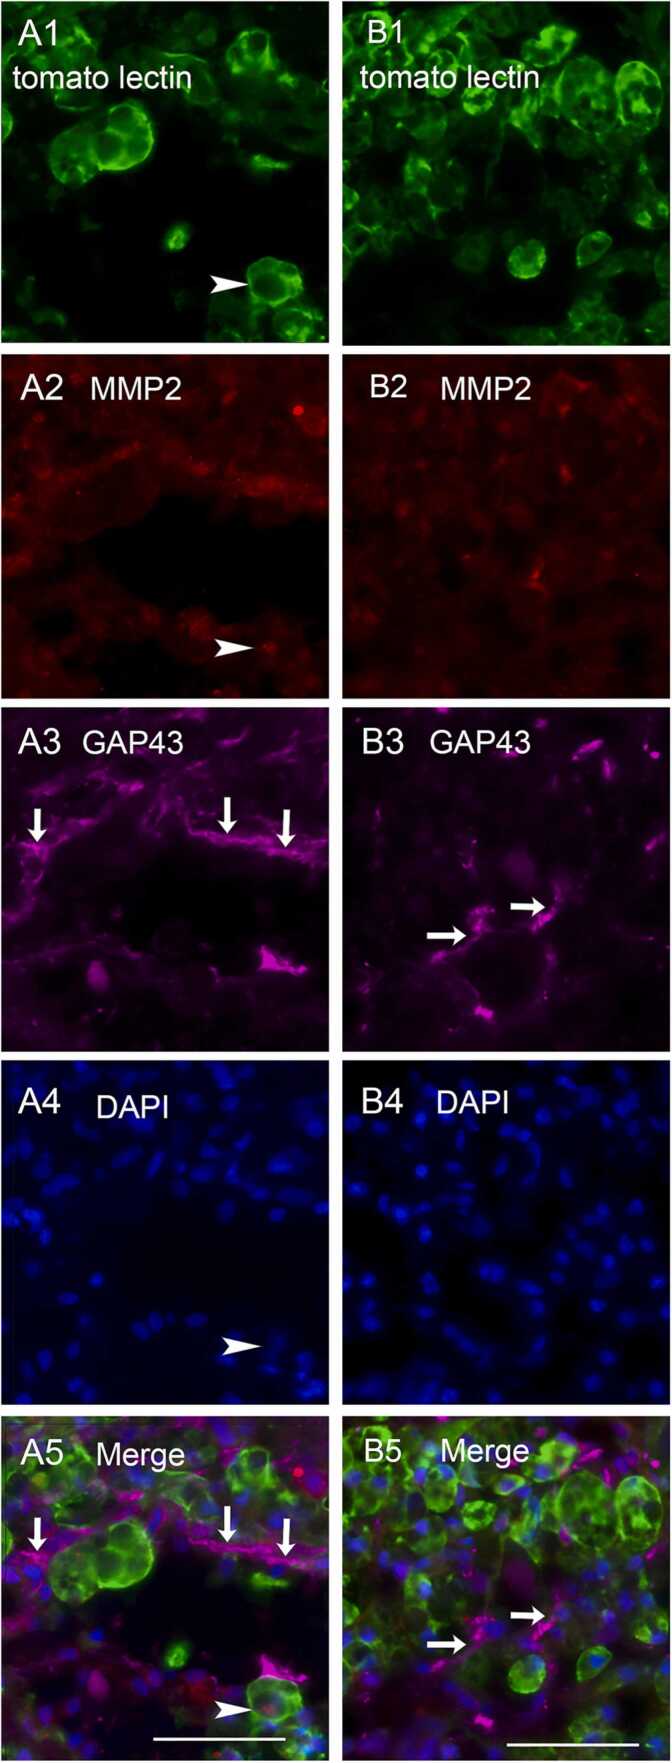
In the acute phase of spinal cord injury, the initial injury triggers secondary damage due to neuroinflammation, leading to the formation of cavities and glial scars that impair nerve regeneration. Following injuries to the central nervous system, early mobilization promotes the recovery of physical function. Therefore, in the present study, we investigated the effects of early mobilization on motor function recovery and neuroinflammation in rats. Early mobilization of rats with complete spinal cord transection resulted in good recovery of hindlimb motor function after 3 weeks. At 1 week after spinal cord injury, the early-mobilized rats expressed fewer inflammatory M1 microglia/macrophages and more anti-inflammatory M2 microglia. In addition, significantly more matrix metalloproteinase 2 (MMP2)-positive cells were observed at the lesion site 1 week after injury in the early-mobilized rats. Multiple labeling studies suggested that many MMP2-positive cells were M2 microglia. MMP9-positive cells that highly co-expressed GFAP were also observed more frequently in the early-mobilized rats. The density of growth-associated protein-positive structures in the lesion center was significantly higher in the early-mobilized rats at 3 weeks after spinal cord injury. The present results suggest that early mobilization after spinal cord injury reduced the production of M1 microglia/macrophages while increasing the production of M2 microglia at the lesion site. Early mobilization might also activate the expression of MMP2 in M2 microglia and MMP9 in astrocytes. These cellular dynamics might suppress neuroinflammation at the lesion site, thereby inhibiting the progression of tissue destruction and promoting nerve regeneration to recover motor function.

Keywords: BBB score, The Basso, Beattie, Bresnahan locomotor rating scale score; CNS, central nervous system; CSPGs, chondroitin sulfate proteoglycans; DAPI, 4′,6-diamidino-2-phenylindole; EM, early mobilization; Early mobilization; GAP43, growth associated protein 43; GFAP, glial fibrillary acidic protein; IL1β, interleukin-1β; MMPs, matrix metalloproteinases; Matrix metalloproteinases; Microglia; Motor function; NEM, non-early mobilization; Neuroinflammation; PBS, phosphate-buffered saline; PBST, PBS containing 0.05% Tween 20; PFA, paraformaldehyde; SCI, spinal cord injury; Spinal cord injury; TNF-α, tumor necrosis factor-α; iNOS, inducible nitric oxide synthase; tomato lectin, Lycopersicon Esculentum lectin.


Conflict of interest statement

None.

Figures

Fig. 1
Fig. 1
Schematic diagram of the experiments.
Fig. 2
Fig. 2
Early mobilization in the EM group. The rat moves forward and backward on the wire mesh using only the forelimbs (arrows), while the hip joint is manually manipulated to keep the rat moving.
Fig. 3
Fig. 3
BBB scores of the NEM and EM groups were compared at 1, 2, and 3 weeks after injury. Early mobilization significantly improved hindlimb motor function at 1 and 3 weeks after injury. Data are presented as mean ± SEM. * p-value = 0.026, * * p < 0.005.
Fig. 4
Fig. 4
Fig. 4-1. Images of quadruple staining with tomato lectin (green; A1 and B1), CD163 (red; A2 and B2), iNOS (violet; A3 and B3), and DAPI (blue; A4 and B4), as well as merged images (A5 and B5) at the lesion site. Images of the 1-week (1w) EM group are shown in the left row (A1-5), and those of the 1-week NEM group are shown in the right row (B1-5). Arrows indicate cells positive for both CD163 and tomato lectin. Arrowheads indicate iNOS-positive cells. Scale bars: 50 µm. Fig.4-2. A, B: Merged confocal images of triple staining with tomato lectin, CD163, and DAPI (enlarged images of Fig. 4–1 A5 and B5). Arrowheads indicate cells positive for both CD163 and tomato lectin. Scale bars: 20 µm.,.
Fig. 5
Fig. 5
A: Overview of the spinal cord in the 1-week EM group. Tomato lectin-positive cells accumulated in the lesion center but are also observed in the surrounding area. Scale bar: 500 µm. B: Comparison of the number of cells positive for CD163 and tomato lectin at the lesion site including the surrounding area between the 1-week NEM and 1-week EM groups. Data are presented as mean ± SEM. No significant difference was detected between the 2 groups. C: Comparison of the number of iNOS-positive cells at the lesion site between the 1-week NEM and 1-week EM groups. Data are presented as mean ± SEM. * p-value= 0.029.
Fig. 6
Fig. 6
A, B: Images of triple staining with MMP9 (green; A1 and B1), GFAP (red; A2 and B2), and DAPI (blue; A3 and B3), as well as merged images (A4 and B4) at the lesion site. Images of the 1-week EM group are shown in the right row (A1-4), and those of the 1-week NEM group are shown in the left row (B1-4). Arrowheads show cells positive for both MMP9 and GFAP. Scale bars: 50 µm. C: Comparison of the number of MMP9-positive cells at the lesion site including the surrounding area between the 1-week NEM and 1-week EM groups. Data are presented as mean ± SEM. No significant difference was detected between the 2 groups. D: Overview of the spinal cord in the 1-week NEM group. GFAP-positive fibers were observed in the surrounding area, but not at the lesion center. Scale bar: 500 µm.
Fig. 7
Fig. 7
Fig. 7-1. A, B: Images of quadruple staining with tomato lectin (green; A1 and B1), MMP2 (red; A2 and B2), GAP43 (violet; A3 and B3), and DAPI (blue; A4 and B4), as well as merged images (A5 and B5) at the lesion site. Images of 1-week EM group are shown in the left row (A1-5), and those of the 1-week NEM group are shown in the right row (B1-5). Arrowheads indicate cells positive for both tomato lectin and MMP2. Arrows indicate GAP43-positive structures. Scale bars: 50 µm. Fig.7-2. A, B: Merged confocal images of triple staining with tomato lectin, MMP2, and DAPI (enlarged images of Fig. 7–1 A5 and B5). Arrowheads indicate cells positive for both MMP2 and tomato lectin. Scale bars: 20 µm. C: Comparison of the number of MMP2-positive cells at the lesion site including the surrounding area between the 1-week NEM and 1-week EM groups. Data are presented as mean ± SEM. * p-value = 0.029.
Fig. 8
Fig. 8
A, B: Merged Images of quadruple staining with tomato lectin (green), GFAP (yellow), fibronectin (red), and DAPI (blue) at the spinal cord injury lesion. Image of the 3-week EM group is shown in A and that of the 3-week EM group is shown B. Red line enclosure indicates the void/cavity area. Scale bars: 100 µm. C, E: Overview of the spinal cord of the 3-week EM group (C) and the 3-week NEM group (E). Scale bars: 500 µm. D: Comparison of the void/cavity area at the spinal cord lesion sites between the 3-week NEM and 3-week EM groups. Data are presented as mean ± SEM. * p-value= 0.029.
Fig. 9
Fig. 9
A, B: Merged Images of quadruple staining with GFAP (green), GAP43 (white), and collagenⅣ (red) at the spinal cord injury lesion. Image of the 3-week EM group spinal cord lesion site overview is shown in A. Scale bar: 200 µm. The lesion center is enclosed by the white dotted line. B: Enlargement image of spinal cord lesion. Yellow arrows indicate representative GAP43 structures (white). The border of lesion center is indicated by the yellow dotted line. Scale bars: 50 µm. C: Comparison of the area of GAP43 structures and lesion center between the 3-week NEM and 3-week EM groups. Data are presented as mean ± SEM. * p-value= 0.011. D: Comparison of the GAP43 density of lesion center between the 3-week NEM and 3-week EM groups. Data are presented as mean ± SEM. * p-value= 0.016.
Fig. 10
Fig. 10
A, B: Images of quadruple staining with tomato lectin (green; A1 and B1), MMP2 (red; A2 and B2), GAP43 (violet; A3 and B3), and DAPI (blue; A4 and B4), as well as merged images (A5 and B5) at the lesion site. Images of the 3-week EM group are shown in the left row (A1–5), and those of the 3-week NEM group are shown in the right row (B1–5). Arrowheads indicate cells positive for both tomato lectin and MMP2. Arrows indicate GAP43-structures running through the cavity-free area. Scale bars: 50 µm.

Similar articles

Cited by

References

    1. Adams K.L., Gallo V. The diversity and disparity of the glial scar. Nat Neurosci. 2018;21(1):9–15. doi: 10.1038/s41593-017-0033-9. . Epub 2017 Dec 21. PMID: 29269757; PMCID: PMC5937232. - DOI - PMC - PubMed
    1. Alizadeh A., Dyck S.M., Kataria H., Shahriary G.M., Nguyen D.H., Santhosh K.T., Karimi-Abdolrezaee S. Neuregulin-1 positively modulates glial response and improves neurological recovery following traumatic spinal cord injury. Glia. 2017;65(7):1152–1175. 10.1002/glia.23150. Epub 2017 Apr 29. PMID: 28456012. - PubMed
    1. AVERT Trial Collaboration group.Efficacy and safety of very early mobilisation within 24h of stroke onset (AVERT): a randomised controlled trial. Lancet. 2015 Jul 4;386 (9988):46–55. 10.1016/S0140-6736(15)60690-0. Epub 2015 Apr 16. Erratum in: Lancet. 2015 Jul 4;386(9988):30. Erratum in: Lancet. 2017 May 13;389(10082): 1884. PMID: 25892679. - DOI - PubMed
    1. Basso D.M., Beattie M.S., Bresnahan J.C. Vol. 12. 1995. A sensitive and reliable locomotor rating scale for open field testing in rats; pp. 1–21. (J. Neurotrauma). 10.1089/neu.1995.12.1. PMID: 7783230. - PubMed
    1. Bellver-Landete V., Bretheau F., Mailhot B., Vallières N., Lessard M., Janelle M.E., Vernoux N., Tremblay M.È., Fuehrmann T., Shoichet M.S., Lacroix S. Microglia are an essential component of the neuroprotective scar that forms after spinal cord injury. Nat. Commun. 2019;10(1):518. 10.1038/s41467-019-08446-0. PMID: 30705270; PMCID: PMC6355913. - PMC - PubMed

LinkOut - more resources