

Principal component analysis reveals multiple consistent responses to naturalistic stimuli in children and adults
- PMID: 35586919
- PMCID: PMC9248318
- DOI: 10.1002/hbm.25568
Principal component analysis reveals multiple consistent responses to naturalistic stimuli in children and adults
Abstract
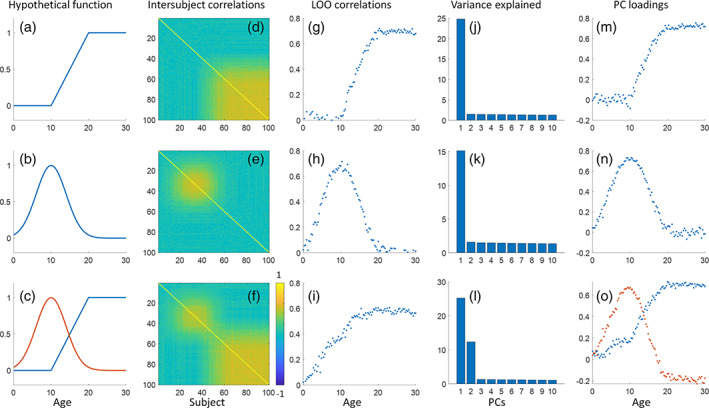
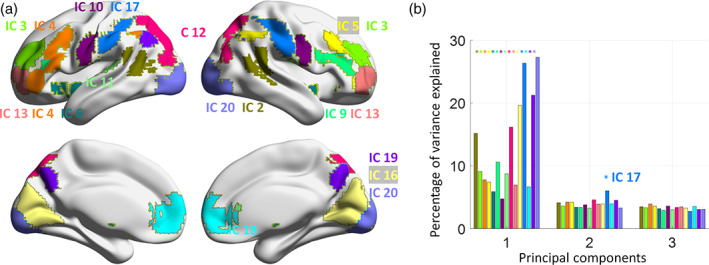
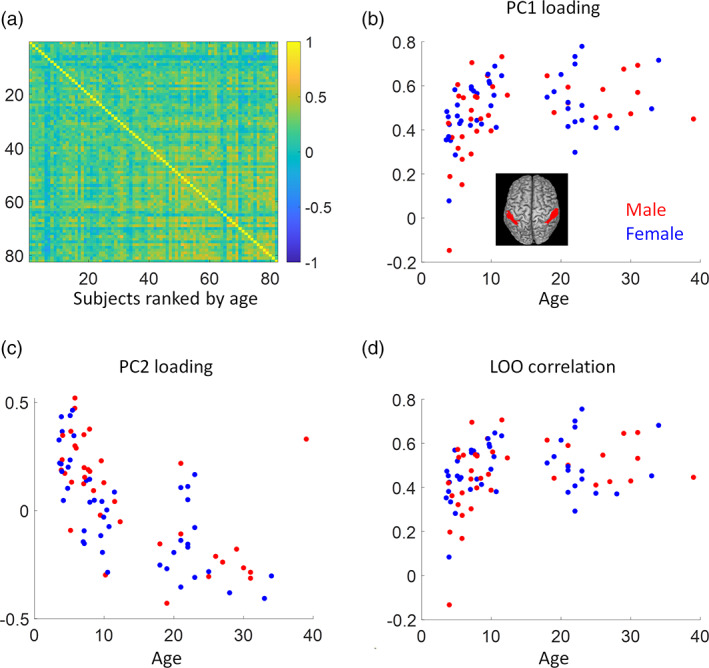
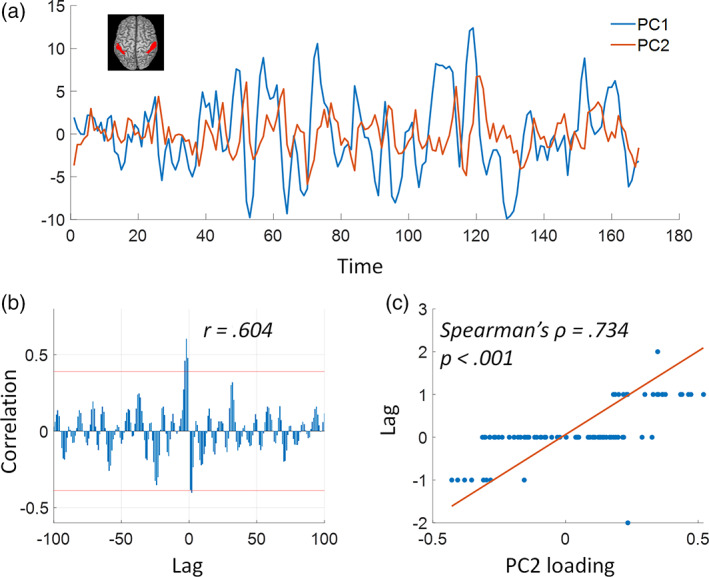
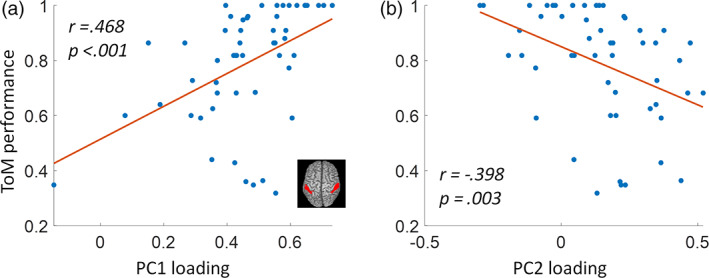
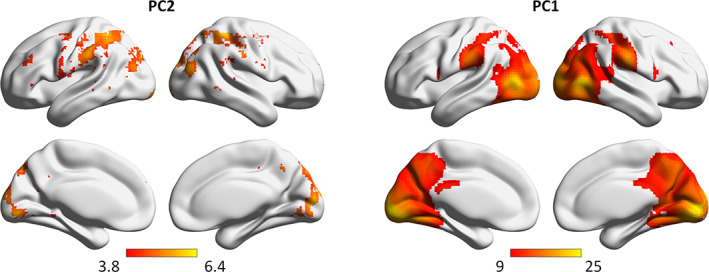
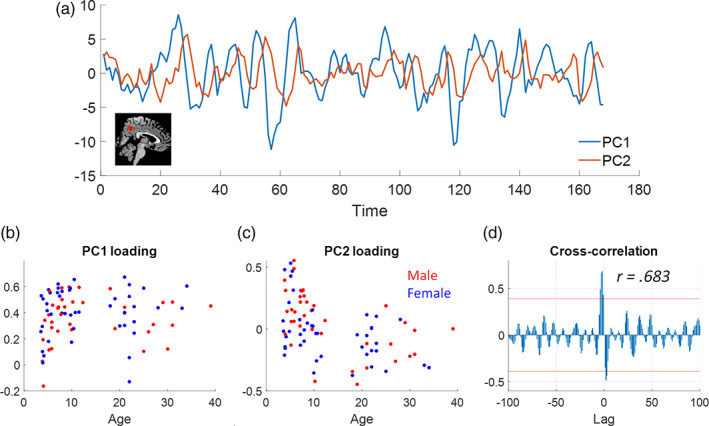
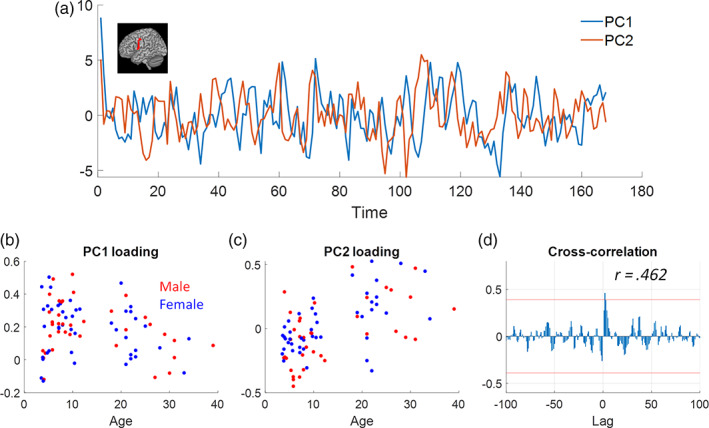
Functional MRI (fMRI) study of naturalistic conditions, for example, movie watching, usually focuses on shared responses across subjects. However, individual differences have been attracting increasing attention in search of group differences or associations with behavioral outcomes. Individual differences are typically studied by directly modeling the pair-wise intersubject correlation matrix or projecting the relations onto a single dimension. We contend that it is critical to examine whether there are one or more consistent responses underlying the whole sample, because multiple components, if exist, may undermine the intersubject relations using the previous methods. We propose to use principal component analysis (PCA) to examine the heterogeneity of brain responses across subjects and project the individual variability into higher dimensions. By analyzing an fMRI dataset of children and adults watching a cartoon movie, we showed evidence of two consistent responses in the supramarginal gyrus and other regions. While the first components in many regions represented a response pattern mostly in older children and adults, the second components mainly represented the younger children. The second components in the supramarginal network resembled a delayed version of the first PCs for 4 s (2 TR), indicating slower responses in the younger children than the older children and adults. The analyses highlight the importance of identifying multiple consistent responses in responses to naturalistic stimuli. This PCA-based approach could be complementary to the commonly used intersubject correlation to analyze movie-watching data.
Keywords: development; individual difference; movie watching; naturalistic condition; principal component analysis; supramarginal gyrus; theory of mind.
© 2022 The Authors. Human Brain Mapping published by Wiley Periodicals LLC.
Figures
Similar articles
-
Intersubject consistent dynamic connectivity during natural vision revealed by functional MRI.Neuroimage. 2020 Aug 1;216:116698. doi: 10.1016/j.neuroimage.2020.116698. Epub 2020 Mar 1. Neuroimage. 2020. PMID: 32130972 Free PMC article.
-
Discovering hidden brain network responses to naturalistic stimuli via tensor component analysis of multi-subject fMRI data.Neuroimage. 2022 Jul 15;255:119193. doi: 10.1016/j.neuroimage.2022.119193. Epub 2022 Apr 8. Neuroimage. 2022. PMID: 35398543 Free PMC article.
-
Functional connectivity patterns predict naturalistic viewing versus rest across development.Neuroimage. 2021 Apr 1;229:117630. doi: 10.1016/j.neuroimage.2020.117630. Epub 2021 Jan 2. Neuroimage. 2021. PMID: 33401011 Free PMC article.
-
Idiosynchrony: From shared responses to individual differences during naturalistic neuroimaging.Neuroimage. 2020 Jul 15;215:116828. doi: 10.1016/j.neuroimage.2020.116828. Epub 2020 Apr 7. Neuroimage. 2020. PMID: 32276065 Free PMC article. Review.
-
Social cognition in context: A naturalistic imaging approach.Neuroimage. 2020 Aug 1;216:116392. doi: 10.1016/j.neuroimage.2019.116392. Epub 2019 Nov 23. Neuroimage. 2020. PMID: 31770637 Free PMC article. Review.
Cited by
-
Individual differences in time-varying and stationary brain connectivity during movie watching from childhood to early adulthood: Age, sex, and behavioral associations.Dev Cogn Neurosci. 2023 Oct;63:101280. doi: 10.1016/j.dcn.2023.101280. Epub 2023 Jul 17. Dev Cogn Neurosci. 2023. PMID: 37480715 Free PMC article.
-
Stimulus Selection Influences Prediction of Individual Phenotypes in Naturalistic Conditions.Hum Brain Mapp. 2025 Feb 15;46(3):e70164. doi: 10.1002/hbm.70164. Hum Brain Mapp. 2025. PMID: 39960115 Free PMC article.
-
Editorial: Shared responses and individual differences in the human brain during naturalistic stimulations.Front Hum Neurosci. 2023 May 5;17:1201728. doi: 10.3389/fnhum.2023.1201728. eCollection 2023. Front Hum Neurosci. 2023. PMID: 37213928 Free PMC article. No abstract available.
-
Delayed cerebrovascular reactivity in individuals with spinal cord injury in the right inferior parietal lobe: a breath-hold functional near-infrared spectroscopy study.medRxiv [Preprint]. 2024 Jun 4:2024.06.03.24307819. doi: 10.1101/2024.06.03.24307819. medRxiv. 2024. PMID: 38883754 Free PMC article. Preprint.
-
Individual differences in time-varying and stationary brain connectivity during movie watching from childhood to early adulthood: age, sex, and behavioral associations.bioRxiv [Preprint]. 2023 Jun 14:2023.01.30.526311. doi: 10.1101/2023.01.30.526311. bioRxiv. 2023. Update in: Dev Cogn Neurosci. 2023 Oct;63:101280. doi: 10.1016/j.dcn.2023.101280. PMID: 36778481 Free PMC article. Updated. Preprint.
References
-
- Bacha‐Trams, M. , Alexandrov, Y. I. , Broman, E. , Glerean, E. , Kauppila, M. , Kauttonen, J. , … Jääskeläinen, I. P. (2018). A drama movie activates brains of holistic and analytical thinkers differentially. Social Cognitive and Affective Neuroscience, 13, 1293–1304. 10.1093/scan/nsy099 - DOI - PMC - PubMed
Publication types
MeSH terms
Grants and funding
LinkOut - more resources
Full Text Sources
