

Specific N-glycans regulate an extracellular adhesion complex during somatosensory dendrite patterning
- PMID: 35586945
- PMCID: PMC9253746
- DOI: 10.15252/embr.202154163
Specific N-glycans regulate an extracellular adhesion complex during somatosensory dendrite patterning
Abstract
N-glycans are molecularly diverse sugars borne by over 70% of proteins transiting the secretory pathway and have been implicated in protein folding, stability, and localization. Mutations in genes important for N-glycosylation result in congenital disorders of glycosylation that are often associated with intellectual disability. Here, we show that structurally distinct N-glycans regulate an extracellular protein complex involved in the patterning of somatosensory dendrites in Caenorhabditis elegans. Specifically, aman-2/Golgi alpha-mannosidase II, a conserved key enzyme in the biosynthesis of specific N-glycans, regulates the activity of the Menorin adhesion complex without obviously affecting the protein stability and localization of its components. AMAN-2 functions cell-autonomously to allow for decoration of the neuronal transmembrane receptor DMA-1/LRR-TM with the correct set of high-mannose/hybrid/paucimannose N-glycans. Moreover, distinct types of N-glycans on specific N-glycosylation sites regulate DMA-1/LRR-TM receptor function, which, together with three other extracellular proteins, forms the Menorin adhesion complex. In summary, specific N-glycan structures regulate dendrite patterning by coordinating the activity of an extracellular adhesion complex, suggesting that the molecular diversity of N-glycans can contribute to developmental specificity in the nervous system.
Keywords: N-glycans; adhesion; alpha mannosidase II; dendrite; glycosylations.
© 2022 The Authors.
Figures
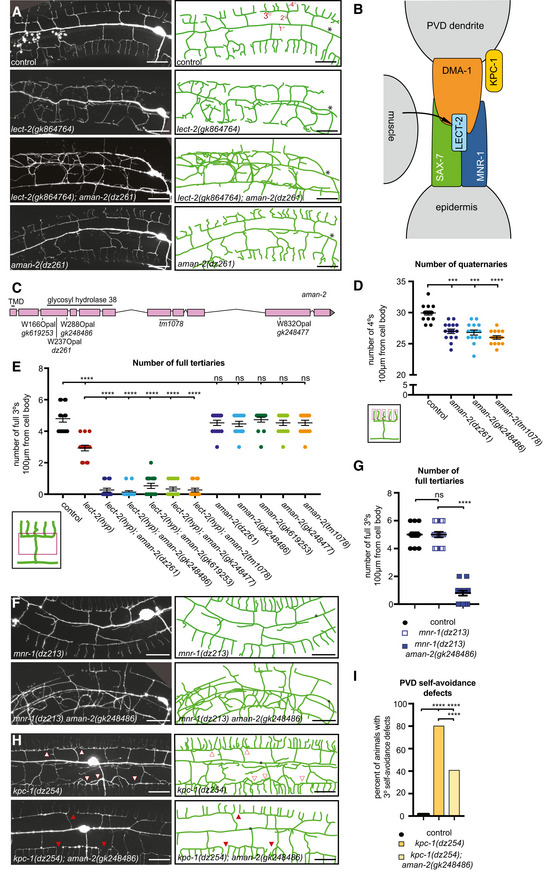
Fluorescent images (left panels) and tracings (right panels) of PVD neurons of the indicated genotypes. PVD is visualized by the wdIs52 transgene. Primary (1°), secondary (2°), tertiary (3°), and quaternary (4°) dendrites are indicated, and the cell body is marked with an asterisk. Anterior is to the left and dorsal is up in all panels. Scale bars represent 20 μm.
Schematic of the Menorin complex, including DMA‐1/LRR‐TM, SAX‐7/L1CAM, MNR‐1/Menorin, and LECT‐2/Chondromodulin II, as well as the negative regulator KPC‐1/Furin.
Genomic environs of aman‐2. An N‐terminal transmembrane domain (TMD) is indicated, encoding a type II transmembrane protein. All alpha‐mannosidase II proteins contain a glycosyl hydrolase 38 domain. Four nonsense alleles and one deletion allele (tm1078) of aman‐2 are denoted.
Quantification of the number of quaternary branches (indicated in schematic) in different aman‐2 alleles and in wild‐type control animals. All loss of function alleles of aman‐2 display a significant decrease in PVD quaternary branch number. Data are represented as mean ± SEM. Statistical significance was calculated using the Kruskal–Wallis test and is indicated (****P ≤ 0.0001). n = 15 for all genotypes and are biological replicates.
Quantification of the number of full tertiaries (marked by secondary and tertiary branches as shown in schematic) in the genotypes indicated. Data are represented as mean ± SEM. Statistical significance was calculated using the Kruskal–Wallis test and is indicated (****P ≤ 0.0001, ns = not significant). n = 15 for all genotypes and are biological replicates.
Fluorescent images and tracings of PVD in mnr‐1(dz213) hypomorphic animals alone and in combination with an aman‐2(gk248486) null mutant. The dz213 introduces a L135F missense mutation in the DUF2181 domain of MNR‐1/Menorin. PVD is visualized by the dzIs53 transgene. The cell body is marked with an asterisk. Scale bars represent 20 μm.
Quantification of the number of full tertiaries in genotypes indicated and traced in (F). The loss of aman‐2 severely enhances the mnr‐1(dz213) phenotype. Control indicates wild‐type control animals as shown in (A). Data are represented as mean ± SEM. Statistical significance was calculated using the Mann–Whitney test and is indicated (****P ≤ 0.0001, ns = not significant). n > 23 for all genotypes and are biological replicates.
Fluorescent images and tracings of PVD in kpc‐1(dz254) hypomorph animals alone and in combination with an aman‐2(gk248486) null mutant. PVD is visualized by the dzIs53 transgene. White arrows indicate self‐avoidance defects in tertiary branches. Red arrows show gaps between tertiary branches (no self‐avoidance defects). The cell body is marked with an asterisk. Scale bars represent 20 μm.
Quantification of the percent of self‐avoidance defects in genotypes indicated and traced in (G). Control indicates wild‐type control animals as shown in (A). The loss of aman‐2 suppresses defects in the kpc‐1(dz254) phenotype. Data are represented as mean. Statistical significance was calculated using the Z‐test and is indicated (****P ≤ 0.0001). n > 15 for all genotypes and are biological replicates.
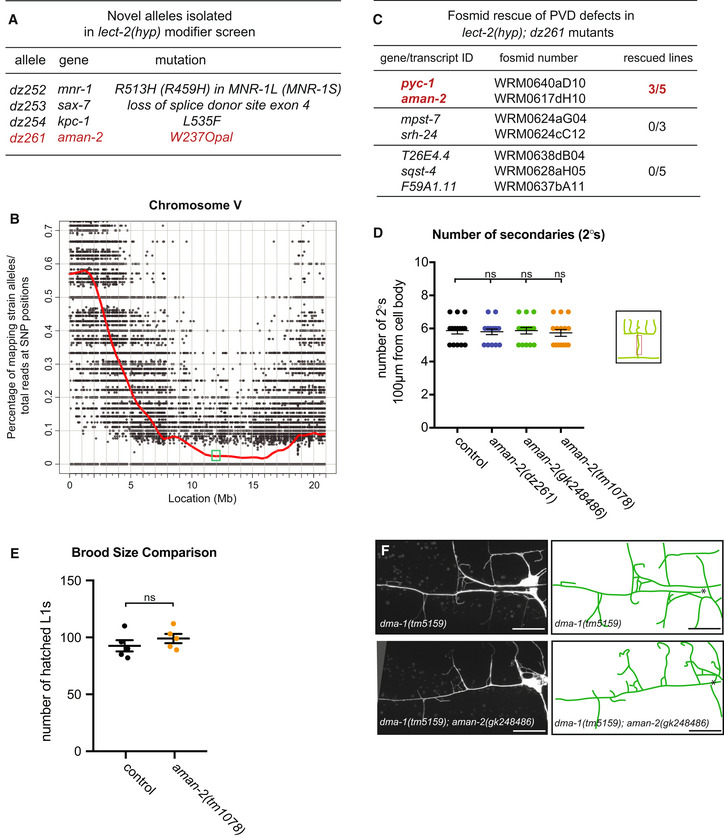
Table of alleles isolated in the lect‐2(gk864764) hypomorph modifier screen.
Graph of single nucleotide polymorphism (SNP) results after whole genome sequencing of the dz261 allele (Doitsidou et al, 2016). Axes are denoted above. The green box shows the genomic position of aman‐2.
Table showing the candidate genes tested as a result of the SNP data in (B). Pools of fosmids covering the regions of indicated transcripts were injected into the lect‐2(hyp); dz261 double mutant. Only the pool containing a fosmid including aman‐2 showed rescue. pyc‐1 was eliminated because a null allele (gk689405) failed to enhance the lect‐2(hyp). Numbers indicate number of biological replicates that showed rescue. 25 animals were scored for each line.
Quantification of the number of secondary branches (indicated in schematic) in the genotypes indicated. Data are represented as mean ± SEM. Statistical significance was calculated using the Kruskal–Wallis test, ns: no significance. n = 15 for all genotypes and are biological replicates.
Viability of aman‐2 mutant animals assessed via brood size comparison in the number of eggs that hatched and produced L1 larvae in wild‐type control and aman‐2(tm1078) animals. Data are represented as mean ± SEM. Statistical significance was calculated using the Mann–Whitney test, ns: no significance. n = 5 for all genotypes and are biological replicates.
Fluorescent images of the dma‐1 null allele, dma‐1(tm5159), alone (top) and in a double null mutant aman‐2(gk248486) background (bottom). Asterisk indicates location of the cell body. Scale bars represent 20 μm.
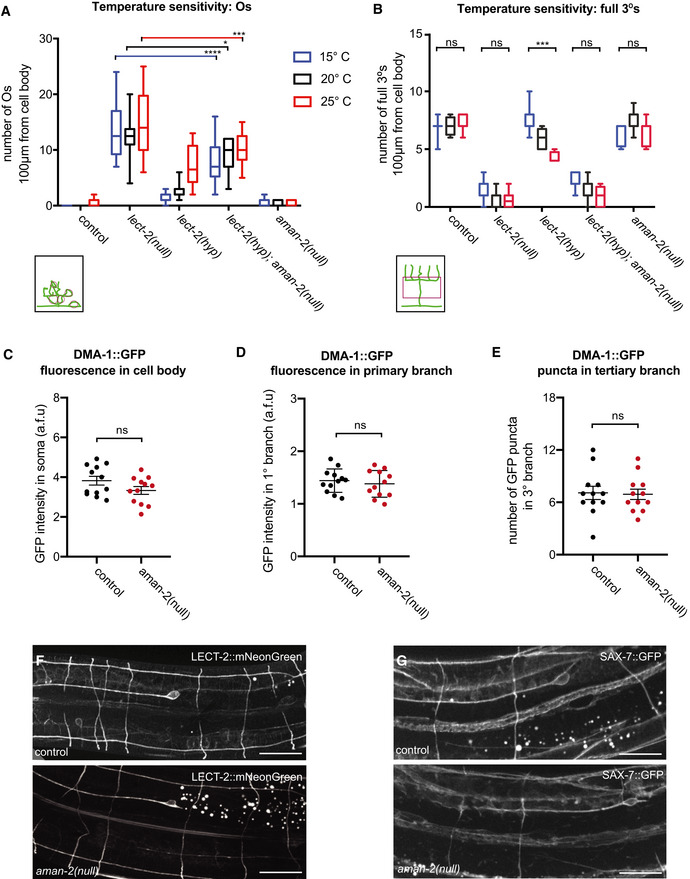
Quantification of “Os” (overlapping branches as shown in schematic) of denoted genotypes at different temperatures. Data are presented as box and whisker plots, with the median and 25th and 75th percentile indicated. Whiskers show minimum and maximum. Statistical comparisons were performed using two‐way ANOVA tests, *P ≤ 0.05, ***P ≤ 0.001, ****P ≤ 0.0001, ns: not significant. n > 11 for all groups.
Quantification of full tertiaries of denoted genotypes at different temperatures. Data are presented as box and whisker plots, with the median and 25th and 75th percentile indicated. Whiskers show minimum and maximum. Statistical comparisons were performed using two‐way ANOVA tests, ***P ≤ 0.001, ns: not significant. n > 11 for all groups.
Quantification of DMA‐1::GFP fluorescence in control and aman‐2(gk248486) animals. GFP intensity is quantified in arbitrary fluorescent units by dividing the fluorescent area of the soma by the background. Data are represented as mean ± SEM. Statistical comparisons were performed using the Mann–Whitney test, ns: not significant. n = 12 for all genotypes and are biological replicates.
Quantification of DMA‐1::GFP fluorescence in control and aman‐2(gk248486) animals. GFP intensity is quantified in arbitrary fluorescent units by measuring the fluorescence along the primary dendrite, up to 60 µm anterior from the cell body. Data are represented as mean ± SEM. Statistical comparisons were performed using the Mann–Whitney test, ns: not significant. n = 12 for all genotypes and are biological replicates.
Quantification of DMA‐1::GFP fluorescent puncta in control and aman‐2(gk248486) animals. Puncta in the tertiary branches 60 µm anterior to the cell body were counted. Data are represented as mean ± SEM. Statistical comparisons were performed using the Mann–Whitney test, ns: not significant. n = 12 for all genotypes and are biological replicates.
Localization of LECT‐2::mNeonGreen (dz249 endogenous reporter) in wild‐type and aman‐2(dz261) null mutant animals. No obvious differences in general neuronal or hypodermal staining were observed. Vesicular gut autofluorescence is visible as white circular staining. Scale bars represent 20 μm. 15 animals were assessed per genotype.
Localization of SAX‐7::GFP (ddIs290 fosmid reporter) in wild type and aman‐2(dz261) null mutant animals. No obvious differences in general neuronal or hypodermal staining were observed. Vesicular gut autofluorescence is visible as white circular staining. Scale bars represent 20 μm. 15 animals were assessed per genotype.
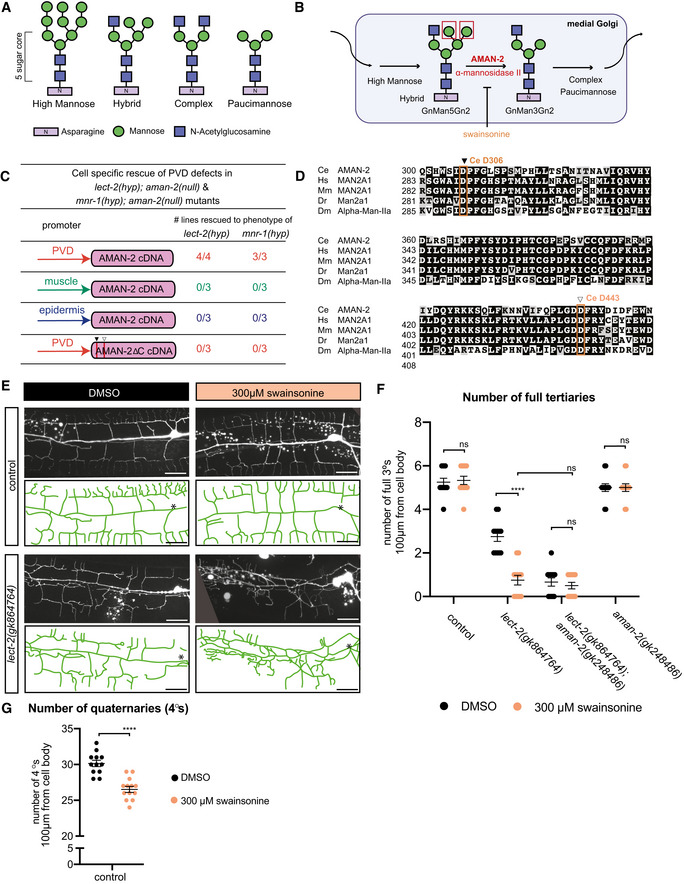
Types of N‐linked glycans. The shared pentasaccharide core consists of two N‐acetylglucosamines (blue squares) and 3 mannoses (green circles) attached onto an Asparagine residue with an N‐X‐S/T consensus site. Glycan types vary by identity of additional sugars onto the pentasaccharide core.
Drawing showing the enzymatic activity of AMAN‐2 in the medial Golgi. AMAN‐2 cleaves two specific α1,3 and α1,6 mannose linked residues boxed in red, allowing for the formation of complex and paucimannose type N‐glycans. Arrows denote other enzymes. Swainsonine specifically inhibits enzymatic activity of alpha‐mannosidase II. (Man = mannose, Gn = N‐acetylglucosamine).
Table showing cell‐specific rescue experiments of PVD defects. AMAN‐2 cDNAs are expressed under the control of PVD, muscle, and epidermal specific promoters in the indicated double mutant backgrounds. Rescue is defined by restoration of the enhanced PVD phenotype back to that of the single hypomorphic mutants alone in aman‐2(gk248486) null mutant backgrounds enhanced by lect‐2(gk846764) or mnr‐1(dz213). 25 transgenic animals and their non‐transgenic siblings were scored for each line. Numbers indicate number of biological replicates that showed rescue.
Multiple sequence alignment of human MAN2A1 (Hs; acc# NP_002363.2), mouse MAN2A1 (Mm; acc# NP_032575.2), zebrafish Man2a1 (Dr; acc# NP_001103497.2), fruit fly Alpha‐Man‐IIa (Dm; acc# NP_650494.2) and C. elegans AMAN‐2 (Ce; acc# NP_505995.2) created by COBALT (constrained based multiple sequence alignment tool). Conserved catalytic sites D306 (black arrow) and D443 (white arrow) are boxed in orange.
Fluorescent images and tracings of wild‐type control (top) and lect‐2(gk846764) hypomorphic animals (bottom) fed on plates with 300 µm swainsonine vs. a DMSO control. PVD is visualized by the wyIs581 transgene. The cell body is denoted with an asterisk. Anterior is to the left and dorsal is up in all panels. Vesicular gut autofluorescence is visible as white circular staining. Scale bars represent 20 μm.
Quantification of the number of full tertiaries in denoted genetic backgrounds (aman‐2 null is gk248486). Black data points indicate DMSO and orange data points show swainsonine treated animals. Data are represented as mean ± SEM. Statistical significance was calculated using the Mann–Whitney test and is indicated (****P ≤ 0.0001, ns = not significant). n = 12 for all genotypes and are biological replicates.
Quantification of the number of quaternary dendrites in wild‐type control animals fed on plates with and without 300 µm swainsonine. Animals treated with swainsonine show a significant decrease in quaternary branch number, akin to the data in Fig 1C. Data are represented as mean ± SEM. Statistical significance was calculated using the Mann–Whitney test and is indicated (****P ≤ 0.0001). n = 12 for each experiment and are biological replicates.
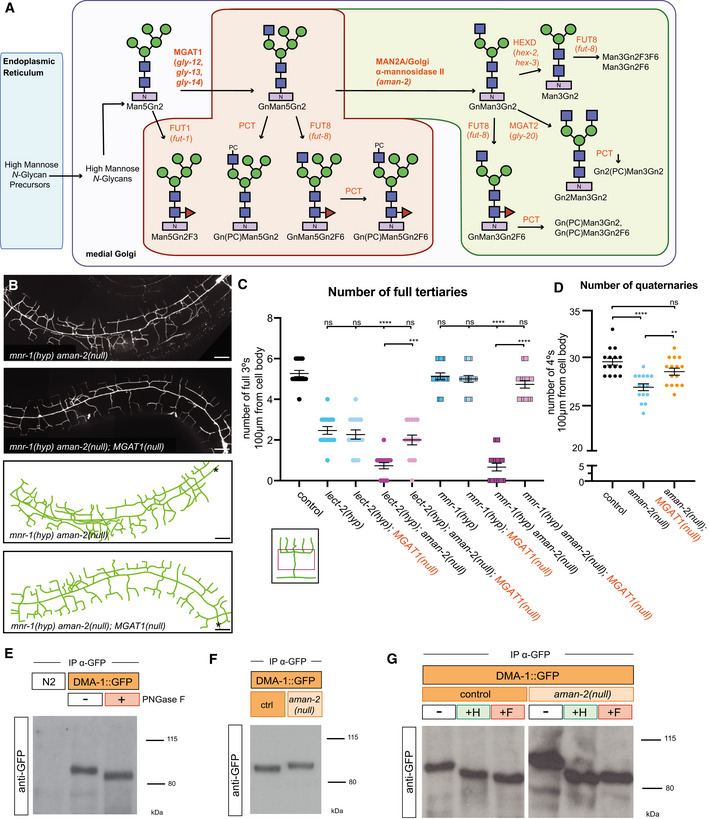
Schematic of the conserved N‐glycosylation pathway in C. elegans. The blue box represents the Endoplasmic Reticulum, while the purple box represents the medial Golgi. Glycan residues are consistent with Fig 2A, with the addition of red triangles denoting fucose residues. Arrows and orange text represent enzymes. The green area marks wild‐type N‐glycan chains whereas the red area represents abnormal N‐glycan chains that arise in the absence of AMAN‐2. The glycans in the green area are not formed in the absence of AMAN‐2. (Man = mannose, Gn = N‐acetylglucosamine, F = fucose, PC = phosphorylcholine, MGAT1 = N‐acetylglucosaminyltransferase I, FUT = fucosyltransferase, HEXD = hexosaminidase).
Fluorescent composite images (top) and tracings (bottom) of mnr‐1(dz213) in an aman‐2(gk248486) and an aman‐2(gk248486); MGAT‐1(null) background. An MGAT null mutant lacks the three C. elegans paralogs: gly‐12, gly‐13, and gly‐14. PVD is visualized by the wyIs581 transgene. The cell body is denoted with an asterisk. Anterior is to the left and dorsal is up in all panels. Scale bars represent 20 μm.
Quantification of full tertiaries of denoted genotypes. Data are represented as mean ± SEM. Statistical comparisons were performed using the Kruskal–Wallis test. Statistical significance is indicated (***P ≤ 0.001, ****P ≤ 0.0001, ns = not significant). n = 15 for all genotypes and are biological replicates.
Quantification of the number of quaternary branches in wild‐type control, aman‐2(gk248486) null, and MGAT1(null) animals. Loss of MGAT1 suppresses the decrease in quaternary branch number in the aman‐2(null) background. Data are represented as mean ± SEM. Statistical significance was calculated using the Kruskal–Wallis test and is indicated (**P ≤ 0.01, ****P ≤ 0.0001). n = 15 for all genotypes and are biological replicates.
Western blot against GFP in C. elegans lysate expressing no transgenes (N2) and expressing DMA‐1::GFP (qyIs369), after precipitating with anti‐GFP antibody. The red boxed plus sign indicates that the lysate is treated with the PNGase F glycosidase. The downward size shift reveals that N‐glycan structures are present on DMA‐1. Ladder is marked in kilodaltons (kDa). The GFP tag contains no N‐glycosylation sites. The experiment was repeated four times with biological replicates.
Western blot against GFP in C. elegans lysate DMA‐1::GFP (qyIs369), after precipitating with anti‐GFP antibody. Control indicates an otherwise wild‐type background as opposed to an aman‐2(gk248486) null background. The upward size shift in the mutant reveals that the loss of aman‐2 alters the identity of N‐glycan structures on DMA‐1. The experiment was repeated four times with biological replicates.
Western blot against GFP in C. elegans lysate DMA‐1::GFP (qyIs369), after precipitating with anti‐GFP antibody. Control indicates an otherwise wild‐type background as opposed to an aman‐2(gk248486) null background. The red boxed +F indicates that the lysate is treated with the PNGase F glycosidase, while the green boxed +H corresponds to the Endo H glycosidase, which cleaves high‐mannose and hybrid type N‐glycans. For complementary experiments using the Endo D glycosidase, which cleaves paucimannose type N‐glycans, see Fig EV4B. Size shifts indicate that some hybrid/high‐mannose structures are present on DMA‐1 (left), and that the aman‐2 mutant results in only hybrid/high‐mannose structures on DMA‐1 (right). The experiment was repeated four times with biological replicates.
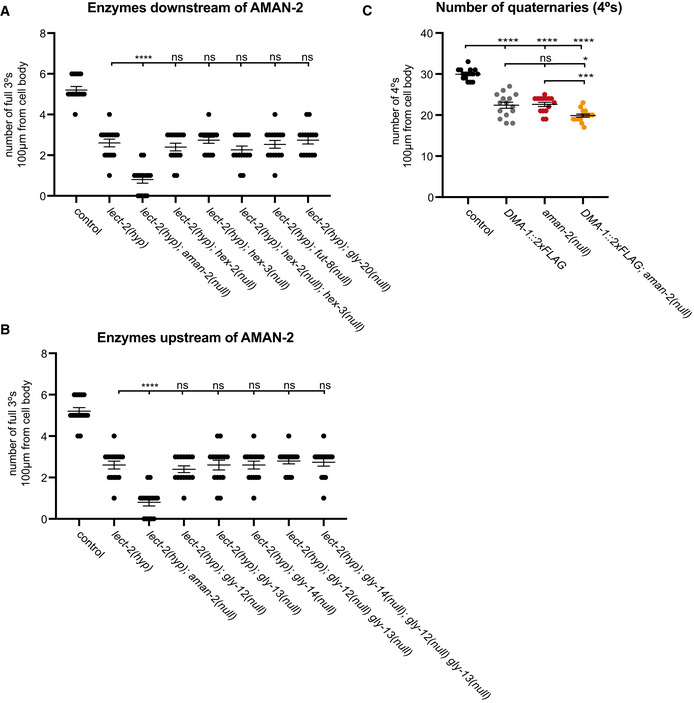
Quantification of the number of full tertiaries in wild‐type controls, lect‐2(gk864764) hypomorphs, and lect‐2(gk864764) in combination with mutants of MGAT1 orthologs. See strain list for alleles. Data are represented as mean ± SEM. Statistical significance was calculated using the Kruskal–Wallis test, ****P ≤ 0.0001, ns: not significant. n = 15 for all genotypes and are biological replicates.
Quantification of the number of full tertiaries in wild‐type controls, lect‐2(gk864764) hypomorphs, and lect‐2(gk864764) in combination with mutants of enzymes acting downstream of aman‐2. See strain list for alleles. Data are represented as mean ± SEM. Statistical significance was calculated using the Kruskal–Wallis test, ****P ≤ 0.0001, ns: not significant). n = 15 for all genotypes and are biological replicates.
Quantification of the number of quaternary branches in wild‐type control animals, DMA‐1::2XFLAG (denoted as DMA‐1 wild type in Fig 4), and in combination with aman‐2(gk248486). In the DMA‐1::2XFLAG (wy1041) background, there is a baseline decrease in the number of branches, possibly due to the insertion of the tag (Dong et al, 2016). While equivalent to the phenotype of aman‐2(gk248486), combining the two backgrounds results in a further decrease in quaternary branches, providing an additional example of how hypomorphic alleles in the Menorin pathway can be enhanced by the loss of aman‐2. Data are represented as mean ± SEM. Statistical significance was calculated using the Kruskal–Wallis test, *P ≤ 0.05, ***P ≤ 0.001, ****P ≤ 0.0001. n = 15 for all genotypes and are biological replicates.
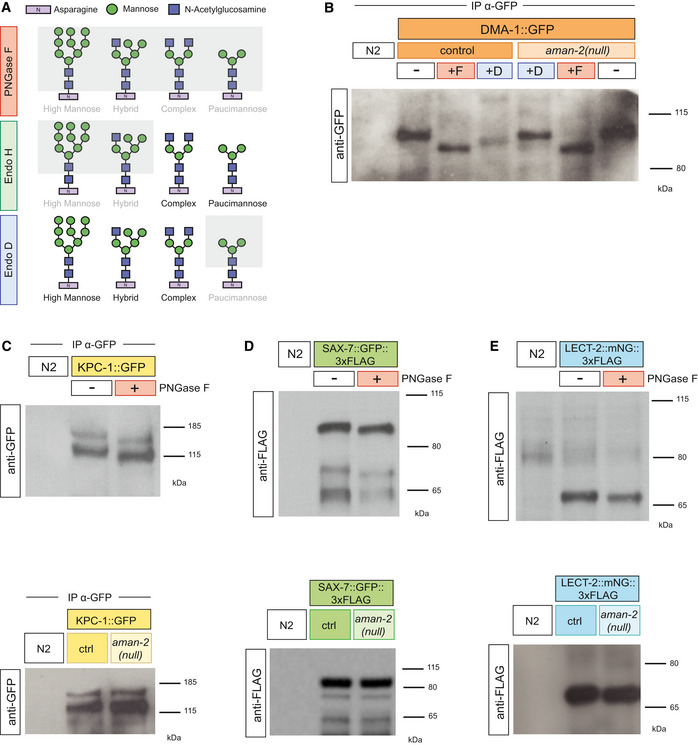
Schematic of endoglycosidase activity on N‐glycan chains. The gray shading represents parts of the chain that are cleaved by each respective endoglycosidase. Glycan residues are consistent with Fig 2A, and colors of endoglycosidases correspond to Fig 3E and G.
Western blot against GFP in C. elegans lysate DMA‐1::GFP (qyIs369), after precipitating with anti‐GFP antibody. Control indicates an otherwise wild‐type background as opposed to an aman‐2(gk248486) background. The red boxed +F indicates that the lysate is treated with the PNGase F glycosidase, while the green boxed +D corresponds to the Endo D glycosidase, which cleaves paucimannose type N‐glycans. Size shifts indicate that some paucimannose structures are present on DMA‐1 (left), and that the aman‐2 mutant results in the loss of paucimannose structures on DMA‐1 (right). Ladder is marked in kilodaltons (kDa). The experiment was repeated four times with biological replicates.
Western blot against GFP in C. elegans lysate expressing no transgenes (N2) and expressing KPC‐1::GFP (dzEx1865), after precipitating with anti‐GFP antibody. The molecular weights of wild‐type lysate are 130 and 150 kDa. The red boxed plus sign indicates that the lysate is treated with the PNGase F glycosidase. The downward size shift reveals that N‐glycan structures are present on KPC‐1. In the bottom blot, control indicates an otherwise wild‐type background as opposed to an aman‐2(gk248486) background. No visible size shift is observed, and the experiment was repeated three times with unique samples.
Western blot against FLAG in C. elegans lysate expressing no transgenes (N2) and expressing SAX‐7::GFP::3XFLAG (ddIs290). Robust expression precludes the need for immunoprecipitation. The molecular weights of wild‐type lysate are 100, 70, and 65 kDa. The red boxed plus sign indicates that the lysate is treated with the PNGase F glycosidase. The downward size shift reveals that N‐glycan structures are present on SAX‐7. In the bottom blot, control indicates an otherwise wild‐type background as opposed to an aman‐2(gk248486) background. No visible size shift is observed, and the experiment was repeated three times with unique samples. The FLAG epitope contains no N‐glycosylation sites.
Western blot against FLAG in C. elegans lysate expressing no transgenes (N2) and expressing endogenous LECT‐2::mNeonGreen::3XFLAG (dz249). Robust expression precludes the need for immunoprecipitation. The molecular weight of wild‐type lysate is 70 kDa. The red boxed plus sign indicates that the lysate is treated with the PNGase F glycosidase. The small downward size shift reveals that N‐glycan structures are present on LECT‐2. In the bottom blot, control indicates an otherwise wild‐type background as opposed to an aman‐2(gk248486) background. No visible size shift is observed, and the experiment was repeated three times with unique samples.
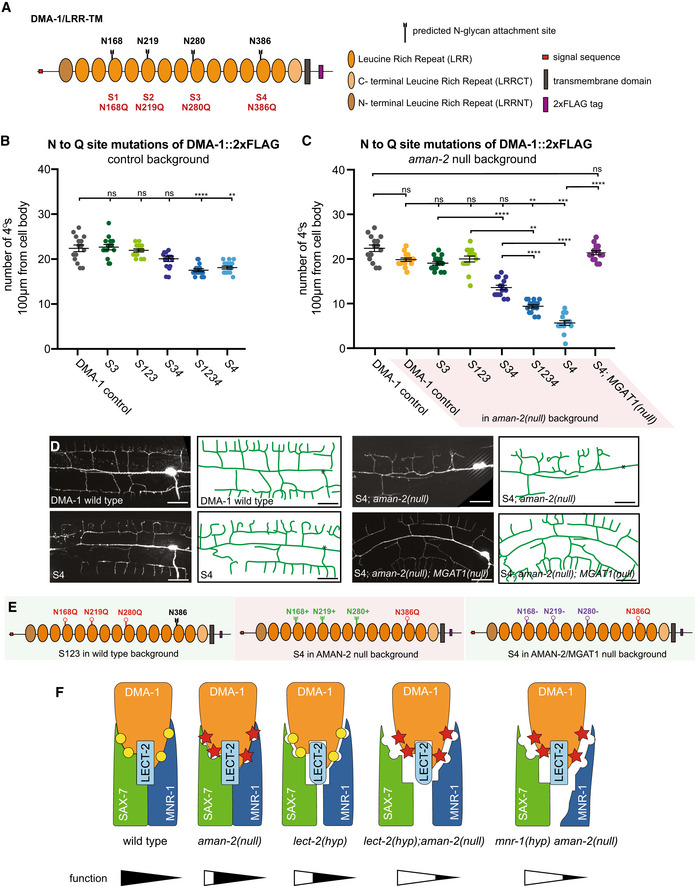
Schematic of DMA‐1/LRR‐TM with mutated N‐glycan attachment sites S1‐S4 indicated.
Quantification of the number of quaternary branches in DMA‐1::2xFLAG control animals and animals with combinations of DMA‐1::2xFLAG N‐glycan attachment sites mutated. Note that DMA‐1::2xFLAG control animals display a slightly reduced number of quaternary dendrites compared to wild‐type animals (Fig EV3C). Data are represented as mean ± SEM. Statistical significance was calculated using the Kruskal–Wallis test, and is indicated (**P ≤ 0.01, ****P ≤ 0.0001, ns = not significant). n = 15 for all genotypes and are biological replicates.
Quantification of the number of quaternary branches in DMA‐1::2xFLAG control animals alone and in combination with an aman‐2(gk248486) null mutant (shaded in red). Control data is identical as in (B) and shown for comparison only. Data are represented as mean ± SEM. Statistical significance was calculated using the Kruskal–Wallis test and Mann–Whitney between individual comparisons, and is indicated (**P ≤ 0.01, ***P ≤ 0.001, ****P ≤ 0.0001, ns = not significant). n = 15 for all genotypes and are biological replicates.
Fluorescent images (left) and tracings (center) of PVD in animals of denoted backgrounds (aman‐2(null) is gk248486). S4 corresponds to the endogenous alteration of N‐glycan attachment site N386 of DMA‐1. PVD is visualized by the dzIs117 transgene. The cell body is marked with an asterisk. Scale bars represent 20 μm.
The schematics on the right detail the molecular context of the indicated backgrounds. Green indicates a relatively normal PVD structure and red a heavily defective arborization. Black attachments indicate wild‐type, red indicate blocked sites, green indicates abnormal N‐glycans chains, and purple indicates presumably incomplete but present N‐glycan chains.
Proposed model of how the function of the Menorin complex could be modulated by complex stability. Note that other mechanisms are possible (see discussion). Yellow circles represent normal N‐glycan chains, while red stars represent abnormal N‐glycans in aman‐2 mutant animals. Putative level of functionality is indicated below.
References
-
- Apweiler R, Hermjakob H, Sharon N (1999) On the frequency of protein glycosylation, as deduced from analysis of the SWISS‐PROT database. Biochim Biophys Acta 1473: 4–8 - PubMed
-
- Bülow HE, Hobert O (2006) The molecular diversity of glycosaminoglycans shapes animal development. Ann Rev Cell Dev Biol 22: 375–407 - PubMed
Publication types
MeSH terms
Substances
Grants and funding
LinkOut - more resources
Full Text Sources
Research Materials
