T-cell-derived Hodgkin lymphoma has motility characteristics intermediate between Hodgkin and anaplastic large cell lymphoma
- PMID: 35586951
- PMCID: PMC9189347
- DOI: 10.1111/jcmm.17389
T-cell-derived Hodgkin lymphoma has motility characteristics intermediate between Hodgkin and anaplastic large cell lymphoma
Abstract
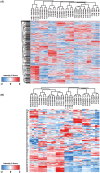
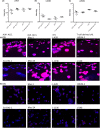
Classic Hodgkin lymphoma (cHL) is usually characterized by a low tumour cell content, derived from crippled germinal centre B cells. Rare cases have been described in which the tumour cells show clonal T-cell receptor rearrangements. From a clinicopathological perspective, it is unclear if these cases should be classified as cHL or anaplastic large T-cell lymphoma (ALCL). Since we recently observed differences in the motility of ALCL and cHL tumour cells, here, we aimed to obtain a better understanding of T-cell-derived cHL by investigating their global proteomic profiles and their motility. In a proteomics analysis, when only motility-associated proteins were regarded, T-cell-derived cHL cell lines showed the highest similarity to ALK- ALCL cell lines. In contrast, T-cell-derived cHL cell lines presented a very low overall motility, similar to that observed in conventional cHL. Whereas all ALCL cell lines, as well as T-cell-derived cHL, predominantly presented an amoeboid migration pattern with uropod at the rear, conventional cHL never presented with uropods. The migration of ALCL cell lines was strongly impaired upon application of different inhibitors. This effect was less pronounced in cHL cell lines and almost invisible in T-cell-derived cHL. In summary, our cell line-derived data suggest that based on proteomics and migration behaviour, T-cell-derived cHL is a neoplasm that shares features with both cHL and ALCL and is not an ALCL with low tumour cell content. Complementary clinical studies on this lymphoma are warranted.
Keywords: Hodgkin lymphoma; anaplastic large cell lymphoma; motility.
© 2022 The Authors. Journal of Cellular and Molecular Medicine published by Foundation for Cellular and Molecular Medicine and John Wiley & Sons Ltd.
Conflict of interest statement
The authors do not report any conflict of interest.
Figures


Similar articles
-
The histologic, immunohistochemical, and genetic features of classical Hodgkin lymphoma and anaplastic large cell lymphoma with aberrant T-cell/B-cell antigen expression.Hum Pathol. 2019 Feb;84:309-320. doi: 10.1016/j.humpath.2018.10.003. Epub 2018 Oct 17. Hum Pathol. 2019. PMID: 30339972
-
Gene expression profiling of isolated tumour cells from anaplastic large cell lymphomas: insights into its cellular origin, pathogenesis and relation to Hodgkin lymphoma.Leukemia. 2009 Nov;23(11):2129-38. doi: 10.1038/leu.2009.161. Epub 2009 Aug 6. Leukemia. 2009. PMID: 19657361
-
Migration Properties Distinguish Tumor Cells of Classical Hodgkin Lymphoma from Anaplastic Large Cell Lymphoma Cells.Cancers (Basel). 2019 Oct 2;11(10):1484. doi: 10.3390/cancers11101484. Cancers (Basel). 2019. PMID: 31581676 Free PMC article.
-
PD-1/PD-L1 Pathway and Its Blockade in Patients with Classic Hodgkin Lymphoma and Non-Hodgkin Large-Cell Lymphomas.Curr Hematol Malig Rep. 2020 Aug;15(4):372-381. doi: 10.1007/s11899-020-00589-y. Curr Hematol Malig Rep. 2020. PMID: 32394185 Review.
-
CD30(+) anaplastic large cell lymphoma: a review of its histopathologic, genetic, and clinical features.Blood. 2000 Dec 1;96(12):3681-95. Blood. 2000. PMID: 11090048 Review.
Cited by
-
Cooperative polarization of MCAM/CD146 and ERM family proteins in melanoma.Mol Biol Cell. 2024 Mar 1;35(3):ar31. doi: 10.1091/mbc.E23-06-0255. Epub 2023 Dec 20. Mol Biol Cell. 2024. PMID: 38117590 Free PMC article.
-
The RHOA Mutation G17V Does Not Lead to Increased Migration of Human Malignant T Cells but Is Associated with Matrix Remodelling.Cancers (Basel). 2023 Jun 17;15(12):3226. doi: 10.3390/cancers15123226. Cancers (Basel). 2023. PMID: 37370838 Free PMC article.
-
Migration Dynamics of Human NK Cell Preparations in Microchannels and Their Invasion Into Patient-Derived Tissue.J Cell Mol Med. 2025 Apr;29(7):e70481. doi: 10.1111/jcmm.70481. J Cell Mol Med. 2025. PMID: 40159644 Free PMC article.
-
EZB-type diffuse large B-cell lymphoma cell lines have superior migration capabilities compared to MCD-type.Br J Haematol. 2024 Dec;205(6):2327-2337. doi: 10.1111/bjh.19778. Epub 2024 Oct 2. Br J Haematol. 2024. PMID: 39355919 Free PMC article.
References
-
- Stein H, Herbst H, Anagnostopoulos I, et al. The nature of Hodgkin and Reed‐Sternberg cells, their association with EBV, and their relationship to anaplastic large‐cell lymphoma. Ann Oncol. 1991;2(Suppl 2):33‐38. - PubMed
-
- Ferreri AJ, Govi S, Pileri SA, et al. Anaplastic large cell lymphoma, ALK‐negative. Crit Rev Oncol Hematol. 2012. - PubMed
-
- Schwering I, Bräuninger A, Klein U, et al. Loss of the B‐lineage‐specific gene expression program in Hodgkin and Reed‐Sternberg cells of Hodgkin lymphoma. Blood. 2003;101:1505‐1512. - PubMed
-
- Bonzheim I, Geissinger E, Roth S, et al. Anaplastic large cell lymphomas lack the expression of T‐cell receptor molecules or molecules of proximal T‐cell receptor signaling. Blood. 2004;104:3358‐3360. - PubMed
Publication types
MeSH terms
Grants and funding
LinkOut - more resources
Full Text Sources
Medical
Molecular Biology Databases

