. 2022 Jul;16(14):2672-2692.
doi: 10.1002/1878-0261.13228. Epub 2022 Jun 7.

In-depth proteomics characterization of ∆Np73 effectors identifies key proteins with diagnostic potential implicated in lymphangiogenesis, vasculogenesis and metastasis in colorectal cancer

Affiliations

In-depth proteomics characterization of ∆Np73 effectors identifies key proteins with diagnostic potential implicated in lymphangiogenesis, vasculogenesis and metastasis in colorectal cancer

María Garranzo-Asensio et al. Mol Oncol. 2022 Jul.

Abstract

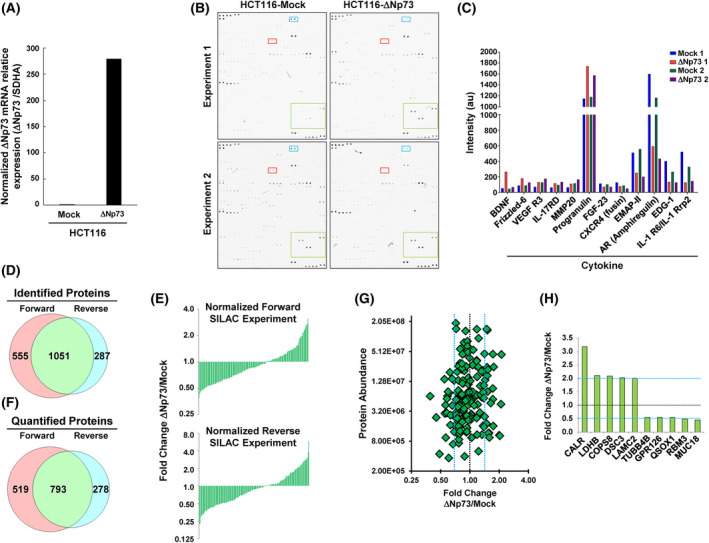
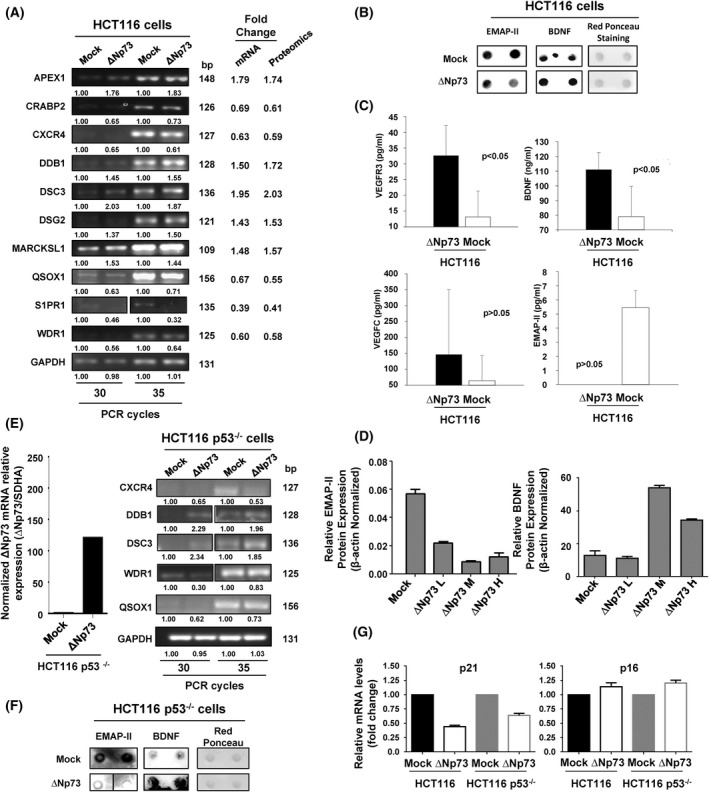
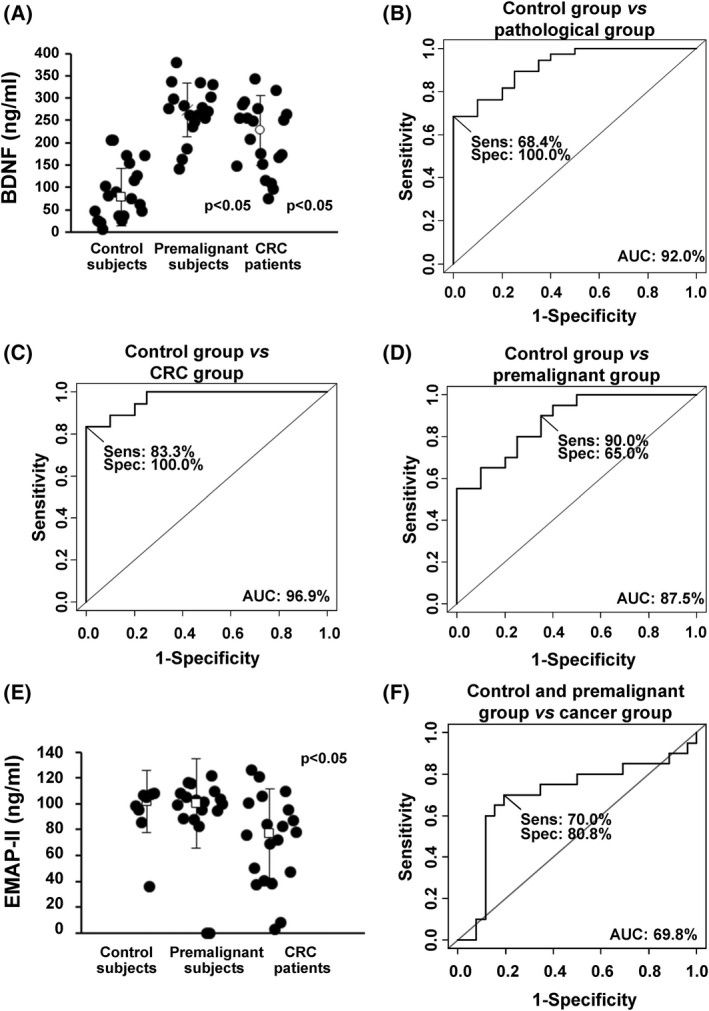
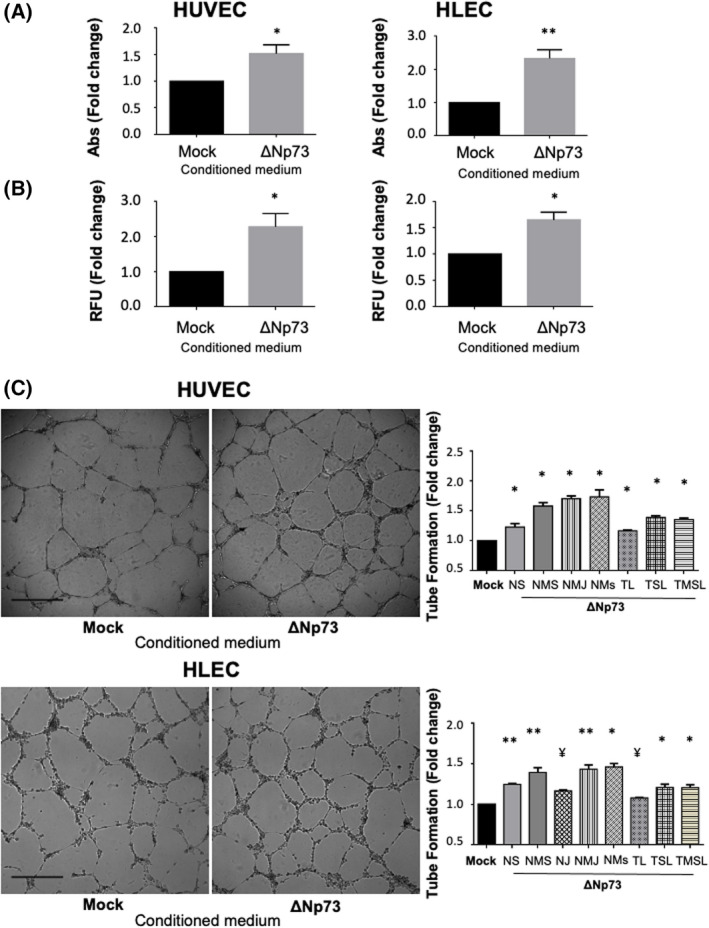
Colorectal cancer (CRC) is the third most common cancer and the second leading cause of cancer-related death worldwide. Alterations in proteins of the p53-family are a common event in CRC. ΔNp73, a p53-family member, shows oncogenic properties and its effectors are largely unknown. We performed an in-depth proteomics characterization of transcriptional control by ∆Np73 of the secretome of human colon cancer cells and validated its clinical potential. The secretome was analyzed using high-density antibody microarrays and stable isotopic metabolic labeling. Validation was performed by semiquantitative PCR, ELISA, dot-blot and western blot analysis. Evaluation of selected effectors was carried out using 60 plasma samples from CRC patients, individuals carrying premalignant colorectal lesions and colonoscopy-negative controls. In total, 51 dysregulated proteins were observed showing at least 1.5-foldchange in expression. We found an important association between the overexpression of ∆Np73 and effectors related to lymphangiogenesis, vasculogenesis and metastasis, such as brain-derived neurotrophic factor (BDNF) and the putative aminoacyl tRNA synthase complex-interacting multifunctional protein 1 (EMAP-II)-vascular endothelial growth factor C-vascular endothelial growth factor receptor 3 axis. We further demonstrated the usefulness of BDNF as a potential CRC biomarker able to discriminate between CRC patients and premalignant individuals from controls with high sensitivity and specificity.

Keywords: colorectal cancer; in-depth proteomics; lymphangiogenesis; secretome; ∆Np73 effectors.


Conflict of interest statement

The authors declare no conflict of interest.

Figures

Fig. 1
Fig. 1
The overexpression of ∆Np73 in CRC cells produced the dysregulation of cytokines, growth factors, cell signaling proteins, and proteins related to tumorigenesis, metastasis and cell–cell adhesion as determined by antibody microarrays and SILAC quantitative proteomic analyses. (A) Confirmation by qPCR of the overexpression of ∆Np73 in stably transfected HCT116 CRC cells in comparison to mock control cells. Triplicates were analyzed (n = 3). (B) The secretome of two different biological replicates of HCT116‐∆Np73 CRC cells and mock control cells was analyzed using L‐series antibody microarrays. (C) Microarrays were incubated with biotin‐labeled samples followed with Cy3‐streptavidin, and differential expression for proteins due to ∆Np73 overexpression was found in both biological replicates. a.u., arbitrary units. (D) For the SILAC approach, protein extracts from the conditioned media from metabolically labeled HCT116‐∆Np73 and mock cells were mixed 1 : 1 to perform forward and reverse experiments and run on SDS‐polyacrylamide gels. A total of 8730 and 6862 peptides in forward and reverse experiments were found, resulting in 1586 and 1338 identified proteins, respectively, with 1051 proteins in common in both experiments. (E, F) After data normalization using the 5% trimmed mean (E), 1590 proteins were quantified in both SILAC experiments (F), with 793 proteins quantified in common. (G) A total of 37 dysregulated proteins by ∆Np73 identified in the secretome of HCT116 cells with variability ≤ 20%, and fold‐change ≥ 1.5. At least two peptides in both biological replicates, with 19 and 18 up‐ and down‐regulated proteins, respectively, were observed. (H) The top 10 dysregulated proteins observed by SILAC were represented by a bar‐graph.
Fig. 2
Fig. 2
Validation of ∆Np73‐dysregulated proteins. Validation of the dysregulated proteins found was carried out using different methodologies. (A) Dysregulation of selected genes due to the stably overexpression of ∆Np73 was firstly confirmed by PCR in comparison to stably transfected mock control cells. The image is representative of four different experiments where 30 or 35 PCR cycles were performed. GAPDH was used as control of the assay. bp, base pair. (B) At protein level, the dysregulation of BDNF, and EMAP‐II was verified in the conditioned media of HCT116 mock control cells by dot‐blot. Red Ponceau staining was used as loading control. Two independent biological replicates were measured for each condition assessed. (C) Quantification of BDNF, VEGFC, and VEGFR3 in the conditioned medium or EMAP‐II in cell extracts was performed by ELISA. One‐tailed Student's t‐test was performed. All values are expressed as median ± standard deviation. Significant data were determined for VEGFR3 and BDNF, and almost significant for EMAP‐II (P = 0.06635). (D) Dysregulation of EMAP‐II and BDNF was also verified by WB, using β‐actin as loading control. Quantification data is shown. L, low; M, medium; H, high are referred to the ∆Np73 levels after cell sorting of HCT‐116 CRC cells, where a lower (EMAP‐II) or higher (BDNF) expression is observed according to the expression of ∆Np73. All results either at mRNA or protein level showed consistency with the alterations observed by proteomics. Triplicates were analyzed with Mann–Whitney U‐test. Error bars indicate standard deviation. (E) Left, confirmation by qPCR of the overexpression of ∆Np73 in stably transfected HCT116 p53−/− CRC cells in comparison to mock control cells. Right, dysregulation of selected genes due to stably overexpression of ∆Np73 in HCT116 cells was confirmed by PCR in HCT116 p53−/− cells in comparison to stably transfected mock control cells to demonstrate the presence of p53 was not affecting their dysregulation. The image is representative of four different experiments where 30 or 35 PCR cycles were performed. GAPDH was used as control of the assay. (F) The dysregulation of BDNF and EMAP‐II was also confirmed in the conditioned media of mock control and ∆Np73‐HCT116 p53−/− cells by dot‐blot. Red Ponceau staining was used as loading control. Two independent biological replicates were measured for each condition assessed. (G) Dysregulation of the p53 target genes p21 and p16 in HCT116 and HCT116 p53−/− ∆Np73 and mock control cells was analyzed by qPCR. Data were normalized with SDHA as reference gene. Triplicates were analyzed with Mann–Whitney U‐test. Error bars indicate standard deviation.
Fig. 3
Fig. 3
Evaluation of the plasma biomarker potential of selected identified proteins. (A) Quantification of BDNF using commercially available ELISAs in serum from control subjects, premalignant individuals, and CRC patients (n = 20 for each group). All values are expressed as median ± standard deviation. One‐tailed Student's t‐test was performed. (B–D) Determination of the BDNF value as discriminating plasma biomarker between control individuals and pathological subjects was carried out though ROC curves calculating their individual (B, C) and combined AUC (D). Sens, sensitivity; Spec, specificity. (E) Quantification of EMAP‐II using commercially available ELISAs in serum from control subjects (n = 8), premalignant individuals (n = 20), and CRC patients (n = 20). All values are expressed as median ± standard deviation. One‐tailed Student's t‐test was performed. (F) Determination of the EMAP‐II value as discriminating plasma biomarker between control + premalignant group and cancer group was carried out though ROC curves calculating AUC. BDNF and EMAP‐II plasma levels significantly discriminated between control and premalignant and CRC patients (P < 0.05).
Fig. 4
Fig. 4
ΔNp73 promotes angiogenesis and lymphangiogenesis in vitro. (A–C) HUVEC and HLEC primary cells were treated with conditioned media from HCT116‐Mock and HCT116‐ΔNp73 colon cancer cells. (A) Proliferation potential performed with the MTT assay. Five replicates of each experimental condition were measured and analyzed with Mann–Whitney U‐test. Error bars indicate standard deviation. (B) Invasion capacity measured with a Transwell system using Matrigel as barrier. Five replicates of each experimental condition were measured and analyzed with Mann–Whitney U‐test. Error bars indicate standard deviation. (C) Cell tube formation (scale bar = 500 μm). The parameters recorded are NS (number of segments); NMS (number of master segments); NJ (number of junctions); NMJ (number of master junctions); NMs (number of meshes); TL (total length); TSL (total segment length); TMSL (total master segment length). Five replicates of each experimental condition were measured and analyzed with Mann–Whitney U‐test. Error bars indicate standard deviation. Statistical significance: *P < 0.05; **P < 0.01; ¥P = 0,06; RFU, fluorescence arbitrary units; Abs, absorbance.
Fig. 5
Fig. 5
BDNF and EMAP‐II silencing effects on endothelial and lymphatic vasculature. (A) BDNF (left) and EMAP‐II (right) relative expression of HCT116‐ΔNp73 cells transiently transfected with a control siRNA (Scr) or a siRNA against BDNF (siBDNF) or EMAP‐II (siEMAP‐II). The efficiency of the siBDNF and siEMAP‐II was around 75% and 85%, respectively. (B, C) Tube formation assay (scale bar = 500 μm) in HUVEC and HLEC cells exposed to conditioned medium of HCT116‐∆Np73 treated with Scr or siBDNF or siEMAPII. The parameters recorded are NS (number of segments); NMS (number of master segments); NJ (number of junctions); NMJ (number of master junctions); NMs (number of meshes); TL (total length); TSL (total segment length); TMSL (total master segment length). Five replicates of each experimental condition were measured and analyzed with Mann–Whitney U test. Error bars indicate standard deviation. Statistical significance: *P < 0.05; **P < 0.01.

Similar articles

Cited by

References

    1. Rodriguez‐Salas N, Dominguez G, Barderas R, Mendiola M, Garcia‐Albeniz X, Maurel J, et al. Clinical relevance of colorectal cancer molecular subtypes. Crit Rev Oncol Hematol. 2017;109:9–19. - PubMed
    1. Lambert AW, Pattabiraman DR, Weinberg RA. Emerging biological principles of metastasis. Cell. 2017;168(4):670–91. - PMC - PubMed
    1. Rodriguez N, Pelaez A, Barderas R, Dominguez G. Clinical implications of the deregulated TP73 isoforms expression in cancer. Clin Transl Oncol. 2018;20:827–36. - PubMed
    1. Irwin MS, Kaelin WG. p53 family update: p73 and p63 develop their own identities. Cell Growth Differ. 2001;12(7):337–49. - PubMed
    1. Jost CA, Marin MC, Kaelin WG Jr. p73 is a simian [correction of human] p53‐related protein that can induce apoptosis. Nature. 1997;389(6647):191–4. - PubMed

Publication types

MeSH terms

Substances