

Methods for Communicating the Impact of Parameter Uncertainty in a Multiple-Strategies Cost-Effectiveness Comparison
- PMID: 35587181
- PMCID: PMC9452448
- DOI: 10.1177/0272989X221100112
Methods for Communicating the Impact of Parameter Uncertainty in a Multiple-Strategies Cost-Effectiveness Comparison
Abstract
Purpose: Analyzing and communicating uncertainty is essential in medical decision making. To judge whether risks are acceptable, policy makers require information on the expected outcomes but also on the uncertainty and potential losses related to the chosen strategy. We aimed to compare methods used to represent the impact of uncertainty in decision problems involving many strategies, enhance existing methods, and provide an open-source and easy-to-use tool.
Methods: We conducted a systematic literature search to identify methods used to represent the impact of uncertainty in cost-effectiveness analyses comparing multiple strategies. We applied the identified methods to probabilistic sensitivity analysis outputs of 3 published decision-analytic models comparing multiple strategies. Subsequently, we compared the following characteristics: type of information conveyed, use of a fixed or flexible willingness-to-pay threshold, output interpretability, and the graphical discriminatory ability. We further proposed adjustments and integration of methods to overcome identified limitations of existing methods.
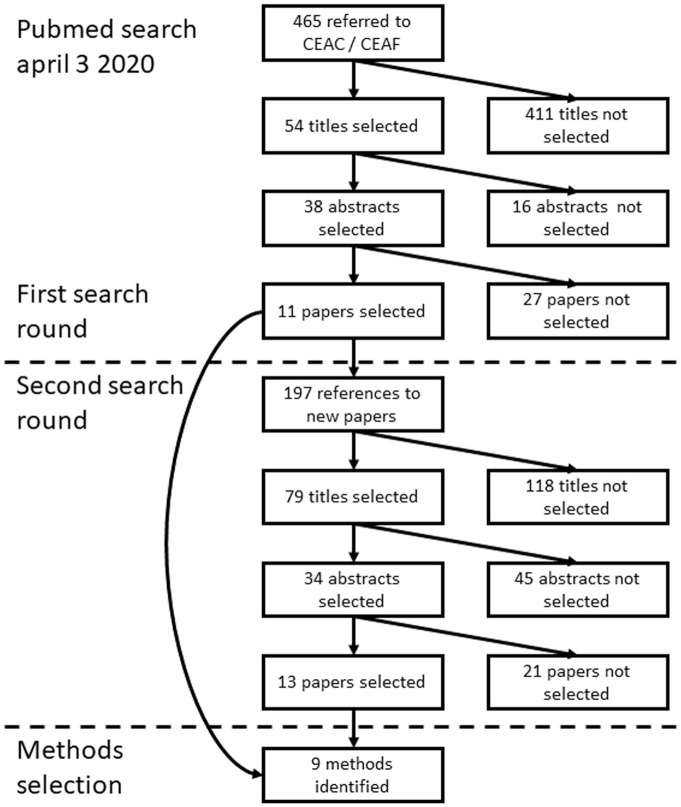
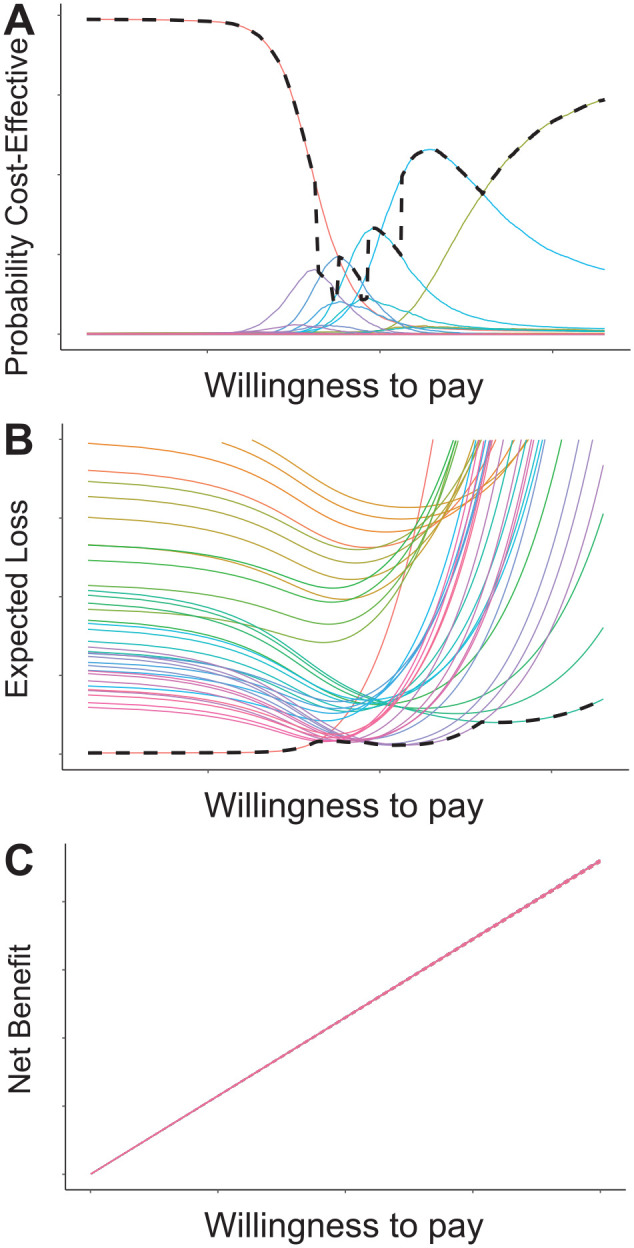
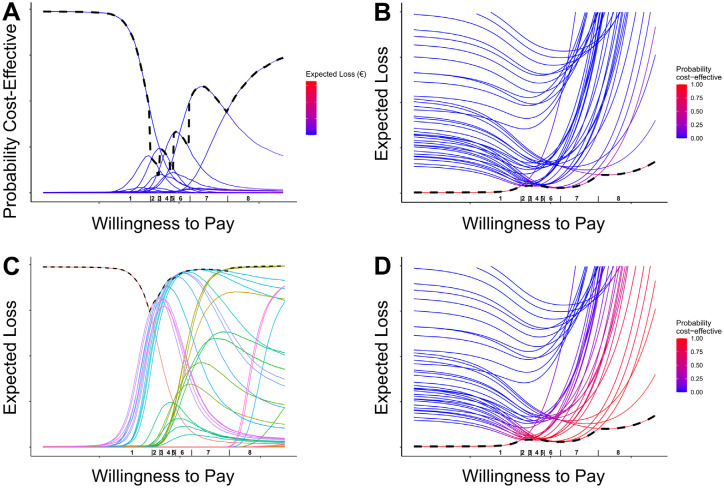
Results: The literature search resulted in the selection of 9 methods. The 3 methods with the most favorable characteristics to compare many strategies were 1) the cost-effectiveness acceptability curve (CEAC) and cost-effectiveness acceptability frontier (CEAF), 2) the expected loss curve (ELC), and 3) the incremental benefit curve (IBC). The information required to assess confidence in a decision often includes the average loss and the probability of cost-effectiveness associated with each strategy. Therefore, we proposed the integration of information presented in an ELC and CEAC into a single heat map.
Conclusions: This article presents an overview of methods presenting uncertainty in multiple-strategy cost-effectiveness analyses, with their strengths and shortcomings. We proposed a heat map as an alternative method that integrates all relevant information required for health policy and medical decision making.
Highlights: To assess confidence in a chosen course of action, decision makers require information on both the probability and the consequences of making a wrong decision.This article contains an overview of methods for presenting uncertainty in multiple-strategy cost-effectiveness analyses.We propose a heat map that combines the probability of cost-effectiveness from the cost-effectiveness acceptability curve (CEAC) with the consequences of a wrong decision from the expected loss curve.Collapsing of the CEAC can be reduced by relaxing the CEAC, as proposed in this article.Code in Microsoft Excel and R is provided to easily analyze data using the methods discussed in this article.
Keywords: CEA; CEAC; ELC; PSA; many strategies; sensitivity analysis.
Conflict of interest statement
The authors declared no potential conflicts of interest with respect to the research, authorship, and/or publication of this article. The author(s) received no financial support for the research, authorship, and/or publication of this article.
Figures
Similar articles
-
Optimal cost-effectiveness decisions: the role of the cost-effectiveness acceptability curve (CEAC), the cost-effectiveness acceptability frontier (CEAF), and the expected value of perfection information (EVPI).Value Health. 2008 Sep-Oct;11(5):886-97. doi: 10.1111/j.1524-4733.2008.00358.x. Epub 2008 May 16. Value Health. 2008. PMID: 18489513
-
"Time Traveling Is Just Too Dangerous" but Some Methods Are Worth Revisiting: The Advantages of Expected Loss Curves Over Cost-Effectiveness Acceptability Curves and Frontier.Value Health. 2019 May;22(5):611-618. doi: 10.1016/j.jval.2019.02.008. Value Health. 2019. PMID: 31104743 Free PMC article.
-
Limitations of acceptability curves for presenting uncertainty in cost-effectiveness analysis.Med Decis Making. 2007 Mar-Apr;27(2):101-11. doi: 10.1177/0272989X06297394. Med Decis Making. 2007. PMID: 17409361
-
A methodological guide for implementing and interpreting results of probabilistic analysis.Expert Rev Pharmacoecon Outcomes Res. 2025 Feb;25(2):123-135. doi: 10.1080/14737167.2024.2416255. Epub 2024 Oct 21. Expert Rev Pharmacoecon Outcomes Res. 2025. PMID: 39431603 Review.
-
When is enough evidence enough? - Using systematic decision analysis and value-of-information analysis to determine the need for further evidence.Z Evid Fortbild Qual Gesundhwes. 2013;107(9-10):575-84. doi: 10.1016/j.zefq.2013.10.020. Epub 2013 Nov 12. Z Evid Fortbild Qual Gesundhwes. 2013. PMID: 24315327 Review.
Cited by
-
Net Monetary Benefit Lines Augmented with Value-of-Information Measures to Present the Results of Economic Evaluations under Uncertainty.Med Decis Making. 2024 Oct;44(7):770-786. doi: 10.1177/0272989X241262343. Epub 2024 Jul 26. Med Decis Making. 2024. PMID: 39056310 Free PMC article.
-
Response to uncertainty management in regulatory and health technology assessment decision-making on drugs: guidance of the HTAi-DIA Working Group - author's reply.Int J Technol Assess Health Care. 2023 Dec 18;40(1):e1. doi: 10.1017/S0266462323002817. Int J Technol Assess Health Care. 2023. PMID: 38108142 Free PMC article. No abstract available.
-
Cost-effectiveness of HIV pre-exposure prophylaxis among female sex workers in Iran.Sci Rep. 2025 Mar 5;15(1):7747. doi: 10.1038/s41598-025-92099-1. Sci Rep. 2025. PMID: 40044976 Free PMC article.
-
Response to "UNCERTAINTY MANAGEMENT IN REGULATORY AND HEALTH TECHNOLOGY ASSESSMENT DECISION-MAKING ON DRUGS: GUIDANCE OF THE HTAi-DIA WORKING GROUP".Int J Technol Assess Health Care. 2023 Oct 12;39(1):e70. doi: 10.1017/S026646232300260X. Int J Technol Assess Health Care. 2023. PMID: 37822085 Free PMC article. No abstract available.
-
A Guide to an Iterative Approach to Model-Based Decision Making in Health and Medicine: An Iterative Decision-Making Framework.Pharmacoeconomics. 2024 Apr;42(4):363-371. doi: 10.1007/s40273-023-01341-z. Epub 2023 Dec 29. Pharmacoeconomics. 2024. PMID: 38157129
References
-
- Briggs AH, Weinstein MC, Fenwick EA, et al.. Model parameter estimation and uncertainty analysis: a report of the ISPOR-SMDM Modeling Good Research Practices Task Force Working Group–6. Med Decis Making. 2012;32:722–32. - PubMed
-
- Briggs A, Sculpher M, Claxton K. Decision Modelling for Health Economic Evaluation. Oxford (UK): Oxford University Press; 2006.
Publication types
MeSH terms
Grants and funding
LinkOut - more resources
Full Text Sources
Research Materials
Miscellaneous
