Trends in Cancer Mortality Among Black Individuals in the US From 1999 to 2019
- PMID: 35587341
- PMCID: PMC9121301
- DOI: 10.1001/jamaoncol.2022.1472
Trends in Cancer Mortality Among Black Individuals in the US From 1999 to 2019
Abstract
Importance: Cancer is the second leading cause of mortality in the US. Despite national decreases in cancer mortality, Black individuals continue to have the highest cancer death rates.
Objective: To examine national trends in cancer mortality from 1999 to 2019 among Black individuals by demographic characteristics and to compare cancer death rates in 2019 among Black individuals with rates in other racial and ethnic groups.
Design, setting, and participants: This serial cross-sectional study used US national death certificate data obtained from the National Center for Health Statistics and included all cancer deaths among individuals aged 20 years or older from January 1999 to December 2019. Data were analyzed from June 2021 to January 2022.
Exposures: Age, sex, and race and ethnicity.
Main outcomes and measures: Trends in age-standardized mortality rates and average annual percent change (AAPC) in rates were estimated by cancer type, age, sex, and race and ethnicity.
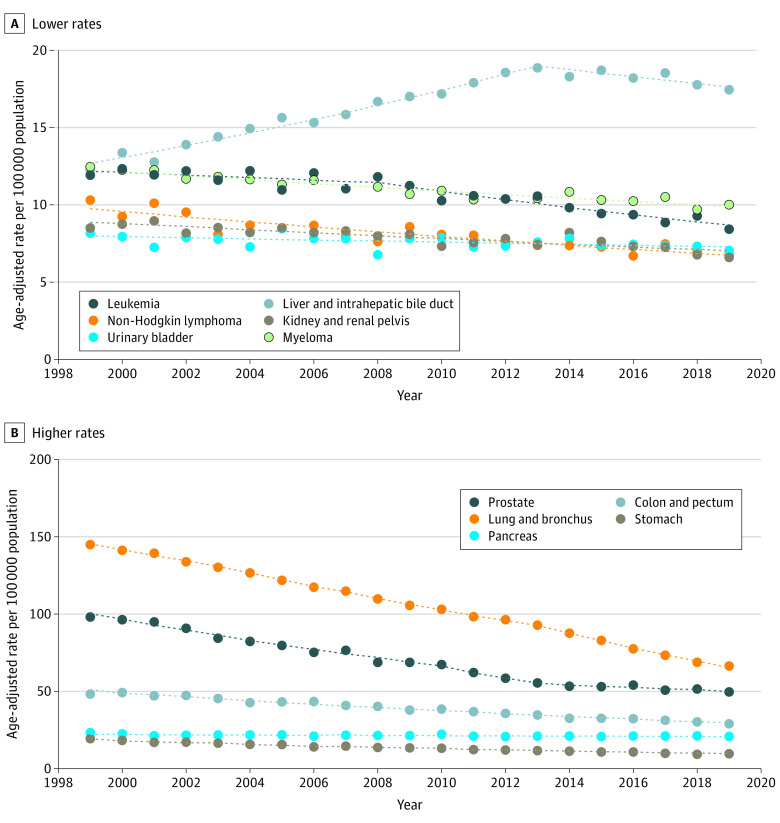
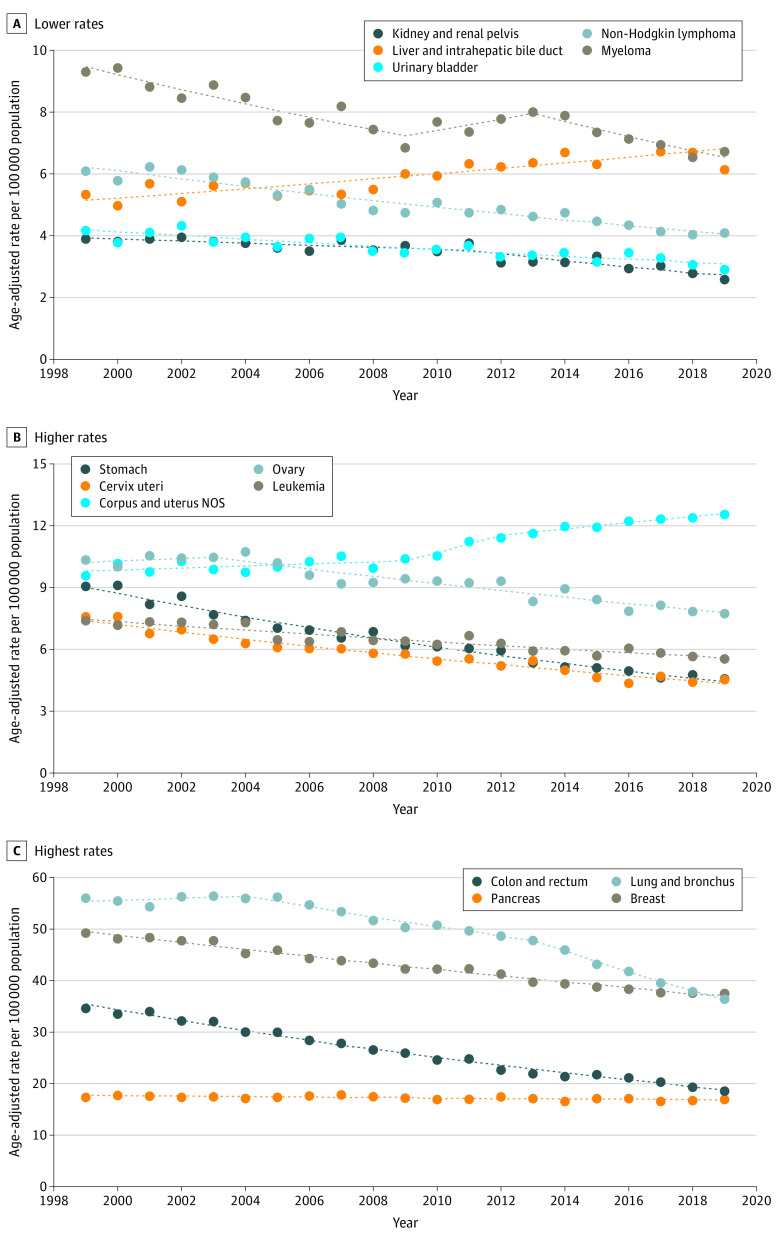
Results: From 1999 to 2019, 1 361 663 million deaths from cancer occurred among Black individuals. The overall cancer death rate significantly decreased among Black men (AAPC, -2.6%; 95% CI, -2.6% to -2.6%) and women (AAPC, -1.5%; 95% CI, -1.7% to -1.3%). Death rates decreased for most cancer types, with the greatest decreases observed for lung cancer among men (AAPC, -3.8%; 95% CI, -4.0% to -3.6%) and stomach cancer among women (AAPC, -3.4%; 95% CI, -3.6% to -3.2%). Lung cancer mortality also had the largest absolute decreases among men (-78.5 per 100 000 population) and women (-19.5 per 100 000 population). We observed a significant increase in deaths from liver cancer among men (AAPC, 3.8%; 95% CI, 3.0%-4.6%) and women (AAPC, 1.8%; 95% CI, 1.2%-2.3%) aged 65 to 79 years. There was also an increasing trend in uterus cancer mortality among women aged 35 to 49 years (2.9%; 95% CI, 2.3% to 2.6%), 50 to 64 years (2.3%; 95% CI, 2.0% to 2.6%), and 65 to 79 years (1.6%; 95% CI, 1.2% to 2.0%). In 2019, Black men and women had the highest cancer mortality rates compared with non-Hispanic American Indian/Alaska Native, Asian or Pacific Islander, and White individuals and Hispanic/Latino individuals.
Conclusions and relevance: In this cross-sectional study, there were substantial decreases in cancer death rates among Black individuals from 1999 to 2019, but higher cancer death rates among Black men and women compared with other racial and ethnic groups persisted in 2019. Targeted interventions appear to be needed to eliminate social inequalities that contribute to Black individuals having higher cancer mortality.
Conflict of interest statement
Figures
References
-
- American Lung Association . National Center for Health Statistics. National Health Interview Survey 1965-2018. 2020. November 10, 2021. https://www.lung.org/research/trends-in-lung-disease/tobacco-trends-brie...
Publication types
MeSH terms
LinkOut - more resources
Full Text Sources
Medical