

Age Distribution of All-Cause Mortality Among Children Younger Than 5 Years in Low- and Middle-Income Countries
- PMID: 35587349
- PMCID: PMC9121187
- DOI: 10.1001/jamanetworkopen.2022.12692
Age Distribution of All-Cause Mortality Among Children Younger Than 5 Years in Low- and Middle-Income Countries
Abstract
Importance: Coverage of essential child health and nutrition interventions in low- and middle-income countries remains suboptimal. Adverse exposures, such as undernutrition and infections, are particularly harmful during the 1000 days from conception until 2 years of age.
Objective: To investigate whether deaths in children younger than 5 years-which also reflect adverse exposures faced by children more broadly-are concentrated in the first 2 years after birth.
Design, setting, and participants: This cross-sectional study used a synthetic cohort probability method with Demographic and Health Surveys and Multiple Indicator Cluster Surveys from 77 low- and middle-income countries, with the earliest survey starting data collection in March 2010 and the most recent survey ending data collection in December 2019. Participants included 2 827 515 children who were younger than 5 years at any point 10 years before survey. Data were analyzed from March 11 to 21, 2022.
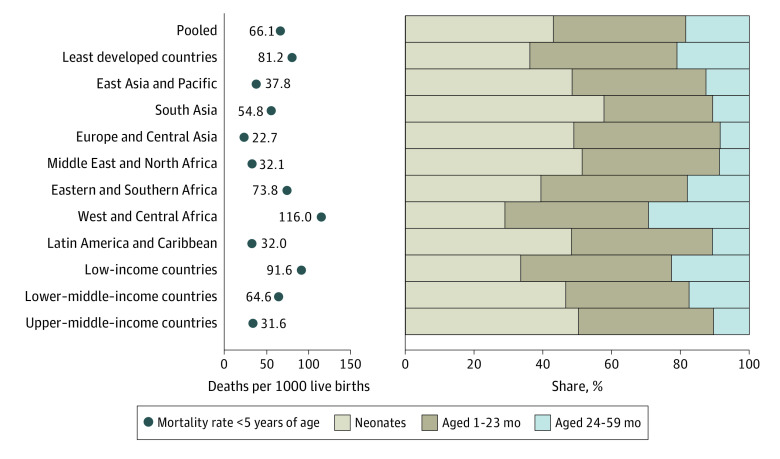
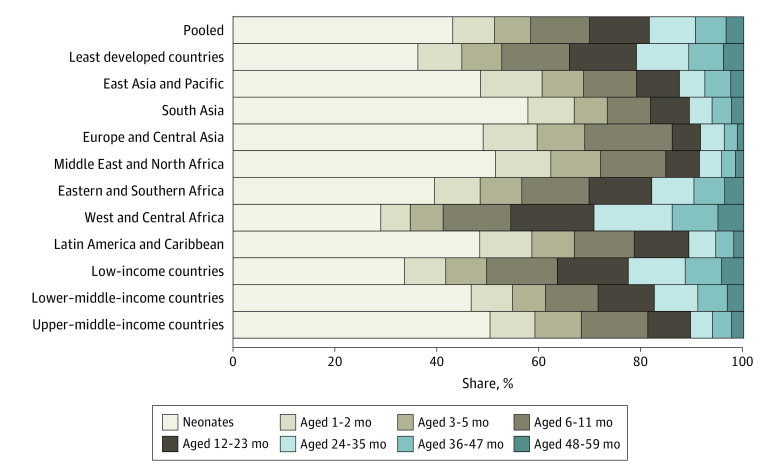
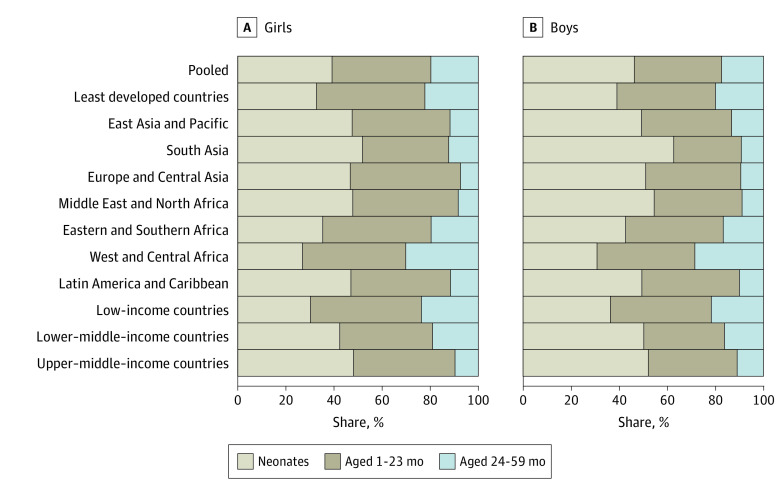
Main outcomes and measures: Share of deaths among children younger than 5 years occurring before 1 month, at 1 to 23 months, and at 24 to 59 months of age.
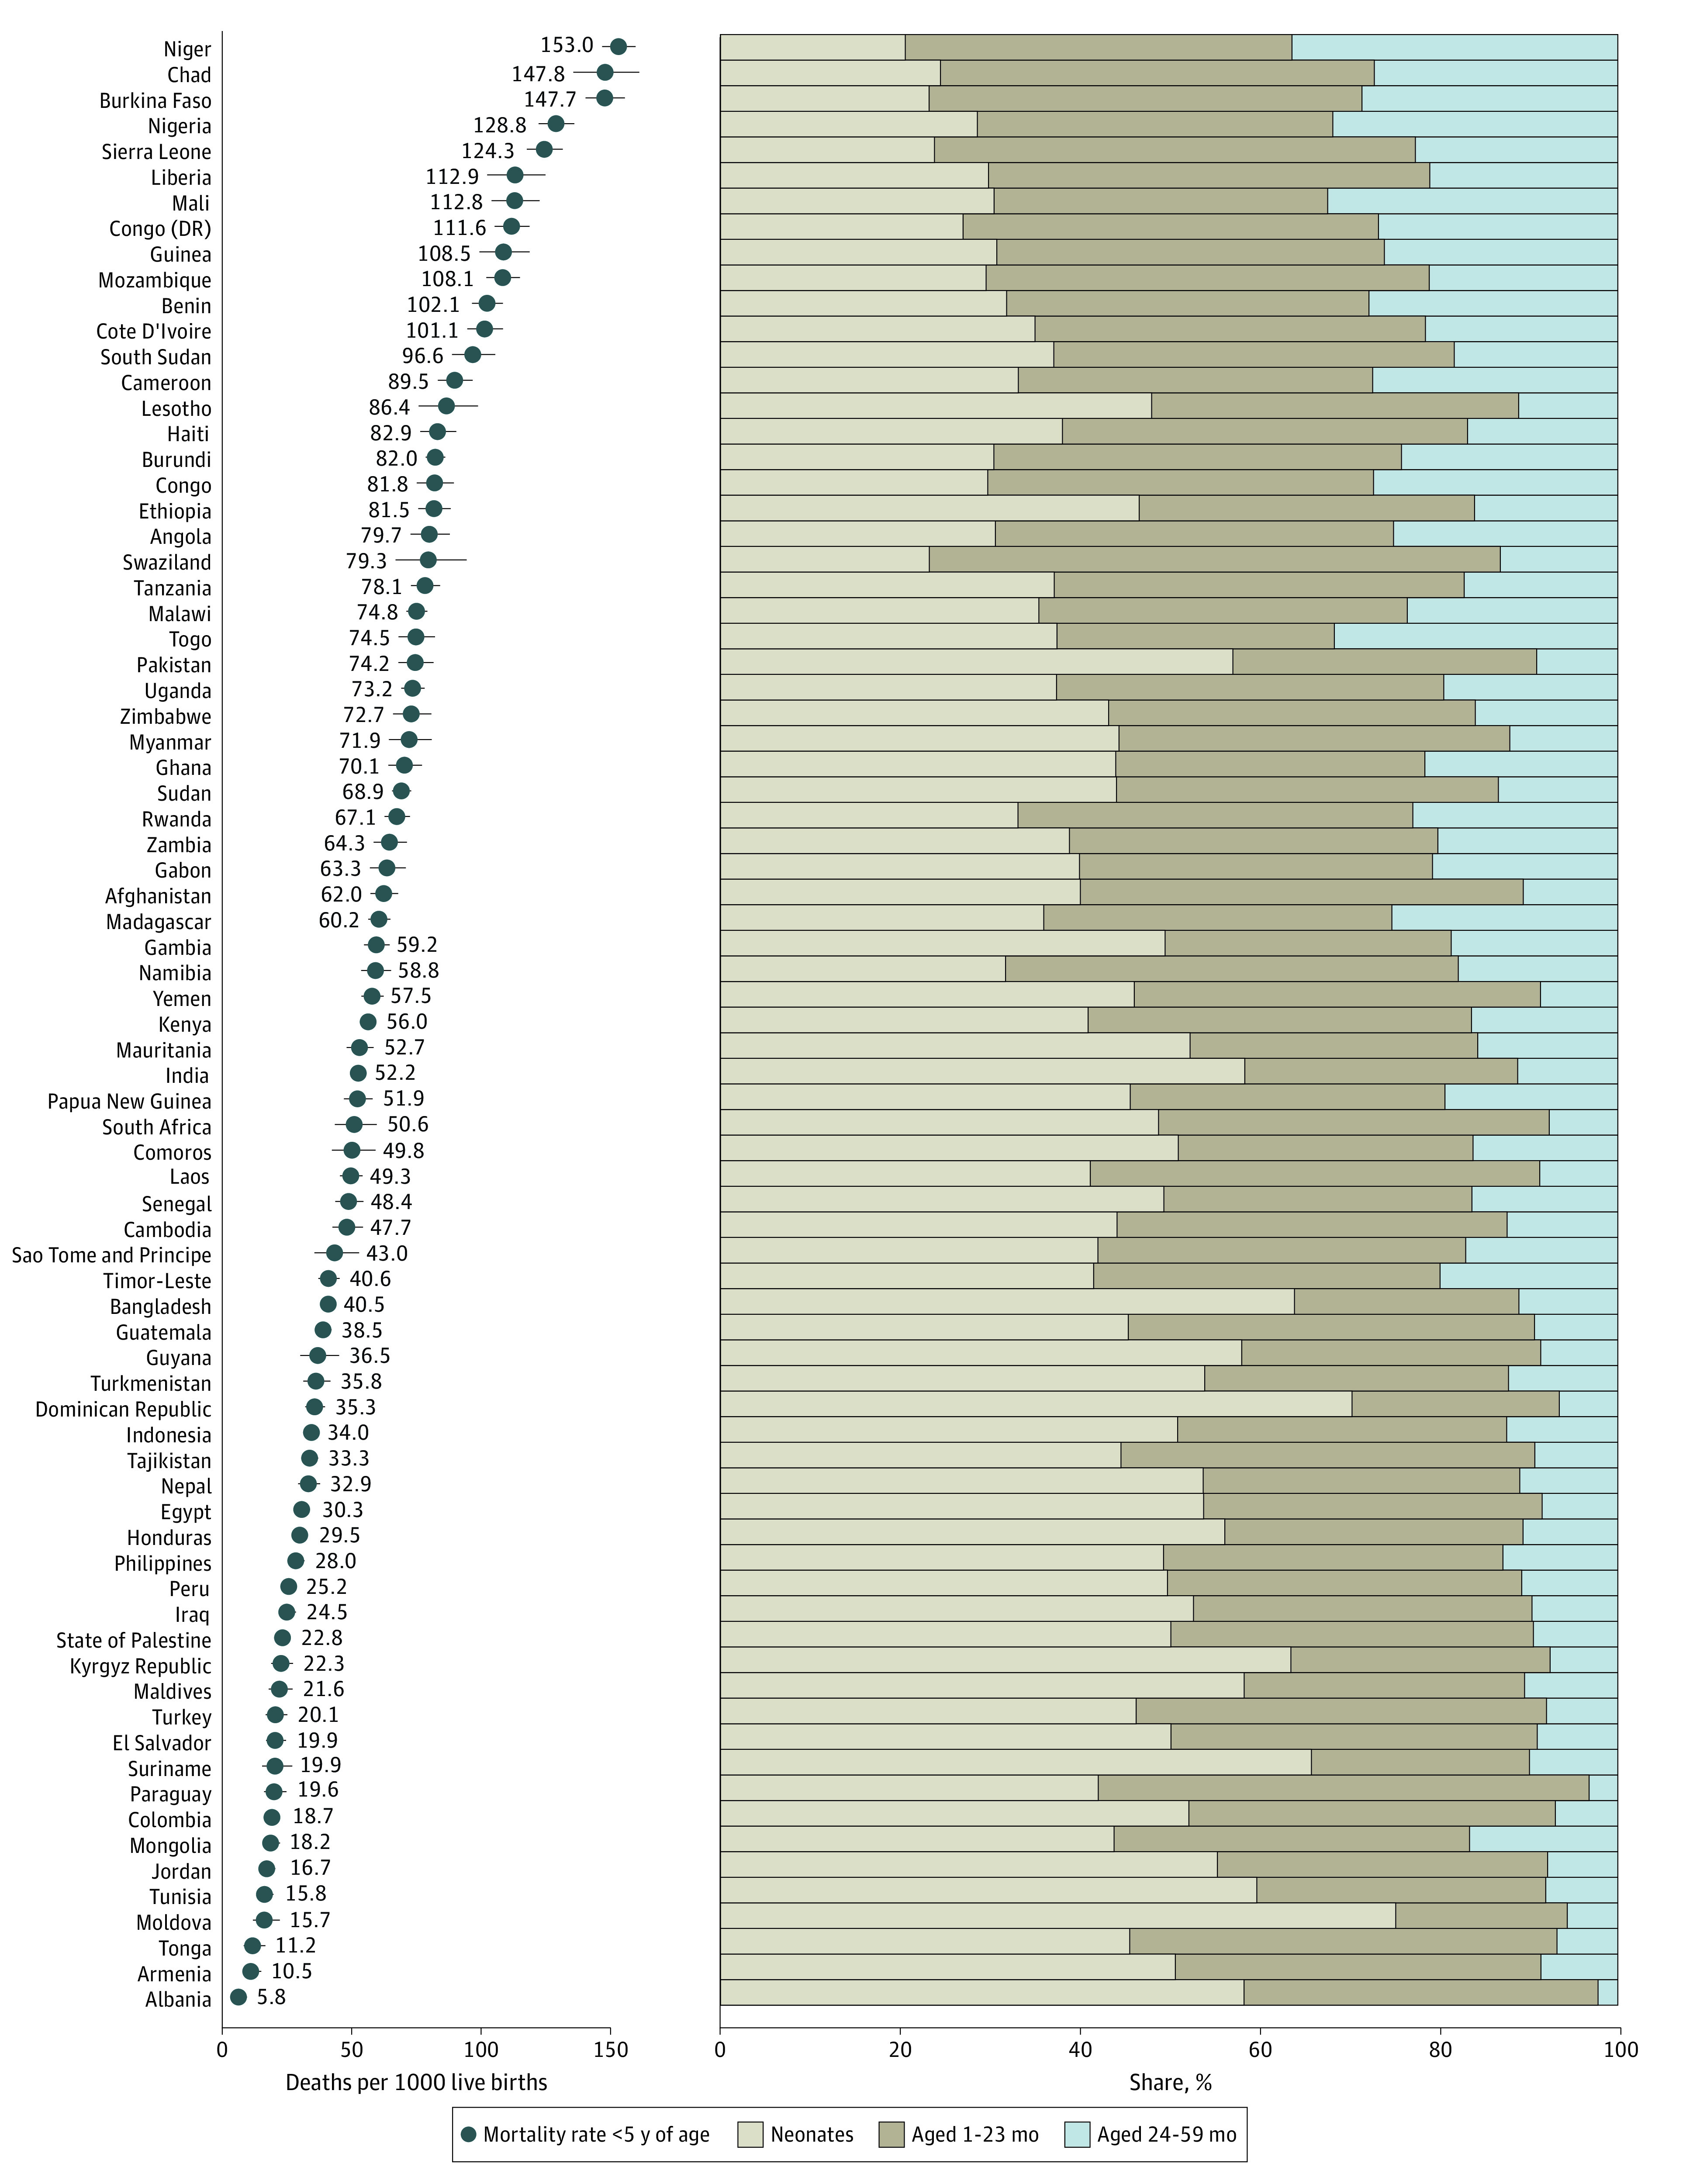
Results: Among the 2 827 515 children included in the analysis, 81.5% (95% CI, 81.0%-82.0%) of deaths occurred in the first 2 years after birth ranging from 63.7% (95% CI, 61.6%-65.7%) in Niger to 97.8% (95% CI, 85.9%-99.7%) in Albania. An estimated 18.5% (95% CI, 18.0%-19.0%) of child deaths occurred at 24 to 59 months of age. Countries with higher mortality rates among children younger than 5 years had a lower share of deaths occurring in the neonatal period.
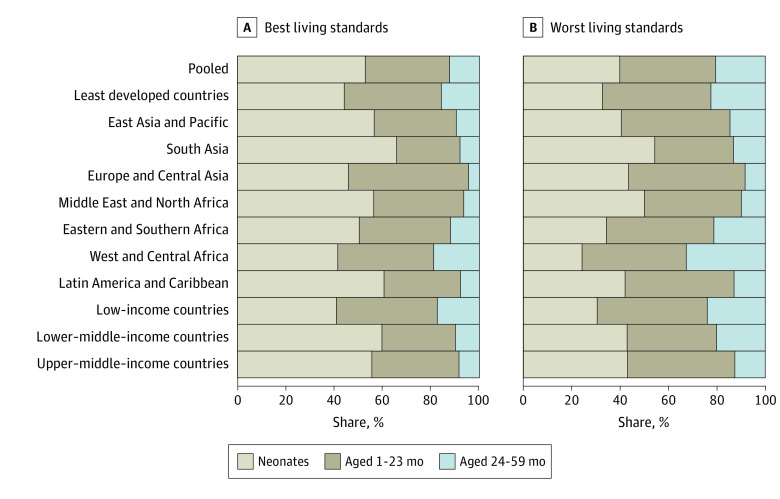
Conclusions and relevance: In this sample of 77 low- and middle-income countries, a large majority of deaths among children younger than 5 years occurred before 2 years of age in all countries among boys and girls and in households with the worst and best living standards. Research has highlighted perinatal complications, infections, and undernutrition as primary causes of death among children younger than 5 years. Therefore, coverage of interventions to reduce these adverse exposures should be ensured during pregnancy and the first 2 years after birth, which is also a crucial period for human development.
Conflict of interest statement
Figures
References
-
- United Nations Inter-agency Group for Child Mortality Estimation . Under-five mortality rate—total. 2021. Accessed March 22, 2022. https://childmortality.org/data
-
- University of Washington, Institute for Health Metrics and Evaluation; Global Health Data Exchange. GBD results tool. 2020. Accessed March 22, 2022. https://ghdx.healthdata.org/gbd-results-tool
Publication types
MeSH terms
LinkOut - more resources
Full Text Sources
Medical
