. 2022 Jul 15;132(14):e156290.
doi: 10.1172/JCI156290.

Stepwise GATA1 and SMC3 mutations alter megakaryocyte differentiation in a Down syndrome leukemia model

Affiliations

Stepwise GATA1 and SMC3 mutations alter megakaryocyte differentiation in a Down syndrome leukemia model

Brahim Arkoun et al. J Clin Invest. .

Abstract

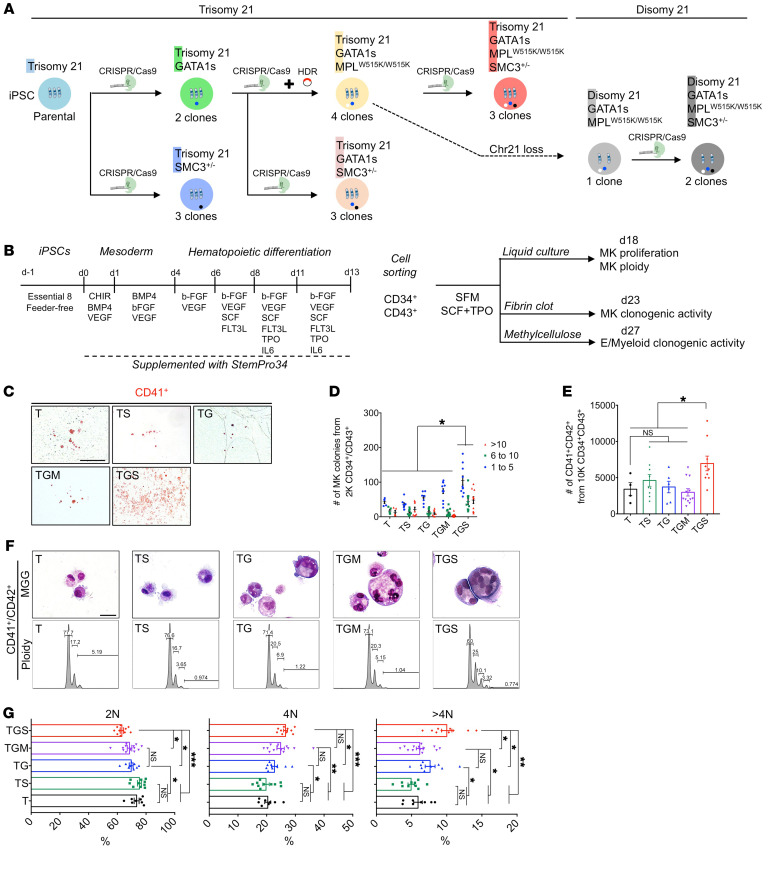
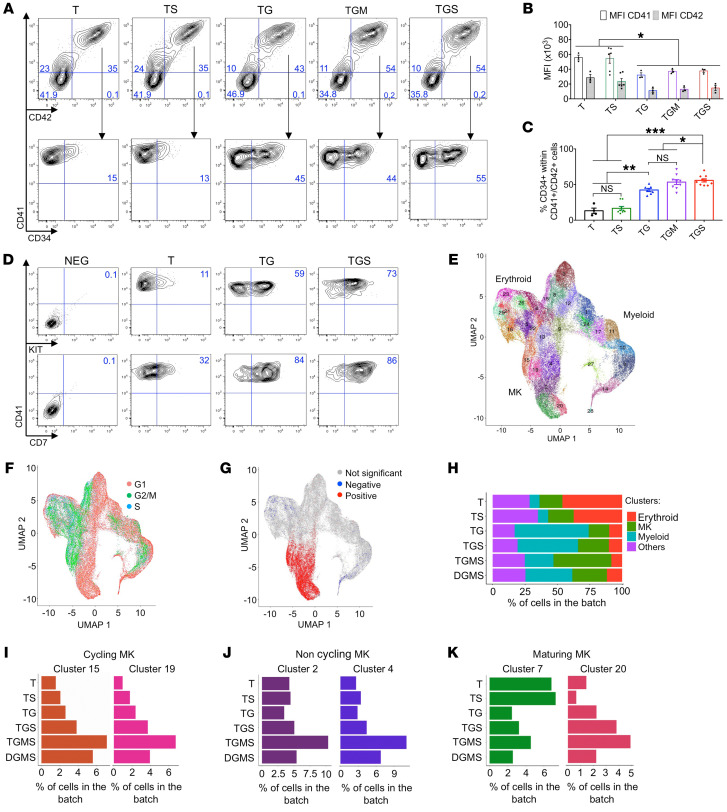
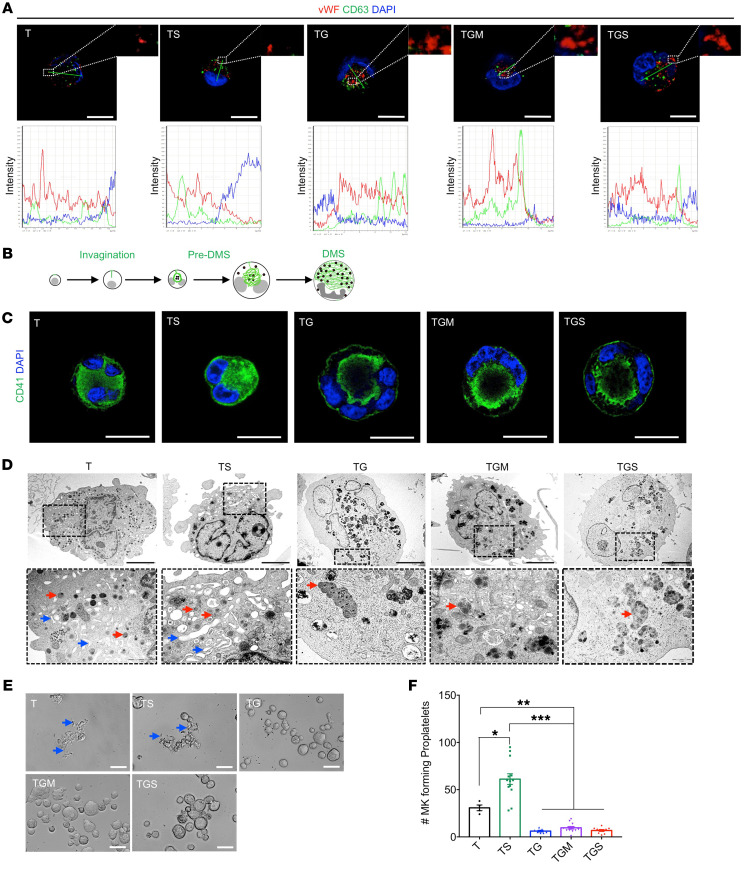
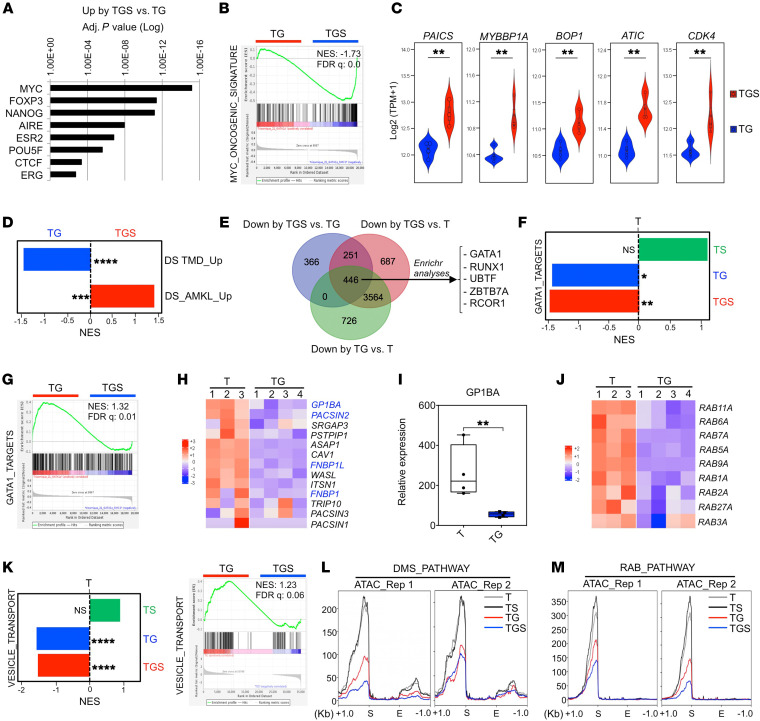
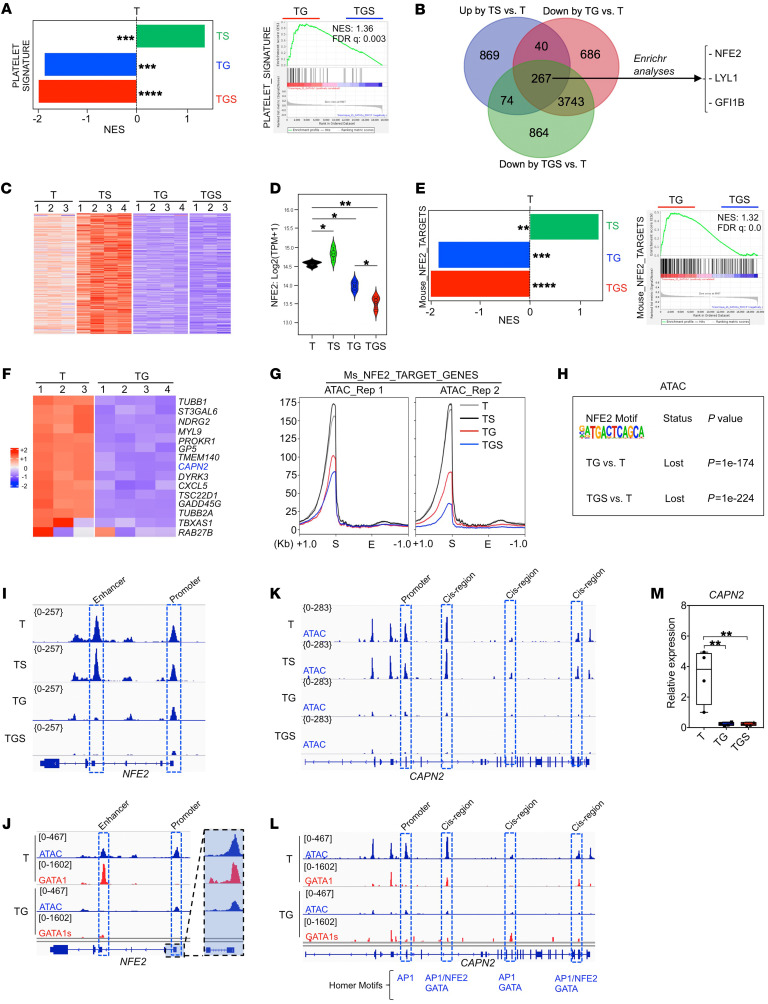
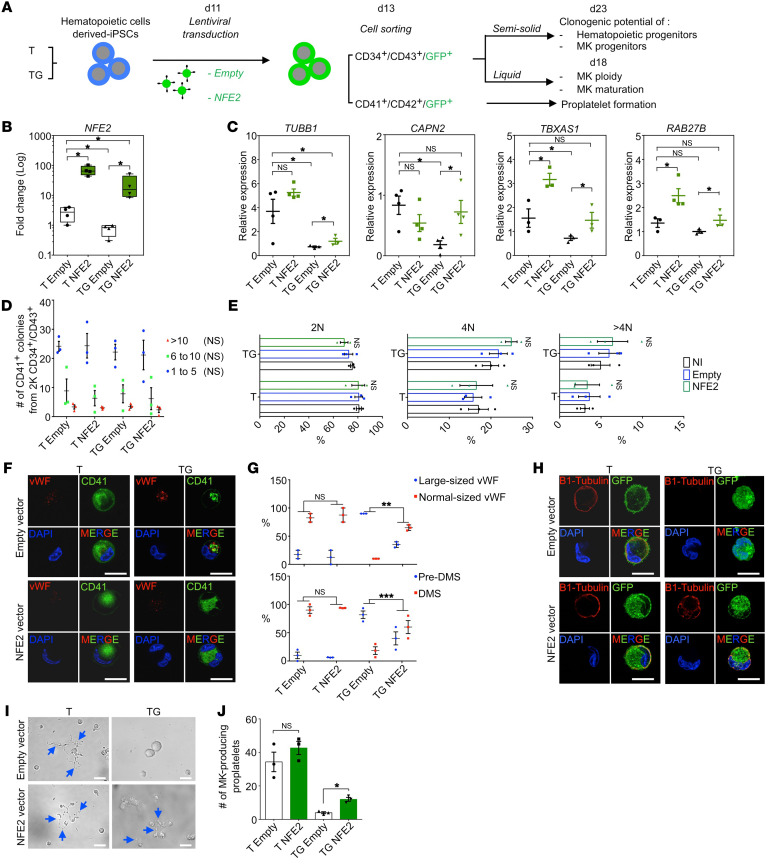
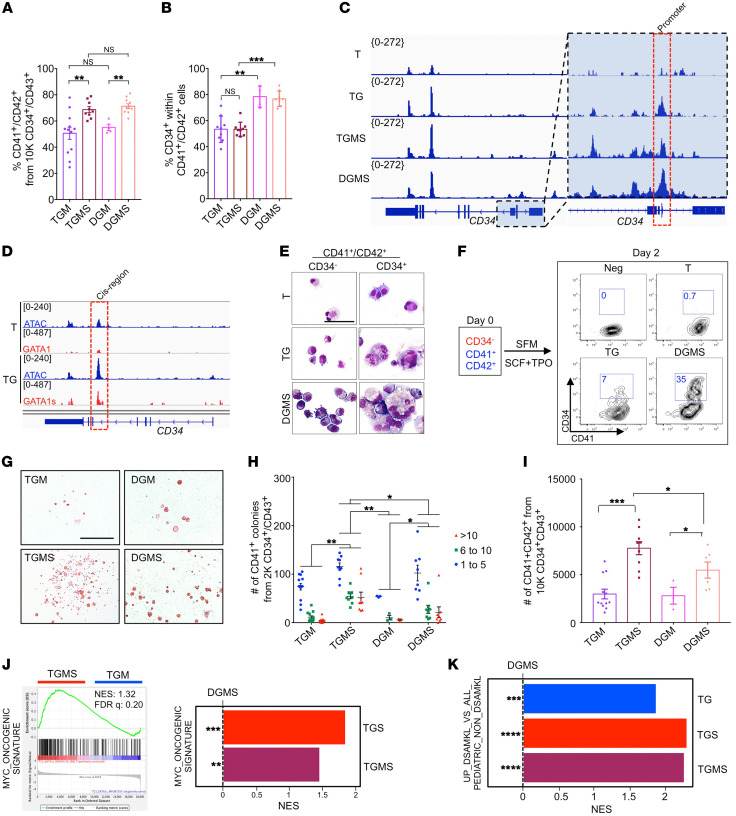
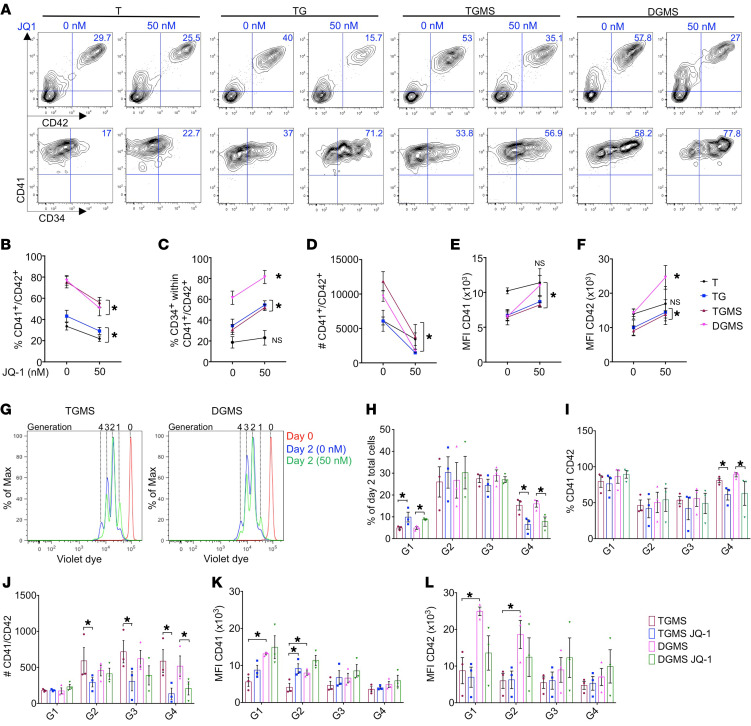
Acute megakaryoblastic leukemia of Down syndrome (DS-AMKL) is a model of clonal evolution from a preleukemic transient myeloproliferative disorder requiring both a trisomy 21 (T21) and a GATA1s mutation to a leukemia driven by additional driver mutations. We modeled the megakaryocyte differentiation defect through stepwise gene editing of GATA1s, SMC3+/-, and MPLW515K, providing 20 different T21 or disomy 21 (D21) induced pluripotent stem cell (iPSC) clones. GATA1s profoundly reshaped iPSC-derived hematopoietic architecture with gradual myeloid-to-megakaryocyte shift and megakaryocyte differentiation alteration upon addition of SMC3 and MPL mutations. Transcriptional, chromatin accessibility, and GATA1-binding data showed alteration of essential megakaryocyte differentiation genes, including NFE2 downregulation that was associated with loss of GATA1s binding and functionally involved in megakaryocyte differentiation blockage. T21 enhanced the proliferative phenotype, reproducing the cellular and molecular abnormalities of DS-AMKL. Our study provides an array of human cell-based models revealing individual contributions of different mutations to DS-AMKL differentiation blockage, a major determinant of leukemic progression.

Keywords: Hematology; Leukemias; Oncology.


Figures

Figure 1
Figure 1. GATA1s cooperates with SMC3+/– to increase MK clonogenic potential, proliferation, and polyploidization.
(A) Schematic overview of the iPSC clones generated by a stepwise introduction of GATA1s, MPLW515K, and SMC3+/–, using CRISPR/Cas9. Bold letters highlight the abbreviation used hereafter. The number of clones obtained for each genotype and subjected to MK differentiation studies is indicated. The dashed arrow indicates the isogenic D iPSC clone harboring GATA1s and MPLW515K mutations randomly obtained through loss of 1 chromosome 21. (B) Schematic overview of the hematopoietic differentiation method used and the subsequent MK phenotypic characterization. (C) Representative images of CFU-MK colonies. Scale bar: 500 μm. (D) Histogram of the number of CD41+ colonies obtained from 2000 CD34+CD43+ in fibrin clot assay. (E) Histogram of the number of CD41+CD42+ MKs obtained from 10,000 CD34+CD43+ in liquid culture assay. Data are represented as mean ± SEM; n = 3–4. The number of clones tested per genotype was as follows: T/parental = 1; TS = 3; TG = 2; TGM = 4; TGS = 3. (F) May-Grünwald-Giemsa (MGG) staining (E, upper panels) and ploidy plots (E, lower panels) of iMK according to the indicated genotypes. T and TS CD41+CD42+ showed typically mature micro-MKs with acidophilic cytoplasm, while TG, TGM, or TGS showed large polyploid immature MKs with basophilic cytoplasm. Scale bar: 50 μm. (G) Histograms of the percentages of 2N, 4N, and >4N of iMKs. Data are represented as mean ± SEM; n = 3 to 8. The number of clones tested per genotype was as follows: T/parental = 1; TS = 2; TG = 2; TGM = 4; TGS = 3. Statistical significance was determined using 1-tailed Mann-Whitney U test. *P < 0.05; **P < 0.01; ***P < 0.001.
Figure 2
Figure 2. Assessment of iMK differentiation alterations.
(AD) Immunophenotypes of iMKs for the CD34, KIT, CD7, CD41, and CD42 markers found in DS-AMKL patient blasts. (A) Contour plots showing the expression of CD34, CD41, and CD42 markers. (B) Histogram shows the MFI of CD41 and CD42. (C) Histogram shows the percentage of CD34+CD41+ per total CD41+ population. Data in B and C are represented as mean ± SEM; n = 3–4. The number of clones tested per genotype was as follows: T/parental = 1; TS = 2; TG = 2; TGM = 3; TGS = 3. Statistical significance was determined using 1-tailed Mann-Whitney’s U test: *P < 0.05; **P < 0.01; ***P < 0.001. (D) Representative contour plots of KIT and CD7 expression in the iMK population from 2 independent experiments. (E and F) scRNA-Seq of CD43+ iPSC-derived hematopoietic cells at day 13 of culture. (E) UMAP integration of cells from all conditions. Clusters were defined using the Louvain algorithm and numbered and labeled with unique colors. (F) UMAP integration with cells colored according to the predicted cell-cycle stage (Seurat method). (G) UMAP integration with cells colored according to the enrichment in a MK signature. Red, cells are significantly enriched for the signature; blue, cells are significantly depleted for the signature; gray, no significant enrichment. (H) Bar plot shows the proportion of cells in the indicated hematopoietic lineages for each condition. (I) Bar plots of the proportion of cells in the 2 clusters of cycling MKs. (J) Bar plots of the proportion of cells in the 2 clusters of noncycling MKs. (K) Bar plots of the proportion of cells in the 2 clusters of maturing MKs. Cluster 7 represents normal maturing MKs. Cluster 20 represents an abnormal MK population.
Figure 3
Figure 3. Assessment of MK maturation and platelet formation.
(A) Confocal analyses of vWF and CD63 expression in MK (left panel) and colocalization analyses (right panel). Scale bars: 50 μm. (B) Schematic overview of the normal development steps of DMS. (C) Confocal analysis of CD41 marker distribution in iMKs. Scale bars: 50 μm. (D) Ultrastructural characterization of the iMK according to the compared genotypes. A representative MK is shown for each condition (upper panels), a part of which (dotted square) is enlarged (lower panels). More than 80% of T and TS MKs showed maturity characteristics associated with condensed nuclei, a well-developed DMS (blue arrows), and the presence of normal α-granules (red arrows). More than 90% of TG, TGM, and TGS MKs showed blockages in maturation characterized by the presence of uncondensed nuclei majorly composed of euchromatin and the absence of DMS formation, with endosomes presenting an abnormal accumulation of granules (red arrows). Scale bars: 5 μm. (E) Representative microphotographs of CD41+CD42+ iMKs under PPT formation assay. PPT-forming MKs are highlighted with blue arrows in the T and TS conditions. Scale bars: 50 μm. (F) Histogram of the number of PPT-forming MKs in the compared conditions. Data are represented as mean ± SEM; n = 3–4. The number of clones tested per genotype was as follows: T/parental = 1; TS = 3; TG = 2; TGM = 4; TGS = 3. Statistical significance was determined using 1-tailed Mann-Whitney’s U test. *P < 0.05; **P < 0.01; ***P < 0.001.
Figure 4
Figure 4. GATA1s cooperates with SMC3+/– to acquire DS-AMKL features in iMK.
(A) Transcriptional signature (transcription factor protein-protein interactions) of the upregulated genes in TGS versus TG iMKs. (B) GSEA of the MYC oncogenic signature in TGS versus TG. (C) Violin plots showing expression (GSEA) of the MYC target genes in TGS versus TG. **P < 0.01. (D) GSEA of the genes upregulated in DS-TMD compared with DS-AMKL or the genes upregulated in DS-AMKL compared with DS-TMD (31) patients in TGS versus TG iMKs. ***FDR < 0.01; ****FDR < 0.001. (E) Venn diagram showing the overlap of downregulated genes in the indicated comparisons. The top transcriptional signatures from the commonly downregulated genes in the compared conditions are annotated with an adjusted P < 0.000001 (Encode and ChEA Consensus TFs from CHIP-X). (F) GSEA for GATA1 gene targets (32) in TS versus T, TG versus T, and TGS versus T iMK. NES, normalized enrichment score. *FDR < 0.25; **FDR < 0.05. (G) GSEA for GATA1 gene targets (32) in TGS versus TG iMKs. (H) Heatmap showing the expression of genes encoding the F-BAR domain-containing proteins in T versus TG iMKs. Genes known to be direct targets of GATA1 (32) are marked in blue. (I) RT-qPCR analysis of GP1BA relative expression in T versus TG iMKs. **P < 0.01. (J) Heatmap showing the expression of the RAB family genes in T versus TG iMKs. (K) GSEA for vesicle-mediated transport (GO term GO:0016192) in T versus TG or TG versus TGS iMKs. ****FDR < 0.001. (L) Profile plots of ATAC signal on DMS genes comparing T, TS, TG, and TGS iMKs. The start (S) and the end (E) of the genes were plotted across a 1 kb flanking window; the y axis indicates depth per million mapped reads. Left panel: replicate (Rep) 1; right panel: replicate 2. (M) Profile plots of ATAC signal on RAB family genes comparing T, TS, TG, and TGS iMKs.
Figure 5
Figure 5. GATA1s cooperates with SMC3+/– to downregulate the NFE2 transcriptional program.
(A) GSEA for platelet genes (47) in the indicated comparisons. ***FDR < 0.01; ****FDR < 0.001. (B) Venn diagram showing the overlap of up- and downregulated genes in the indicated comparisons. The top transcriptional signatures from the commonly downregulated genes in TG or TGS and upregulated in TS compared with T are annotated with an adjusted P < 0.0001 (Enrichr submissions TF-gene cooccurrence). (C) Heatmap showing the expression of the 267 genes that are common in all comparisons (up by TS versus T, down by TG versus T, down by TGS versus T) shown in the Venn diagram in B. (D) Violin plot showing NFE2 expression in the indicated conditions. *P < 0.05 and *P < 0.01. (E) GSEA for NFE2 target genes (39) in TS versus T, TG versus T or TGS versus T (left panel), and TGS versus TG (right panel) iMKs. **FDR < 0.05; ***FDR < 0.01; ****FDR < 0.001. (F) Heatmap showing the expression of NFE2 target genes that are downregulated in TG compared with T. CAPN2 gene marked in blue is also known as a direct target of GATA1. (G) Profile plots of ATAC signal from NFE2 target genes (Zang et al., 2016) comparing T, TS, TG, and TGS iMKs. The start (S) and the end (E) of the genes were plotted across a 1 kb flanking window; the y axis indicates depth per million mapped reads. Left: replicate 1; right, replicate 2. (H) Relative loss of the NFE2 motif in ATAC-Seq data from the indicated comparisons. (I) ATAC-Seq profile on NFE2 in T, TS, TG, and TGS. (J) Track depicting CUT&TAG-Seq for GATA1 and GATA1s and ATAC-Seq on the NFE2 locus in T or TG iMKs. (K) ATAC-Seq profile on CAPN2 in T, TS, TG, and TGS. (L) Track depicting CUT&TAG-Seq for GATA1 and GATA1s and ATAC-Seq on the CAPN2 locus in T or TG iMKs. (M) RT-qPCR analysis of CAPN2 expression in T, TS, TG, and TGS iMK.
Figure 6
Figure 6. NFE2 overexpression in TG MK partially rescues maturation and PPT defects.
(A) Schematic overview of NFE2 overexpression strategy in T and TG iMKs and of subsequent phenotypic studies. (B) Validation by RT-qPCR of NFE2 overexpression in T and TG iMKs. (C) RT-qPCR analyses of the known NFE2 target gene expression with empty or NFE2 lentiviral vectors. (D) Effect of NFE2 overexpression on the clonogenic potential of T and TG iMKs. (E) Effect of NFE2 overexpression on the ploidization of T and TG iMKs. (F) Confocal analyses of NFE2 overexpressing MK in T and TG for CD41 and vWF expression. Scale bars: 50 μm. (G) Histograms of the percentages of MKs with normal or large-sized vWF (upper panel) and the percentages of MKs with pre-DMS or DMS (lower panel) according to the absence (empty) or presence of NFE2 lentiviral vector. Quantifications were performed on 20 MKs from 3 independent experiments. (H) Confocal analyses of β1-tubulin expression in T- and TG-derived MKs according to the absence (empty) or presence of NFE2 lentiviral vector. Scale bars: 50 μm. (I) Representative microphotographs of CD41+CD42+ MKs under PPT formation assay. Note the presence of PPT-forming MKs (blue arrows) in the absence or presence of NFE2 lentivector for the T, while in TG, the presence of PPT-forming MK was observed only in the presence of NFE2 lentivector (blue arrows). Scale bars: 50 μm. (J) Histogram of the number of PPT-forming MK shown in I according to the compared genotypes. Data are represented as mean ± SEM; n = 3. Statistical significance was determined using 1-tailed Mann-Whitney’s U test. *P < 0.05; **P < 0.01; ***P < 0.001.
Figure 7
Figure 7. T21 acts in synergy with GATA1s and SMC3+/– to increase MK proliferation and to acquire DS-AMKL features.
(A) Histogram of the mean percentage of CD41+CD42+ cells. (B) Percentage of CD34+CD41+ within the CD41+ MK population. Data are represented as mean ± SEM; n = 3 to 4. The number of clones tested per genotype was as follows: TGM = 4; TGMS = 3; DGM = 1; DGMS = 2. (C) ATAC-Seq profile on CD34 in T, TG, TGMS, and DGMS. (D) Track depicting CUT&TAG-Seq for GATA1 and GATA1s and ATAC-Seq at the CD34 locus in T or TG iMKs. (E) May-Grünwald-Giemsa coloration of CD34 or CD34+ fractions within the CD41+CD42+ cell population in T, TG, and DGMS. Scale bar: 50 μm. (F) Contour plots show CD34 expression in T, TG, and DGMS iMKs after 2 days of culture. Negative control (Neg CTL): MKs incubated without CD34 antibody. (G) Representative microphotographs of CFU-MK colonies in fibrin clot assay for TGM, TGMS, DGM, and DGMS. Scale bar: 500 μm. (H) Mean number of CFU-MK colonies obtained from 2000 CD34+CD43+ in fibrin clot assay. (I) Mean number of CD41+CD42+ MKs from 10,000 CD34+CD43+ in liquid cultures. (J) GSEA for the MYC oncogenic signature comparing indicated conditions. (K) GSEA for the upregulated genes in DS-AMKL versus non-DS AMKL pediatric patients in TGS versus DGMS or TGMS versus DGMS iMKs. Statistical significance was determined using 1-tailed Mann-Whitney U test. *P < 0.05; **P < 0.01; ***P < 0.001.
Figure 8
Figure 8. Assessment of MYC inhibition on iMK proliferation and differentiation.
(AF) Immunophenotypes of iMKs for the CD34, CD41, and CD42 markers found after JQ1 treatment. (A) Contour plots showing the expression of CD34, CD41, and CD42 markers. (B) Before-and-after graph shows the percentage of CD41+ CD42+. (C) Before-and-after graph shows the percentage of CD34+ cells within the total CD41+CD42+ cell population. (D) Before-and-after graph shows the absolute number of CD41 and CD42. (E) Before-and-after graph shows the MFI of CD41. (F) Before-and-after graph shows the MFI of CD42. Data in B through F are represented as mean ± SEM; n = 3. Conditions with or without JQ-1 are compared, and statistical significance was determined using 1-tailed Mann-Whitney’s U test. *P < 0.05. (G) Representative flow cytometry plots of a violet dye experiment at day 2 of culture in the TGMS versus DGMS. Red, day 0 of culture; blue, dimethyl sulfoxide control; green, JQ-1. The number of generations is indicated at the top of the plot. (H) Histogram of the percentage of day 2 total cells per generation (G) in the indicated conditions. (I) Histogram shows the percentage of CD41+CD42+ per generation in the indicated conditions. (J) Histogram shows the absolute number of CD41+CD42+ in the indicated conditions per generation. (K) Histogram shows the MFI of CD41 per generation in the indicated conditions. (L) Histogram shows the MFI of CD42 per generation in the indicated conditions. Data are represented as mean ± SEM; n = 3. Conditions with or without JQ-1 are compared, and statistical significance was determined using the Kruskal-Wallis test. *P < 0.05.

Comment in

References

    1. Lopez CK, et al. Pediatric acute megakaryoblastic leukemia: multitasking fusion proteins and oncogenic cooperations. Trends Cancer. 2017;3(9):631–642. doi: 10.1016/j.trecan.2017.07.003. - DOI - PubMed
    1. McNulty M, Crispino JD. Acute megakaryocytic leukemia. Cold Spring Harb Perspect Med. 2020;10(2):a034884. doi: 10.1101/cshperspect.a034884. - DOI - PMC - PubMed
    1. Roberts I, et al. The impact of trisomy 21 on foetal haematopoiesis. Blood Cells Mol Dis. 2013;51(4):277–281. doi: 10.1016/j.bcmd.2013.07.008. - DOI - PMC - PubMed
    1. Garnett C, et al. GATA1 and cooperating mutations in myeloid leukaemia of Down syndrome. IUBMB Life. 2020;72(1):119–130. doi: 10.1002/iub.2197. - DOI - PubMed
    1. Wechsler J, et al. Acquired mutations in GATA1 in the megakaryoblastic leukemia of Down syndrome. Nat Genet. 2002;32(1):148–152. doi: 10.1038/ng955. - DOI - PubMed

Publication types

MeSH terms

Substances