

Connecting past to present: Examining different approaches to linking historical redlining to present day health inequities
- PMID: 35587478
- PMCID: PMC9119533
- DOI: 10.1371/journal.pone.0267606
Connecting past to present: Examining different approaches to linking historical redlining to present day health inequities
Abstract
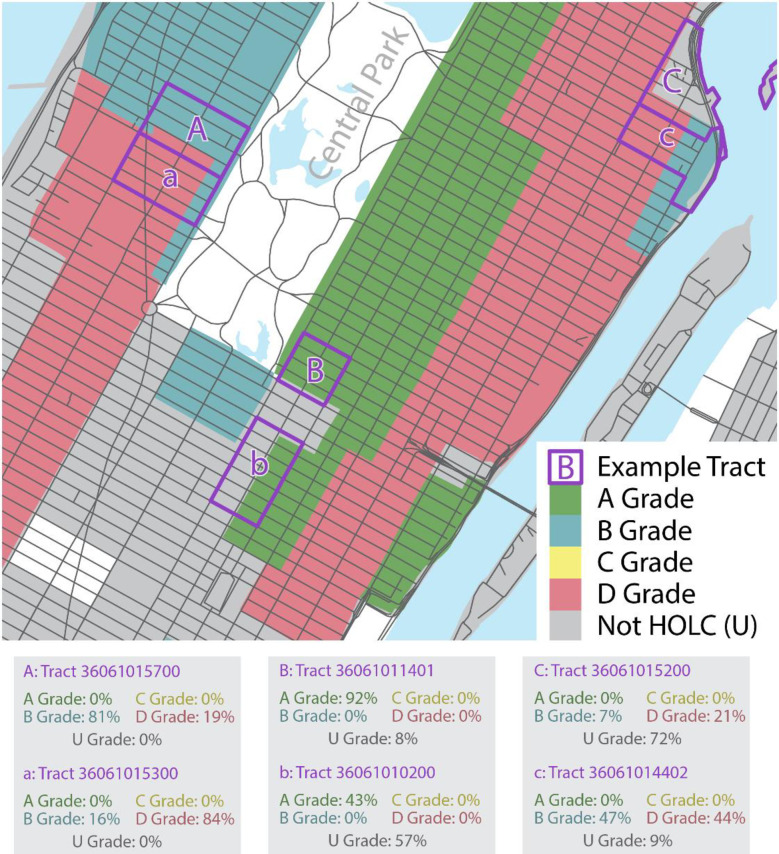
In the 1930's, the Home Owner Loan Corporation (HOLC) drafted maps to quantify variation in real estate credit risk across US city neighborhoods. The letter grades and associated risk ratings assigned to neighborhoods discriminated against those with black, lower class, or immigrant residents and benefitted affluent white neighborhoods. An emerging literature has begun linking current individual and community health effects to government redlining, but each study faces the same measurement problem: HOLC graded area boundaries and neighborhood boundaries in present-day health datasets do not match. Previous studies have taken different approaches to classify present day neighborhoods (census tracts) in terms of historical HOLC grades. This study reviews these approaches, examines empirically how different classifications fare in terms of predictive validity, and derives a predictively optimal present-day neighborhood redlining classification for neighborhood and health research.
Conflict of interest statement
The authors have declared that no competing interests exist.
Figures
References
-
- Faber JW. We Built This: Consequences of New Deal Era Intervention in America’s Racial Geography. Am Sociol Rev. 2020;85: 739–775. doi: 10.1177/0003122420948464 - DOI
-
- Aaronson D, Hartley D, Mazumder B. The Effects of the 1930s HOLC “Redlining” Maps. Federal Reserve Bank of Chicago; 2020. Report No.: 2017–12. Available: https://www.chicagofed.org/publications/working-papers/2017/wp2017-12
-
- Fishback PV, LaVoice J, Shertzer A, Walsh R. Race, Risk, and the Emergence of Federal Redlining. National Bureau of Economic Research; 2020. Nov. Report No.: 28146. doi: 10.3386/w28146 - DOI
-
- Aaronson D, Faber J, Hartley D, Mazumder B, Sharkey P. The long-run effects of the 1930s HOLC “redlining” maps on place-based measures of economic opportunity and socioeconomic success. Regional Science and Urban Economics. 2021;86: 103622. doi: 10.1016/j.regsciurbeco.2020.103622 - DOI
Publication types
MeSH terms
LinkOut - more resources
Full Text Sources
Miscellaneous
