Pilot study evaluating everolimus molecular mechanisms in tuberous sclerosis complex and focal cortical dysplasia
- PMID: 35587487
- PMCID: PMC9119437
- DOI: 10.1371/journal.pone.0268597
Pilot study evaluating everolimus molecular mechanisms in tuberous sclerosis complex and focal cortical dysplasia
Abstract
Background: Tuberous sclerosis complex (TSC) and some focal cortical dysplasias (FCDs) are associated with dysfunctional mTOR signaling, resulting in increased cell growth and ribosomal S6 protein phosphorylation (phospho-S6). mTOR inhibitors can reduce TSC tumor growth and seizure frequency, and preclinical FCD studies indicate seizure suppression. This pilot study evaluated safety of mTOR inhibitor everolimus in treatment resistant (failure of >2 anti-seizure medications) TSC and FCD patients undergoing surgical resection and to assess mTOR signaling and molecular pathways.
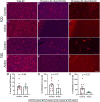
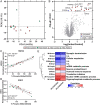
Methods and findings: We evaluated everolimus in 14 treatment resistant epilepsy patients undergoing surgical resection (4.5 mg/m2 daily for 7 days; n = 4 Active, mean age 18.3 years, range 4-26; n = 10, Control, mean age 13.1, range 3-45). Everolimus was well tolerated. Mean plasma everolimus in Active participants were in target range (12.4 ng/ml). Brain phospho-S6 was similar in Active and Control participants with a lower trend in Active participants, with Ser235/236 1.19-fold (p = 0.67) and Ser240/244 1.15-fold lower (p = 0.66). Histologically, Ser235/236 was 1.56-fold (p = 0.37) and Ser240/244 was 5.55-fold lower (p = 0.22). Brain proteomics identified 11 proteins at <15% false discovery rate associated with coagulation system (p = 1.45x10⁻⁹) and acute phase response (p = 1.23x10⁻⁶) activation. A weighted gene correlation network analysis (WGCNA) of brain proteomics and phospho-S6 identified 5 significant modules. Higher phospho-S6 correlated negatively with cellular respiration and synaptic transmission and positively with organophosphate metabolic process, nuclear mRNA catabolic process, and neuron ensheathment. Brain metabolomics identified 14 increased features in Active participants, including N-acetylaspartylglutamic acid. Plasma proteomics and cytokine analyses revealed no differences.
Conclusions: Short-term everolimus before epilepsy surgery in TSC and FCD resulted in no adverse events and trending lower mTOR signaling (phospho-S6). Future studies should evaluate implications of our findings, including coagulation system activation and everolimus efficacy in FCD, in larger studies with long-term treatment to better understand molecular and clinical effects.
Clinical trials registration: ClinicalTrials.gov NCT02451696.
Conflict of interest statement
I have read the journal’s policy and the authors of this manuscript have the following competing interests: All the authors report no conflicts of interest. Below are the disclosures of the three authors: Daniel Friedman receives salary support for consulting and clinical trial related activities performed on behalf of The Epilepsy Study Consortium, a non-profit organization. Dr. Friedman receives no personal income for these activities. NYU receives a fixed amount from the Epilepsy Study Consortium towards Dr. Friedman’s salary. Within the past two years, The Epilepsy Study Consortium received payments for research services performed by Dr. Friedman from: Alterity, Baergic, Biogen, BioXcell, Cerevel, Cerebral, Jannsen, Lundbeck, Neurocrine, SK Life Science, and Xenon. He has also served as a paid consultant for Neurelis Pharmaceuticals and Receptor Life Sciences. He has received research support from NINDS, CDC, Epitel, and Neuropace unrelated to this study. He holds equity interests in Neuroview Technology. He received royalty income from Oxford University Press. Sasha Devore receives salary support from the National Institutes of Health, Department of Defense, and the Templeton World Charity Foundation unrelated to this study. Orrin Devinsky receives grant support from NINDS, NIMH, MURI, CDC and NSF. He has equity and/or compensation from the following companies: Tilray, Receptor Life Sciences, Qstate Biosciences, Tevard, Empatica, Engage, Egg Rock/Papa & Barkley, Rettco, SilverSpike, and California Cannabis Enterprises (CCE). He has received consulting fees from Zogenix, Ultragenyx, BridgeBio, and Marinus. He holds patents for the use of cannabidiol in treating neurological disorders but these are owned by GW Pharmaceuticals and he has waived any financial interests. He holds other patents in molecular biology. This does not alter our adherence to PLOS ONE policies on sharing data and materials.
Figures


Similar articles
-
mTOR Hyperactivity Levels Influence the Severity of Epilepsy and Associated Neuropathology in an Experimental Model of Tuberous Sclerosis Complex and Focal Cortical Dysplasia.J Neurosci. 2019 Apr 3;39(14):2762-2773. doi: 10.1523/JNEUROSCI.2260-18.2019. Epub 2019 Jan 30. J Neurosci. 2019. PMID: 30700531 Free PMC article.
-
mTOR pathway activation in focal cortical dysplasia.Ann Diagn Pathol. 2020 Jun;46:151523. doi: 10.1016/j.anndiagpath.2020.151523. Epub 2020 Apr 10. Ann Diagn Pathol. 2020. PMID: 32325422
-
Efficacy and safety of Everolimus in children with TSC - associated epilepsy - Pilot data from an open single-center prospective study.Orphanet J Rare Dis. 2016 Nov 3;11(1):145. doi: 10.1186/s13023-016-0530-z. Orphanet J Rare Dis. 2016. PMID: 27809914 Free PMC article.
-
Mechanistic target of rapamycin (mTOR) in tuberous sclerosis complex-associated epilepsy.Pediatr Neurol. 2015 Mar;52(3):281-9. doi: 10.1016/j.pediatrneurol.2014.10.028. Epub 2014 Nov 20. Pediatr Neurol. 2015. PMID: 25591831 Review.
-
Genetic pathogenesis of the epileptogenic lesions in Tuberous Sclerosis Complex: Therapeutic targeting of the mTOR pathway.Epilepsy Behav. 2022 Jun;131(Pt B):107713. doi: 10.1016/j.yebeh.2020.107713. Epub 2021 Jan 9. Epilepsy Behav. 2022. PMID: 33431351 Review.
Cited by
-
Serotonin receptor expression in hippocampus and temporal cortex of temporal lobe epilepsy patients by postictal generalized electroencephalographic suppression duration.Epilepsia. 2022 Nov;63(11):2925-2936. doi: 10.1111/epi.17400. Epub 2022 Sep 5. Epilepsia. 2022. PMID: 36053862 Free PMC article.
-
Raphe and ventrolateral medulla proteomics in sudden unexplained death in childhood with febrile seizure history.Acta Neuropathol. 2024 Nov 28;148(1):76. doi: 10.1007/s00401-024-02832-9. Acta Neuropathol. 2024. PMID: 39607506 Free PMC article.
-
LC-MS-Based Targeted Metabolomics for FACS-Purified Rare Cells.Anal Chem. 2023 Mar 7;95(9):4325-4334. doi: 10.1021/acs.analchem.2c04396. Epub 2023 Feb 22. Anal Chem. 2023. PMID: 36812587 Free PMC article.
-
Metabolomic, proteomic, and transcriptomic changes in adults with epilepsy on modified Atkins diet.Epilepsia. 2023 Apr;64(4):1046-1060. doi: 10.1111/epi.17540. Epub 2023 Feb 24. Epilepsia. 2023. PMID: 36775798 Free PMC article.
-
Localized proteomic differences in the choroid plexus of Alzheimer's disease and epilepsy patients.Front Neurol. 2023 Jul 14;14:1221775. doi: 10.3389/fneur.2023.1221775. eCollection 2023. Front Neurol. 2023. PMID: 37521285 Free PMC article.
References
-
- Ellison D, Love S, Chimelli L, Harding B, Lowe J, Vinters H, et al.. Neuropathology: a reference text of CNS pathology. Third ed: MOSBY an imprint of Elsevier Limited; 2013.
-
- Blümcke I, Thom M, Aronica E, Armstrong DD, Vinters HV, Palmini A, et al.. The clinicopathologic spectrum of focal cortical dysplasias: a consensus classification proposed by an ad hoc Task Force of the ILAE Diagnostic Methods Commission. Epilepsia. 2011;52(1):158–74. Epub 2010/11/10. doi: 10.1111/j.1528-1167.2010.02777.x . - DOI - PMC - PubMed
Publication types
MeSH terms
Substances
Associated data
Grants and funding
LinkOut - more resources
Full Text Sources
Medical
Miscellaneous

